Diffusion Tensor Imaging Changes Correlate with Clinical Progression in Vascular Mild Cognitive Impairment and Vascular Dementia of Subcortical Type
Na Young Ryoo, M.D.*, Byung-Nam Yoon, M.D.*, Cindy W Yoon, M.D.*, Jong-Hyeon Ahn, M.D.*, Jun Yong Choi, M.D.*, Myung Kwan Lim, M.D.†, Hunki Kwon, M.S.‡, Jun-Sung Park, M.S.‡, Jong-Min Lee, Ph.D.‡, Seong Hye Choi, M.D.*
Departments of Neurology*, Radiology†, Inha University School of Medicine, Incheon;
Department of Biomedical Engineering‡, Hanyang University, Seoul, Korea
Background: Cerebral small vessel disease (SVD) induces vascular cognitive impairment (VCI) such as subcortical vascular dementia (SVaD) and subcortical vascular mild cognitive impairment (svMCI). We compared MRI parameters between SVaD and svMCI and determined which MRI parameters best cor- related with cognitive function and disability on cross-sectional and longitudinal analyses within them.
Methods: Twenty-four patients with SVaD and twelve with svMCI were recruited. They underwent multi- modal MRIs including fluid-attenuated inversion recovery lesion load, lacunar infarct number, and frac- tional anisotropy (FA) and mean diffusivity (MD) from diffusion tensor imaging (DTI), neuropsychological testing, Sum of Boxes of Clinical Dementia Rating Scale (CDR-SB), Barthel Index, and the Korean ver- sion of a Geriatric Depression Scale (GDS-K). Seventeen patients were retested after 20 months for a brain MRI and clinical evaluation. Results: There were significant differences in average MD and peak height of MD histograms within normal-appearing brain tissue (NABT) between SVaD and svMCI pa- tients. In the cross-sectional analysis, average MD within NABT significantly correlated with the compos- ite neuropsychology score (r =-0.80, p<0.001), the composite executive function score (r =-0.67, p<
0.001), and the CDR-SB (r =0.54, p=0.001), and the Barthel Index correlated with peak heights of the MD histograms (r =0.37, p=0.03) in NABT. Changes of CDR-SB was associated with changes of aver- age MD within WMH (r =0.57, p=0.02), and changes of GDS-K was associated with changes of WMH volume (r =0.51, p=0.04) on a longitudinal scale. Conclusions: DTI parameters in NABT correlated with cognitive impairment and disability in VCI associated with SVD. Clinical progression of SVD was associ- ated with some increment of WML volume and ultrastructural changes in WMH.
Received: July 12, 2013
Revision received: September 9, 2013 Accepted: September 9, 2013
Address for correspondence Seong Hye Choi, M.D.
Department of Neurology, Inha University Hospital, 27 Inhang-ro, Jung-gu, Incheon 400-711, Korea Tel: +82-32-890-3860
Fax: +82-32-890-3864 E-mail: [email protected]
This study was supported by grants from the Korea Healthcare Technology R&D Project, Ministry of Health and Welfare, Republic of Korea
(HI10C2020), and Inha University. Key Words: Subcortical vascular dementia, Small vessel disease, Diffusion tensor imaging
INTRODUCTION
Cerebral small vessel disease (SVD) is the most frequent cause of vascular cognitive impairment (VCI) [1, 2] and in- duces subcortical vascular dementia (SVaD) and mild cogni- tive impairment (MCI) associated with SVD [3-5]. Some re- searchers have called MCI associated with SVD as subcortical
vascular MCI (svMCI) [5]. Cognitive syndrome observed in cerebral SVD is a loss of executive function and mild memo- ry deficits [3, 4]. Cerebral SVD is also associated with a de- cline of motor performances, depressive symptoms, and uri- nary disturbances [6]. The neuroimaging correlations of ce- rebral SVD include ischemic white matter hyperintensities (WMHs), lacunar infarctions, and microbleeds [7].
© 2013 Korean Dementia Association
This is an Open Access article distributed under the terms of the Creative Commons Attribution Non-Commercial License (http://creativecommons.org/licenses/by-nc/3.0) which permits unrestricted non-commercial use, distribution, and reproduction in any medium, provided the original work is properly cited.
Many studies have correlated the volume of WMHs on MRIs with clinical and cognitive parameters, but results have not been consistent [8-10]. Executive dysfunction in cerebral SVD did not correlate with the volume of WMHs but correlated with diffusion tensor imaging (DTI) parameters of fractional anisotropy (FA) and mean diffusivity (MD) in the previous cross-sectional studies [10, 11]. A 2-year follow-up study in cerebral autosomal-dominant arteriopathy with subcortical ischemic leukoencephalopathy (CADASIL) detected that change in MD correlated with changes in clinical scores [12].
In the study, T2-lesion volumes correlated with clinical pa- rameters in baseline analysis, but that changes in T2-lesion volumes did not correlate with changes in clinical scores. How- ever, there were no correlations between changes in the DTI parameters and the clinical scores in a 1-year follow-up study of sporadic SVD [11]. Also in the study, no changes were fo- und in cognition or disability over the 1-year follow-up. A one year follow-up might be too short to detect some clinical change in sporadic SVD because of its slow progression. Pre- vious studies also reported that ultrastructual abnormalities of normal appearing brain tissue (NABT) have a strong effect on cognitive function, whereas MD or FA within WMHs has no direct impact on it [10, 13, 14].
There are few studies comparing MRI findings between SVaD and svMCI. A recent study did not show significant differences of WMH volume and DTI parameters between SVaD and vascular cognitive impairment no dementia (VCI- ND) associated with SVD [15]. The sample size might be too small to detect some change in DTI parameters between SVaD and VCIND associated with SVD in the study.
The aims of this study were to compare MRI parameters between SVaD and svMCI and to determine which MRI pa- rameters best correlated with cognitive function and disabili- ty on cross-sectional and longitudinal analyses in VCI associ- ated with cerebral SVD.
METHODS
Subjects
Twenty-four patients with SVaD and twelve with svMCI
were recruited from the Memory Disorders Clinic at Inha University Hospital from December 2007 to April 2010. The patients with SVaD fulfilled the criteria of VaD by the Diag- nostic and Statistical Manual of Mental Disorders, Fourth Edition [16] and SVaD clinical criteria and imaging criteria of “white matter cases” suggested by Erkinjuntti et al. [3], which require severe WMHs on T2-weighted or FLAIR images and at least one lacunar infarct. They had a presence or a history of focal neurologic signs. Diagnoses of svMCI were based on the following criteria modified from those proposed by Win- blad et al. [17] and Erkinjuntti et al. [3]: 1) neither normal nor dementia, 2) subjective report of cognitive decline by self and/or informant, 3) objective cognitive decline below 1.5 standard deviation of norms on standardized neuropsycho- logical tests, 4) preserved activities of daily living (ADL), 5) presence or a history of focal neurological signs, 6) at least one lacunar infarct and severe WMHs on T2-weighted or FLAIR images as described below. The severe WMHs ob- served on T2-weighted or FLAIR images of SVaD and svMCI were defined as periventricular WMHs with a cap or rim lar- ger than a 10 mm maximum diameter and severe deep sub- cortical WMHs that were consistent with extensive or diffuse- ly confluent WMHs>25 mm maximum diameter.
Patients with the following diseases or conditions were ex- cluded: severe systemic diseases, vitamin B12 or folate defi- ciency, uncontrolled thyroid disease, cardioembolic source, large cerebral artery stenosis>50%, cortical and/or subcorti- cal nonlacunar territorial infarct, watershed infarcts, WMHs of specific causes (e.g. multiple sclerosis, sarcoidosis, brain ir- radiation), Alzheimer’s disease, Parkinson’s disease, normal pressure hydrocephalus, alcoholism or drug abuse, any other medical diseases that can bring about dementia, major de- pression, psychiatric diseases, or difficulty understanding conversations because of hearing even with a hearing aid. In addition, those with severe claustrophobia or contraindica- tions to MRI examination (e.g. pacemakers, metallic implants) were also excluded.
All participants were invited to return after 20 months (mean
±SD=19.7±7.3 months) to re-evaluate brain MRI, cogni- tion, and disability. Of the 36 patients, 17 were re-evaluated.
Nine patients did not want to be involved further. Two died.
Three could not reattend because of physical illness such as a
fracture. Five were unable to be contacted.
All subjects were examined by the same neurologist at base- line and follow-up. Cerebrovascular risk factors including hy- pertension, diabetes mellitus (DM), and hypercholesterolemia were assessed. Hypertension was defined as systolic blood pressure ≥140 mmHg or diastolic blood pressure ≥90 mmHg or use of antihypertensive medication based on the WHO guidelines for the management of hypertension [18]. DM was defined based on current treatment with insulin or oral hypoglycemic medication or 8 hr fasting plasma glucose
≥126 mg/dL as recommended by the American Diabetes Association [19]. Hypercholesterolemia was defined based on current treatment with statin or total cholesterol ≥200 mg/dL, low-density lipoprotein (LDL) ≥130 mg/dL, and high-density lipoprotein (HDL) <35 mg/dL by the National Cholesterol Education Program-Adult Treatment Panel II [20]. Hypertriglyceridemia was based on serum triglyceride
≥200 mg/dL or current treatment [20].
Clinical assessment
All participants were subjected to Korean Mini-Mental State Examination (K-MMSE) [21] and Seoul Neuropsychological Screening Battery-Dementia version (SNSB-D) at both time points [22]. The SNSB-D consists of the Seoul Verbal Learn- ing Test of a 12-word list consisting of four household items, four flowers, and four stationery words, the Short Form of the Korean-Boston Naming Test, the Rey Osterrieth Complex figure, the Forward and Backward Digit Span tests, animal fluency, phonemic verbal fluency, and a Color-Word Stroop Test (CWST). The Sum of Boxes of Clinical Dementia Rating Scale (CDR-SB) [23] and a Korean version of the Geriatric Depression Scale (GDS-K) [24] were also used to assess all participants at both time points. The Barthel Index was re- corded as a measure of disability at both time points [25]. The study protocol and informed consent form were reviewed and approved by the institutional review board at Inha Uni- versity Hospital. Prior to participation in the study, the pa- tients gave their written informed consent to participation in the study.
MRI acquisition
Imaging was performed using a 1.5-T GE Signa MRI scan- ner (signal HDX, General Electric, Milwaukee, Wisonsin) with the following imaging parameters: 1) spoiled gradient recalled echo T1-weighted: repetition time=13.4 ms, echo time=6.1 ms, field of view=240×240 mm2, slice thickness
=1.5 mm, no gap, slices=136, acquisition matrix=320×192;
2) axial T2-weighted fast field echo sequences: repetition time
=4,400 ms, echo time=111 ms, field of view=220×220 mm2, slice thickness=5 mm, gap =2.5 mm, slices=20, acquisition matrix=320×256; 3) fluid-attenuated inversion recovery (FLAIR) imaging: repetition time=8,002 ms, echo time=94 ms, inversion time=2,200 ms, field of view=220×220 mm2, slice thickness=5 mm, gap =2.5 mm, slices=20, matrix=
320×192; and 4) DTI: single-shot echoplanar imaging in 15 diffusion-sensitized directions each with a b factor of 1,000 s/
mm2, repetition time=1,000 ms, echo time=107.8 ms, field of view=240×240 mm2, slice thickness=4 mm, no gap, slic- es=35, acquisition matrix=128×128. There were no scan- ner upgrades or changes to software or hardware during the study period.
Image analysis and postprocessing
T1-weighed image pre-processing
The native T1-weighted MRIs were normalized into a stan- dardized stereotaxic space using a linear transformation and corrected for intensity nonuniformity [26]. We calculated brain volume using the brain extraction tool [27]. The regis- tered and corrected volumes were classified into white mat- ter, gray matter, cerebrospinal fluid, and background using an advanced neural-net classifier [28]. The classified white mat- ter regions were used in the WMH mask extraction step.
WMH mask extraction
A mask of regional WMHs was created using a pre-devel- oped automated pipeline [29]. We first extracted WMHs can- didate regions using the tissue classified volumes in order to avoid false positive findings in WMHs segmentation associ- ated with the nuisance factor such as hypersignals in the sub- arachnoid space and brain-CSF interface on FLAIR images.
Then, we segmented WMHs on the FLAIR images using the FMRIB Automatic Segmentation Tool (FAST) of the FMRIB Software Library (http://www.fmrib.ox.ac.uk/fsl/) after apply- ing the WMHs candidate mask. The FAST segmentation tool is based on a hidden Markov random field model and an as- sociated expectation-maximization algorithm. It produces more robust and reliable data compared with most finite mix- ture model based methods, which are sensitive to noise [30].
DTI pre-processing and histogram analysis
DTI data was processed using the FMRIB Software Library (http://www.fmrib.ox.ac.uk/fsl). Motion artifacts and eddy current distortions were corrected by normalizing each diffu- sion weighted volume to the non-diffusion weighted volume (b0) using the affine registration method in the FMRIB’s Lin- ear Image Registration Tool (FLIRT). Diffusion tensor matri- ces from the sets of diffusion-weighted images were generat- ed using a general linear fitting algorithm. Subsequently, the MD and FA were calculated for every voxel according to stan- dard methods.
In order to analyze the histogram of FA and MD in the DTI space, the generated WMH mask was transferred to the DTI space using the transformation matrix calculated from the registration between the T1-weighted MRI and the non- diffusion weighted volume (b0). Subsequently, the histograms of MD and FA were calculated in the regions of WMH and NABT, respectively. Each bin of the histograms was normal- ized by the total number of brain voxels to correct inter-indi- vidual variations of brain size. From the normalized histo- grams, we calculated mean, peak height and peak location values for all subjects.
Assessment of conventional MRI ischemic lesions
MRIcro (http://www.mricro.com) was used to view the imaging results. The volumes of the WMH on the FLAIR images were measured using the Medical Image Processing, Analysis, and Visualization (MIPAV) (http://mipav.cit.nih.
gov/). Lesion volumes were measured on FLAIR. A cursor was placed within each visible lesion and the software then automatically outlined the lesion using fixed intensity thresh- olds that were the same for all subjects. All regions were check-
ed visually to ensure that they matched the visible extent of lesions. Total lesion volumes were calculated by summing all the areas measured and multiplying by the slice thickness.
The total volume of the WMH on the FLAIR images was measured twice in each patient, and the average value was used in the analysis. Percentage lesion volume was determin- ed as a ratio of lesion volume to total brain volume.
One neurologist blinded to clinical information counted the total numbers of lacunar infarctions. Lacunar infarction was defined as a small lesion less than 15 mm in diameter with a low signal on T1-weighted images, a high signal on T2-wei- ghted images, and a perilesional halo on FLAIR images [31].
Visual rating of medial temporal lobe atrophy
Medial temporal lobe atrophy (MTA) was assessed visually by a neurologist who was blinded to the diagnosis and age of the subjects after a series of training sessions [32]. The T1 coronal images were used for the visual assessment and left and right MTA were rated separately. The degree of MTA was rated from 0 (no atrophy) to 4 (severe atrophy). The av- erage value of left and right MTA in each patient was calcu- lated and used in the analysis.
Statistical analysis
To calculate the composite neuropsychology score and the composite executive function score, we used a z-score for the neuropsychological measures. These scores were based on the means and standard deviations of each measurement in the age- and education-matched control group. A z-score de- fines where a score falls in the distribution of scores for nor- mal subjects; a z-score of + 2.0 corresponds to a score that is 2 standard deviation (SD) above the mean score. The com- posite neuropsychology score was estimated by averaging the z-scores of all the neuropsychological subtests and represent- ed global cognition. The composite executive function score was estimated by averaging the z-scores of Backward Digit Span, animal fluency, phonemic fluency, and correct color reading of CWST.
The Mann-Whitney U tests were used to define the differ- ences of age, education, K-MMSE score, percent lesion vol-
ume, the number of lacunes, MTA, and DTI parameters be- tween SVaD and svMCI groups. The differences of sex and the prevalence of hypertension, DM, hypercholesterolemia, and hypertriglyceridemia between the two groups were ana- lyzed by a Chi-Square test or a Fisher’s Exact test. The corre- lations of clinical parameters with MRI parameter were eval- uated by a Pearson correlation coefficient. The mean clinical scores and MRI characteristics obtained at baseline and at follow-up were compared with a Wilconxon Signed Rank test, in respective order. A Pearson correlation was used to determine the relationship between the change of scores from MRI parameters and the composite neuropsychology score, the composite executive function score, the CDR-SB, the Bar- thel Index, and the GDS-K.
RESULTS
Demographic and clinical characteristics
The demographic and clinical characteristics of the sub- jects are listed in Table 1. The mean age of the subjects with SVaD was significantly higher than that of the subjects with svMCI (76.9±6.3 years vs. 72.0±6.1 years, p=0.03). The mean K-MMSE score was significantly lower in the subjects with SVaD compared with those with svMCI (14.2±5.8 vs.
22.2±5.1, p<0.001). There were no significant differences in education, sex, and the prevalence of hypertension, DM, hy- percholesterolemia, and hypertriglyceridemia between SVaD
and svMCI groups.
Comparison of MRI indices between SVaD and svMCI
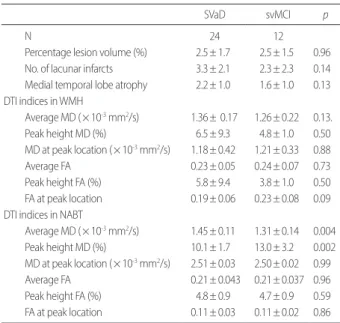
The percentage lesion volume, the number of lacunes, MTA score, and DTI parameters of the SVaD and svMCI groups are listed in Table 2. The average MD in the NABT was sig- nificantly higher in the SVaD group compared with the svM- CI group. The peak height of MD histogram in the NABT was significantly lower in the SVaD group than that of the svMCI group. There were no significant differences in the parameters of the FA histogram within NABT between the two groups. In contrast, there were also no significant differ- ences in percentage lesion volume, the number of lacunes, MTA score, and DTI parameters in the WMH between the two groups.
Cross-sectional results
Correlations of each MRI parameter with cognitive mea- sures, CDR-SB, GDS-K, and the Barthel Index are shown in Table 3. The composite executive function score significantly correlated with average MD (r =-0.67, p<0.001) and peak
Table 1. Demographic and clinical characteristics of the subjects Whole
population SVaD SvMCI p*
N 36 24 12
Age (year) 75.3± 6.6 76.9± 6.3 72.0± 6.1 0.04
Male, n (%) 19 (52.8%) 13 (54.2%) 6 (50.0%) 0.81
Education (year) 5.6± 5.3 4.9± 5.3 6.2± 5.5 0.42
K-MMSE 17.3± 6.6 14.2± 5.8 22.2± 5.1 < 0.001
Hypertension, n (%) 27 (75.0%) 16 (66.7%) 11 (91.7%) 0.22 Diabetes Mellitus, n (%) 12 (33.4%) 7 (29.2%) 6 (50.0%) 0.28 Hyercholesterolemia, n (%) 24 (66.7%) 14 (58.3%) 10 (83.3%) 0.26 Hyertriglyceridemia, n (%) 8 (22.2%) 5 (20.8%) 3 (25.0%) 0.55 Values are presented as mean± standard deviation or number (%).
*SVaD vs. svMCI.
SVaD, sub cortical vascular dementia; svMCI, subcortical vascular mild cognitive im- pairment; K-MMSE, Korean Mini-Mental State Examination.
Table 2. Comparison of MRI indices in the SVaD and svMCI groups
SVaD svMCI p
N 24 12
Percentage lesion volume (%) 2.5± 1.7 2.5± 1.5 0.96 No. of lacunar infarcts 3.3± 2.1 2.3± 2.3 0.14 Medial temporal lobe atrophy 2.2± 1.0 1.6± 1.0 0.13 DTI indices in WMH
Average MD (× 10-3 mm2/s) 1.36± 0.17 1.26± 0.22 0.13.
Peak height MD (%) 6.5± 9.3 4.8± 1.0 0.50
MD at peak location (× 10-3 mm2/s) 1.18± 0.42 1.21± 0.33 0.88
Average FA 0.23± 0.05 0.24± 0.07 0.73
Peak height FA (%) 5.8± 9.4 3.8± 1.0 0.50
FA at peak location 0.19± 0.06 0.23± 0.08 0.09 DTI indices in NABT
Average MD (× 10-3 mm2/s) 1.45± 0.11 1.31± 0.14 0.004
Peak height MD (%) 10.1± 1.7 13.0± 3.2 0.002
MD at peak location (× 10-3 mm2/s) 2.51± 0.03 2.50± 0.02 0.99
Average FA 0.21± 0.043 0.21± 0.037 0.96
Peak height FA (%) 4.8± 0.9 4.7± 0.9 0.59
FA at peak location 0.11± 0.03 0.11± 0.02 0.86 Values are presented as mean± standard deviation.
SVaD, subcortical vascular dementia; svMCI, subcortical vascular mild cognitive im- pairment; WMH, white matter hyperintensity; NABT, normal-appearing brain tissue;
MD, mean diffusivity; FA, fraction anisotrophy.
height of MD histogram (r =0.67, p<0.001) in the NABT.
The Global Cognition Score correlated with average MD (r = -0.37, p=0.03) in WMH, and average MD (r =-0.80, p<0.001) and peak height of MD histogram (r =0.68, p<0.001) in the NABT. The CDR-SB score significantly correlated with aver- age MD (r =0.54, p=0.001) in the NABT, and peak height (r =-0.52, p=0.001) and MD (r =0.45, p=0.006) at peak hei- ght of the MD histogram in the NABT. The Barthel Index cor- related with peak height of MD histogram (r =0.37, p=0.03) in the NABT. The GDS-K correlated with percentage lesion volume (r =0.43, p=0.01).
Longitudinal results
There were no differences in baseline demographic charac- teristics between those who attended at both time points and those who dropped out. Fifteen (62.5%) patients with SVaD and four (33.3%) of svMCI dropped out (p=0.10).
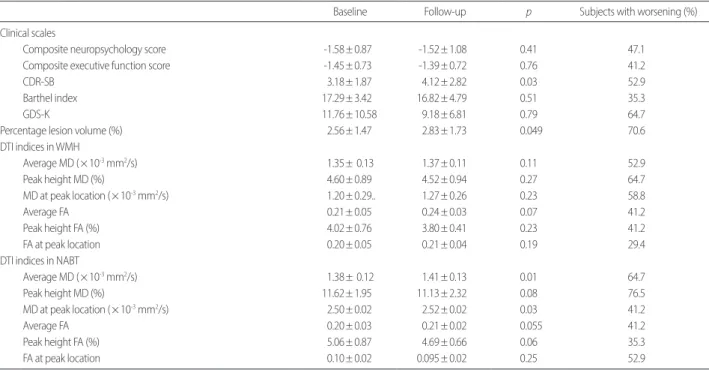
The mean clinical scores and MRI characteristics obtained at baseline and at follow-up are shown in Table 4. At follow- up, CDR-SB had deteriorated when compared with baseline.
No significant changes of any clinical characteristics were found. The percentage lesion volume had significantly in- creased. Also, average values and peak locations of MD histo-
grams in NABT had significantly increased (Fig. 1). In con- trast, no significant changes of any MRI characteristics were found.
To assess how consistently imaging and clinical measures deteriorated over time, we calculated the proportion of sub- jects in whom the measures in Table 4 worsened. Worsening was defined as a deterioration of clinical scales, an increase in percentage lesion volumes, an increase in average MD, peak locations of MD histograms and peak heights of FA histo- grams, and a decrease in peak heights of MD histograms, av- erage FA, and peak locations of FA histograms. As shown in Table 4, the proportion of those who had worsened was gen- erally higher in CDR-SB, GDS-K, percentage lesion volume, and parameters of MD histograms.
Correlations of changes of each MRI parameter with chang- es of cognitive measures, CDR-SB, GDS-K, and Barthel Index are shown in Table 5. The change of CDR-SB score signifi- cantly correlated with a change of average MD (r =0.57, p=
0.02) in the WMH, and showed a tendency to correlate with MD values (r =0.44, p=0.08) at peak heights of MD histo- grams in the WMH. The change of Barthel Index scores show- ed a tendency to correlate with the change of percentage le- sion volume (r =-0.42, p=0.09) and the change of average MD (r =-0.45, p=0.07) in the WMH. The change of GDS-K Table 3. Pearson correlation coefficients between different clinical measures and MRI parameters
Composite
neuropsychology score Composite
executive function score CDR-SB Barthel index GDS-K
Percentage lesion volume (%) 0.16 0.18 -0.01 0.04 0.43†
No. of lacunar infarcts -0.29 -0.23 0.02 0.04 -0.05
DTI indices in WMH
Average MD (× 10-3 mm2/s) -0.37* -0.32 0.27 -0.28 -0.06
Peak height MD (%) 0.05 0.15 0.11 0.12 0.28
MD at peak location (× 10-3 mm2/s) -0.14 -0.22 0.009 0.18 -0.21
Average FA 0.17 0.17 0.003 -0.06 0.04
Peak height FA (%) -0.002 -0.22 0.12 -0.25 0.28
FA at peak location 0.24 0.34 -0.13 0.04 -0.13
DTI indices in NABT
Average MD (× 10-3 mm2/s) -0.80* -0.67* 0.54* -0.31 -0.31
Peak height MD (%) 0.68* 0.67* -0.52* 0.37† 0.09
MD at peak location (× 10-3 mm2/s) -0.13 -0.27 0.45* -0.24 -0.04
Average FA 0.15 0.14 0.02 -0.18 0.22
Peak height FA (%) -0.28 -0.28 0.12 0.04 -0.21
FA at peak location 0.09 0.14 0.03 -0.10 0.18
*p<0.01, †p< 0.05.
Values are presented as r. WMH, white matter hyperintensity; NABT, normal-appearing brain tissue; MD, mean diffusivity; FA, fraction anisotrophy; CDR-SB, Sum of Boxes of Clinical Dementia Rating Scale; GDS-K, Korean version of the Geriatric Depression Scale.
correlated with the change of percentage lesion volume (r = 0.51, p=0.04) and the change of peak height of FA histogram (r =-0.56, p=0.02) in the WMH. In contrast, no significant correlations of change of DTI parameters in NABT with change of clinical measures were found.
DISCUSSION
The current prospective study establishes significant corre- lations between DTI histogram metrics and clinical measures on a longitudinal scale in sporadic SVD. There were no sig- nificant differences in WML volume and parameters of MD or FA histograms within WMH, but only significant differ- ences in parameters of MD histograms within NABT between SVaD and svMCI patients. In the cross-sectional analysis, MD histograms metrics within NABT significantly correlated with clinical measures in the patients with VCI associated with SVD. WML volume and parameters of MD or FA histo- grams in WMH were not correlated with clinical measures in them. In contrast, the change of clinical measures was not as- sociated with change of DTI parameters within NABT, but was associated with a change of the volume of WMH and DTI parameters within WMH on a longitudinal scale.
FA is a measure of the directionality of diffusion and a marker of white matter tract damage and MD is a measure of the extent of diffusion and is sensitive to white matter ultra- structural damage [11]. MD histogram broadening and the Table 4. Clinical Measures and Magnetic Resonance Measures at Baseline and at Follow-up
Baseline Follow-up p Subjects with worsening (%)
Clinical scales
Composite neuropsychology score -1.58± 0.87 -1.52± 1.08 0.41 47.1
Composite executive function score -1.45± 0.73 -1.39± 0.72 0.76 41.2
CDR-SB 3.18± 1.87 4.12± 2.82 0.03 52.9
Barthel index 17.29± 3.42 16.82± 4.79 0.51 35.3
GDS-K 11.76± 10.58 9.18± 6.81 0.79 64.7
Percentage lesion volume (%) 2.56± 1.47 2.83± 1.73 0.049 70.6
DTI indices in WMH
Average MD (× 10-3 mm2/s) 1.35± 0.13 1.37± 0.11 0.11 52.9
Peak height MD (%) 4.60± 0.89 4.52± 0.94 0.27 64.7
MD at peak location (× 10-3 mm2/s) 1.20± 0.29.. 1.27± 0.26 0.23 58.8
Average FA 0.21± 0.05 0.24± 0.03 0.07 41.2
Peak height FA (%) 4.02± 0.76 3.80± 0.41 0.23 41.2
FA at peak location 0.20± 0.05 0.21± 0.04 0.19 29.4
DTI indices in NABT
Average MD (× 10-3 mm2/s) 1.38± 0.12 1.41± 0.13 0.01 64.7
Peak height MD (%) 11.62± 1.95 11.13± 2.32 0.08 76.5
MD at peak location (× 10-3 mm2/s) 2.50± 0.02 2.52± 0.02 0.03 41.2
Average FA 0.20± 0.03 0.21± 0.02 0.055 41.2
Peak height FA (%) 5.06± 0.87 4.69± 0.66 0.06 35.3
FA at peak location 0.10± 0.02 0.095± 0.02 0.25 52.9
Values are presented as mean± standard deviation.
WMH, white matter hyperintensity; NABT, normal-appearing brain tissue; MD, mean diffusivity; FA, fraction anisotrophy; CDR-SB, Sum of Boxes of Clinical Dementia Rating scale;
GDS-K, Korean version of the Geriatric Depression Scale.
Fig. 1. Mean diffusivity histograms in normal-appearing brain tissue (n= 17) at baseline and at follow-up.
0.14
0.12 0.1
0.08 0.06
0.04
0.02 0
Normalized pixel count
0 0.5 1 1.5 2 2.5 3 3.5 4 Mean diffusivity (× 10-3 mm2/s)
Baseline Follow-up
consequent decrease of the peak height and increase of MD at peak height suggests fewer pixels with normal MD values and a global increase of molecular diffusion in white matter [33]. In brain pathologic abnormality to reduce white matter tract organization, a shift of fractional anisotropy histogram toward lower values would result in an increase of the histo- gram peak height and decrease of average fractional anisot- ropy and peak position [33, 34].
There were no significant differences in the number of la- cunes, WMH volume, and parameters of MD and FA histo- grams in WMH, but significant differences in average MD and peak height of MD histogram within NABT between SVaD and svMCI patients. MD histogram broadening and the consequent decrease of the peak height is the result of fewer pixels with normal MD values [33]. Therefore, this finding suggests that the number of pixels with normal MD values in NABT is lower in the SVaD group compared with the svMCI group. It suggests also that damage to white mat- ter projections is an important mechanism of cognitive im- pairment in cerebral SVD, and is consistent with the ‘‘discon- nection’’ hypothesis of cognitive impairment [10]. The differ- ence of DTI parameters in NABT between SVaD and svMCI groups might be the result of coexistence of Alzheimer pa- thology in SVaD. In a previous study, about 30% of SVaD pa- tients had Alzheimer pathology [35]. The value of MTA was
not different between the two groups in this study. Therefore, the difference of DTI parameters in NABT between the two groups might be mainly associated with the disconnection of white matter tract due to cerebral SVD. In a recent study, SVaD and svMCI did not differ significantly with respect to param- eters of MD and FA histograms in whole brain white matter as well as normal appearing white matter [15]. However, the number of SVaD patients was very small in their study.
Parameters of MD histograms within NABT significantly correlated with the composite neuropsychology score, com- posite executive function score, Barthel Index, and CDR-SB in the cross-sectional analysis of this study. Percentage lesion volume only correlated with the depression scale. Average MD in WMH only correlated with the composite neuropsy- chology score. These results were compatible with the previ- ous studies which reported that ultrastructural abnormalities of NABT have a stronger effect on cognitive function than WMH lesion volume and DTI indices of WMH [10, 13, 14].
SVD causes cognitive impairment by disrupting cortical-cor- tical and cortical-subcortical pathways [14].
In the cross-sectional analysis, we have found that clinical measures did not correlate with parameters of the FA histo- gram, but correlated with parameters of the MD histogram.
This may reflect that diffusivity is relatively constant in white matter, whereas FA values vary widely, depending upon whe- Table 5. Pearson Correlation Coefficients between changes of clinical measures and changes of MRI parameters
∆ Composite
neuropsychology score ∆ Composite executive
function score ∆ CDR-SB ∆ Barthel index ∆ GDS-K
∆ Percentage lesion volume -0.19 0.13 0.19 -0.42† 0.51*
Change of DTI indices in WMH
∆ Average MD -0.16 -0.04 0.57* -0.45† -0.26
∆ Peak height MD -0.05 -0.12 -0.18 0.12 -0.23
∆ MD at peak location -0.01 -0.24 0.44† -0.40 0.10
∆ Average FA -0.02 0.05 0.25 -0.27 0.36
∆ Peak height FA -0.05 -0.12 0.09 0.12 -0.56*
∆FA at peak location 0.15 0.06 -0.32 0.23 0.34
Change of DTI indices in NABT
∆ Average MD -0.18 0.34 0.13 -0.29 0.25
∆ Peak height MD 0.28 0.22 -0.31 0.24 -0.18
∆ MD at peak location 0.15 -0.12 0.11 -0.15 -0.13
∆ Average FA -0.03 0.14 0.23 -0.17 0.36
∆ Peak height FA 0.08 -0.14 -0.29 0.14 -0.24
∆ FA at peak location 0.09 0.12 -0.09 0.12 0.29
*p<0.05, †p< 0.10.
WMH, white matter hyperintensity; NABT, normal-appearing brain tissue; MD, mean diffusivity; FA, fraction anisotrophy; CDR-SB, Sum of Boxes of Clinical Dementia Rating scale;
GDS-K, Korean version of the Geriatric Depression Scale.
ther the voxel is placed over the center of a white matter tract.
Therefore small variations in the placement would lead to larger variations in FA than MD [10].
Over a 20-month follow-up, no significant changes were also found in cognition, disability, and depression. The CDR- SB score only increased over the 20-month follow-up. CDR- SB may be most sensitive clinical tool to detect a clinical de- cline in SVaD and svMCI. Percentage lesion volume, and av- erage MD and MD at peak location of MD histogram in NA- BT significantly increased over a 20-month follow-up. The proportion of those who had worsened was generally higher in percentage lesion volume and parameters of MD histo- grams rather than cognitive and disability measures. This finding suggests that a change of imaging parameters may start earlier than progression of cognitive impairment or dis- ability, and be more sensitive to detect some progression of cerebral SVD in comparison to a cognitive test or disability scale [11].
In this study, the change of percentage lesion volume cor- related with the change of GDS-K. However, there was no correlation between changes of T2-lesion volumes and clini- cal scales in a longitudinal study of the patients with CADA- SIL [12]. In their study, they did not measure brain atrophy [12]. Brain atrophy might counteract lesion growth.
The parameters of MD histogram in NABT correlated with clinical scales in the cross-sectional analysis. However, in the longitudinal analysis, the change of MD and FA histogram metrics in WMH significantly correlated with the change of clinical measures. Clinical progression might be associated with progression of incomplete infarction to complete infarc- tion in WMH. A two-year follow-up study of CADASIL pa- tients established correlations between changes of DTI histo- gram metrics and clinical measures over times [12]. In their study, they used MD histograms of the whole brain in the analysis and did not separate WMH and NABT to get MD histograms.
Our study has a possible limitation of a small sample size, which might result in too small power to show a significant difference. Although cognitive impairment is found in many patients with cerebral SVD, the rate of cognitive decline and progression of frank dementia is slow [35]. Therefore, the fol- low-up time of 20 months might be too short to detect struc-
tural and clinical progression of cerebral SVD in this study.
Also many patients did not attend the follow-up evaluation.
The drop-out rate in the patients with SVaD (62.5%) was high- er in comparison to svMCI group (33.3%). Therefore, a selec- tion bias may have affected this study. Because of the drop- out of the patients with severe cerebral SVD, changes of clini- cal and imaging parameters might be minimal. There was also a limitation that evaluation of Alzheimer’s disease bio- markers was not done in this study.
In conclusion, DTI parameters in NABT were correlated with cognitive impairment and disability in cerebral SVD.
Clinical progression of SVD was associated with some incre- ment of WML volume and ultrastrucural changes in WMH.
To our knowledge, this is the first study to formally address significant correlations between longitudinal changes of quan- titative MRI metrics and changes of clinical scales in patients with sporadic SVD. In the future, a study with a larger sample size and a longer follow-up period is needed.
REFERENCES
1. Staekenborg SS, van Straaten EC, van der Flier WM, Lane R, Barkhof F, Scheltens P. Small vessel versus large vessel vascular dementia: risk fac- tors and MRI findings. J Neurol 2008; 255: 1644-51.
2. Yanagihara T. Vascular dementia in Japan. Ann NY Acad Sci 2002; 977:
24-8.
3. Erkinjuntti T, Inzitari D, Pantoni L, Wallin A, Scheltens P, Rockwood K, et al. Research criteria for subcortical vascular dementia in clinical trials.
J Neural Transm Suppl 2000; 59: 23-30.
4. Frisoni GB, Galluzzi S, Bresciani L, Zanetti O, Geroldi C. Mild cognitive impairment with subcortical features: clinical characteristics and outcome.
J Neurol 2002; 249: 1423-32.
5. Seo SW, Ahn J, Yoon U, Im K, Lee JM, Tae Kim S, et al. Cortical thin- ning in vascular mild cognitive impairment and vascular dementia of subcortical type. J Neuroimaging 2010; 20: 37-45.
6. LADIS Study Group. 2001-2011: a decade of the LADIS (Leukoaraiosis And Disability) Study: what have we learned about white matter chang- es and small-vessel disease? Cerebrovasc Dis 2011; 32: 577-88.
7. Pantoni L. Cerebral small vessel disease: from pathogenesis and clinical characteristics to therapeutic challenges. Lancet Neurol 2010; 9: 689-701.
8. Junqué C, Pujol J, Vendrell P, Bruna O, Jódar M, Ribas JC, et al. Leuko-
araiosis on magnetic resonance imaging and speed of mental processing.
Arch Neurol 1990; 47: 151-6.
9. Sabri O, Ringelstein EB, Hellwig D, Schneider R, Schreckenberger M, Kaiser HJ, et al. Neuropsychological impairment correlates with hypo- perfusion and hypometabolism but not with severity of white matter le- sions on MRI in patients with cerebral microangiopathy. Stroke 1999; 30:
556-66.
10. O’Sullivan M, Morris RG, Huckstep B, Jones DK, Williams SC, Markus HS. Diffusion tensor MRI correlates with executive dysfunction in pa- tients with ischaemic leukoaraiosis. J Neurol Neurosurg Psychiatry 2004;
75: 441-7.
11. Nitkunan A, Barrick TR, Charlton RA, Clark CA, Markus HS. Multi- modal MRI in cerebral small vessel disease: its relationship with cogni- tion and sensitivity to change over time. Stroke 2008; 39: 1999-2005.
12. Holtmannspötter M, Peters N, Opherk C, Martin D, Herzog J, Brück- mann H, et al. Diffusion magnetic resonance histograms as a surrogate marker and predictor of disease progression in CADASIL: a two-year fol- low-up study. Stroke 2005; 36: 2559-65.
13. Schmidt R, Ropele S, Ferro J, Madureira S, Verdelho A, Petrovic K, et al.
Diffusion-weighted imaging and cognition in the leukoariosis and dis- ability in the elderly study. Stroke 2010; 41: e402-8.
14. Jokinen H, Schmidt R, Ropele S, Fazekas F, Gouw AA, Barkhof F, et al.
Diffusion changes predict cognitive and functional outcome: The LADIS study. Ann Neurol 2013; 73: 576-83.
15. Xu Q, Zhou Y, Li YS, Cao WW, Lin Y, Pan YM, et al. Diffusion tensor imaging changes correlate with cognition better than conventional MRI findings in patients with subcortical ischemic vascular disease. Dement Geriatr Cogn Disord 2010; 30: 317-26.
16. American Psychiatric Association. Diagnostic and statistical manual disorders, 4th ed (DSM-IV). Washington, DC.: American Psychiatric As- sociation, 1994; 146.
17. Winblad B, Palmer K, Kivipelto M, Jelic V, Fratiglioni L, Wahlund LO, et al. Mild cognitive impairment-beyond controversies, towards a con- sensus: report of the International Working Group on Mild Cognitive Im- pairment. J Intern Med 2004; 256: 240-6.
18. The Guidelines Subcommittee of the World Health Organization - In- ternational Society of Hypertension (WHOISH). 1999 World Health Organization-International Society of Hypertension guidelines for the management of hypertension. J Hypertens 1999; 17: 151-83.
19. The Expert Committee on the Diagnosis and Classification of Diabetes Mellitus. Report of the expert committee on the diagnosis and classifica- tion of diabetes mellitus. Diabetes Care 1997; 20: 1183-97.
20. National cholesterol education program. Second report of the expert panel on detection, evaluation, and treatment of high blood cholesterol in adults (adult treatment panel II). Circulation 1994; 89: 1333-445.
21. Kang, Y. Normative data on the Korean Mini-Mental State Examination (K-MMSE) in Korean elderly. Korean J Psychology 2006; 25: 1-12.
22. Ahn HJ, Chin J, Park A, Lee BH, Suh MK, Seo SW, et al. Seoul Neuro- psychological Screening Battery-dementia version (SNSB-D): a useful tool for assessing and monitoring cognitive impairments in dementia pa- tients. J Korean Med Sci 2010; 25: 1071-6.
23. Morris JC. The Clinical Dementia Rating (CDR): current version and scoring rules. Neurology 1993; 43: 2412-4.
24. Bae JN, Cho MJ. Development of the Korean version of the Geriatric De- pression Scale and its short form among elderly psychiatric patients. J Psy- chosom Res 2004; 57: 297-305.
25. Mahoney FI, Barthel D. “Functional evaluation: the Barthel Index.” Mary- land State Medical Journal 1965; 14: 56-61.
26. Sled JG, Zijdenbos AP, Evans AC. A nonparametric method for auto- matic correction of intensity nonuniformity in MRI data. IEEE Trans Med Imaging 1998; 17: 87-97.
27. Smith, S. M. “Fast robust automated brain extraction. Hum Brain Mapp 2002; 17: 143-55.
28. Zijdenbos AP, Evans AC, Riahi F, Sled JG, Chui J, Kollakian M. Auto- matic quantification of multiple sclerosis lesion volume using stereotaxic space. In: Proc, 4th Intl Conf on Visualization in BioMed Computing VBC, Lecture Notes in Computer Science 1996; 1131: 439-48.
29. Jeon SU, Yoon UC, Park JS, Seo SW, Kim J, Kim ST, et al. Fully Automat- ed Pipeline for Quantification and Localization of White Matter Hyper- intensity in Brain Magnetic Resonance Image. Int J Imaging Syst Technol 2011; 21: 193-200.
30. Zhang Y, Brady M, Smith S. Segmentation of brain mr images through a hidden markov random field model and the expectation-maximization algorithm, IEEE Trans Med Imaging 2001; 20: 45-57.
31. Lee JH, Kim SH, Kim GH, Seo SW, Park HK, Oh SJ, et al. Identification of pure subcortical vascular dementia using 11C-Pittsburgh compound B.
Neurology 2011; 77: 18-25.
32. Scheltens P, Leys D, Barkhof F, et al. Atrophy of medial temporal lobes on MRI in “probable” Alzheimer’s disease and normal ageing: diagnostic value and neuropsychological Correlates. J Neurol Neurosurg Psychiatry 1992; 55: 967-72.
33. Cercignani M, Inglese M, Pagani E, Comi G, Filippi M. Mean diffusivity and fractional anisotropy histograms of patients with multiple sclerosis.
AJNR Am J Neuroradiol 2001; 22: 952-8.
34. Zhou Y, Qun-Xu, Qin LD, Qian LJ, Cao WW, Xu JR. A primary study of diffusion tensor imaging-based histogram analysis in vascular cognitive impairment with no dementia. Clin Neurol Neurosurg 2011; 113: 92-7.
35. Aharon-Peretz J, Daskovski E, Mashiach T, Tomer R. Natural history of dementia associated with lacunar infarctions. J Neurol Sci 2002; 203-204:
53-5.