Agreement Between Actual and Perceived Body Weight in Adolescents and Their Weight Control Behaviors
Sun Mi Shin*
Department of Nursing, Joongbu University, Geumsan, Korea
Background: To investigate the agreements between actual and perceived body weight status among ado- lescents and to identify the associations of disagreements with their weight control behaviors.
Methods: This study used the secondary data of a sample survey (n=13,871) of the Seoul Student Health Ex- amination among middle and high schools in 2010. Agreements between actual (underweight, normal, over- weight, and obese, according to 2007 Korean National Growth Charts) and perceived body weight status (un- derweight, normal, overweight, and obese) were examined using Chi-square and Cohen’s kappa agreement, and then multinomial logistic regression including gender, grade, and attempt of weight control or method of weight control was done.
Results: Agreements between actual and perceived body weight status were only 45.2%, and disagreements were up to 54.8%, including mild over- (20.4%), severe over- (1.8%), mild under- (29.5%), and severe under-esti- mation (3.1%). The kappa coefficient of agreement was only 0.19. The odds ratios on severe over-estimated per- ception were 1.59 (95% CI, 1.22-2.07) in female subjects, 1.78 (95% CI, 1.36-2.34) in diet control behaviors, and 1.53 (95% CI, 1.18-2.00) in exercise. The odds ratios on severe under-estimated perception were only 0.40 (95%
CI, 0.32–0.50) in female subjects but 5.77 (95% CI, 3.68-9.06) in taking medication.
Conclusion: There were associations of body weight control behaviors with disagreements of actual and per- ceived weight status. Therefore, further study is needed to identify the weight disagreement-related factors and to promote the desired weight control behaviors for adolescents.
Key words: Adolescents, Agreements, Actual body weight, Perceived body weight, Weight control behaviors
Received October 31, 2015 Reviewed December 3, 2015 Accepted February 29, 2016
* Corresponding author Sun Mi Shin
http://orcid.org/0000-0003-4040-6120 Department of Nursing, Joongbu University, 201 Daehak-ro, Chubu-myeon, Geumsan-gun, Chungnam 32713, Korea Tel: +82-41-750-6255 Fax: +82-41-750-6416 E-mail: [email protected]
INTRODUCTION
Obesity is a condition in which fat tissues accumulate excessive- ly
1,2, and it is increasingly common in wealthy modern societies.
The increasing trend of childhood and adolescent obesity in partic- ular is becoming more drastic. As of 2010, for example, obesity doubled in children and quadrupled in adolescents in the US over the past 3 decades. More than a third of American children and ad- olescents were found to be overweight or obese in 2012.
3In Korea also, the Seoul School Health Promotion Center conducted a
School Health Examination survey with a sample of students. The prevalence of child obesity was only about 2% in 1979 but hit 10%
in 1997. The 2009 Korea National Health and Nutrition Examina- tion Survey reported that the prevalence of obesity was 6.4% in children aged 2 to 5 years old, 7.3% in those aged 6 to 11, and 11.3% in those aged 12 to 18; in short, it increased with age.
4Actual weight status and perceived weight can differ. This is be- cause individuals may evaluate their weight based on comparison of oneself with others, or with what society has set as weight stan- dards, rather than based on their actual weight status. Some prece-
Copyright © 2017 Korean Society for the Study of Obesity
This is an Open Access article distributed under the terms of the Creative Commons Attribution Non-Commercial License (http://creativecommons.org/licenses/by-nc/4.0/) which per- mits unrestricted non-commercial use, distribution, and reproduction in any medium, provided the original work is properly cited.
Agreement Between Actual and Perceived Body Weight in Adolescents and Their Weight Control Behaviors
Sun Mi Shin*
Department of Nursing, Joongbu University, Geumsan, Korea
Background: To investigate the agreements between actual and perceived body weight status among ado- lescents and to identify the associations of disagreements with their weight control behaviors.
Methods: This study used the secondary data of a sample survey (n=13,871) of the Seoul Student Health Ex- amination among middle and high schools in 2010. Agreements between actual (underweight, normal, over- weight, and obese, according to 2007 Korean National Growth Charts) and perceived body weight status (un- derweight, normal, overweight, and obese) were examined using Chi-square and Cohen’s kappa agreement, and then multinomial logistic regression including gender, grade, and attempt of weight control or method of weight control was done.
Results: Agreements between actual and perceived body weight status were only 45.2%, and disagreements were up to 54.8%, including mild over- (20.4%), severe over- (1.8%), mild under- (29.5%), and severe under-esti- mation (3.1%). The kappa coefficient of agreement was only 0.19. The odds ratios on severe over-estimated per- ception were 1.59 (95% CI, 1.22-2.07) in female subjects, 1.78 (95% CI, 1.36-2.34) in diet control behaviors, and 1.53 (95% CI, 1.18-2.00) in exercise. The odds ratios on severe under-estimated perception were only 0.40 (95%
CI, 0.32–0.50) in female subjects but 5.77 (95% CI, 3.68-9.06) in taking medication.
Conclusion: There were associations of body weight control behaviors with disagreements of actual and per- ceived weight status. Therefore, further study is needed to identify the weight disagreement-related factors and to promote the desired weight control behaviors for adolescents.
Key words: Adolescents, Agreements, Actual body weight, Perceived body weight, Weight control behaviors
Received October 31, 2015 Reviewed December 3, 2015 Accepted February 29, 2016
* Corresponding author Sun Mi Shin
http://orcid.org/0000-0003-4040-6120 Department of Nursing, Joongbu University, 201 Daehak-ro, Chubu-myeon, Geumsan-gun, Chungnam 32713, Korea Tel: +82-41-750-6255 Fax: +82-41-750-6416 E-mail: [email protected]
dent studies suggested that female students, white Americans, and Asian Americans perceived themselves as severely overweight in comparison to African Americans considering their actual body weight status.
5,6An exact perception of weight based on actual body weight sta- tus is highly important in obesity management and prevention. De- pending on how individuals perceive their body weight, individual behaviors for obesity prevention or management may vary. If one overestimates one’s weight, one will probably show weight control behaviors such as diet and workout regime or medicine intake. In this case, unnecessary control behaviors, or weight control behav- iors that are harmful to health
7–9, may disturb the desired nutrition- al balance of the body or cause waste of time and money.
Contrarily, one might evaluate oneself as having normal weight or underweight while being overweight or obese in reality. This may cause one not to try healthy weight control through exercise or diet or to start it too late
7–9, bringing about serious problems includ- ing complications, cardiovascular diseases, and diabetes caused by obesity. It is possible to predict the involvement of weight control behaviors through an evaluation of weight status perceived by indi- viduals.
10,11Therefore, this study investigated the agreement be- tween actual and perceived body weight status among middle and high school students in the city of Seoul. It aimed to identify “mild overestimation,” “severe overestimation,” “mild underestimation,”
and “severe underestimation” of body weight as well as weight con- trol behaviors.
METHODS Study material and subjects
This is a cross-sectional descriptive study using secondary data to examine the level of agreement between actual and perceived body weight status and weight control behaviors in the adolescent population living in Seoul. The secondary data used in this study were from a sample survey of School Health Examination conduct- ed by Seoul School Health Promotion Center according to the School Health Law and School Health Examinations Rules.
12Study subjects were 7th to 12th grade students at middle and high schools in 2010 selected through random sampling considering the population size (the numbers of schools and classes) and commu-
nity conditions. The number of sample students was 14,470.
Among these, 599 students who did not give a response on per- ceived body weight status were excluded, and the total number of subjects for analysis was 13,871, which was 95.9% of the raw data.
Data collection and ethical consideration
The sample survey data were collected from middle and high schools that had been selected as a sample for the city of Seoul ac- cording to the School Health Examination Sample Survey Guide- lines
12in order to survey the health status of the school-age popula- tion. The survey was conducted for 2 months starting in April of 2010. Height, weight, vision, and hearing were examined. For the survey questionnaire to examine symptoms and health behaviors during the last month, a form suggested by the Ministry of Educa- tion and Science Technology
12was used, and it was collected after respondents self-reported.
I received a request from the Seoul School Health Promotion Center to analyze the raw data and gained approval for publishing contents necessary for the development of school health in the form of study results for journals through further analysis. The re- sults were analyzed per group, and individual identification vari- ables such as name, school, classroom number, or contact number were completely eliminated from analysis variables to ensure pro- tection of personal data.
Measurement variables
The measurement variables used in this study were general char- acteristics including gender and grade and other variables including obesity rate indicating actual body weight status, perceived body weight status, attempt for weight control, and method of weight control (diet, exercise, and medication). Actual body weight was measured by comparing the body mass index (BMI) (kg/m
2) calcu- lated using measured height (cm) and weight (kg) to the 2007 Stan- dard Growth Chart for Children and Adolescents
12by the Korean Pediatric Society. Subjects were classified as “underweight” if the fig- ure was below the 5th percentile, “normal” if between 5th and 85th,
“overweight” if between 85th and 95th, and “obese” if over 95th or if the BMI was 25 or higher, which is the standard for adult obesity.
The perceived body weight was measured based on the answers “I
am very skinny,” “I am a little skinny,” “I am normal,” “I am a little bit
fat,” and “I am very fat” to the question “What do you think of your body weight compared to your friends?” This study matched “I am very skinny” and “I am a little skinny” with “underweight” in the obesity rate, “I am normal” with “normal weight,” “I am a little bit fat”
with “overweight,” and “I am very fat” with “obese” in order to identi- fy the degree of agreement with actual obesity rate. In the questions to verify the weight control experience, if the respondents answered
“yes” to the attempt to lose weight, it was marked as “attempted,” and if they answered “yes” to any of the weight control methods of diet, medication, and exercise, it was considered as having an experience for each item and was established as a new variable.
Analysis method
SAS 9.4 (SAS Inc., Cary, NC, USA) was used for the analysis.
The participant characteristics were examined through a descrip- tive analysis, and the agreement of actual body weight status (obe- sity rate) and perceived body weight status was assessed using the Cohen’s kappa coefficient of agreement. If the 2 variables agreed on a contingency table of actual and perceived body weight status, it was classified as “agreed.” In case of disagreement, it was classified into the following 4 types: When the perceived body weight status was one level higher than actual body weight status, it was reclassi- fied as “mild overestimation”; when 2 levels higher, as “severe over- estimation”; when one level lower, as “mild underestimation”; and when 2 levels lower, as “severe underestimation.” The distribution of each category was verified with a Chi-square test.
The odds ratios of “mild overestimation” and “severe overestima- tion” and “mild underestimation” and “severe underestimation”
were then examined using multinomial logistic regression concern- ing gender, grade, and weight control behaviors. In the entire analy- sis, missing data in each variable were eliminated before suggesting the final values, and it was considered statistically significant when the significance level was less than 0.05.
RESULTS
Demographic and obesity-related characteristics of study subjects
Among the 13,871 subjects, male students accounted for 54.6%
and female students 45.4%. In the obesity rate based on BMI, 4.4%
were underweight, 76.1% were normal weight, 4.7% were over- weight, and 14.7% were obese. In terms of gender, there were more overweight female students and more obese male students (P<
0.001).
In terms of perceived body weight according to gender, male and female students showed a difference accounting for 31.4% and 19.9%, respectively, for being skinny. Male students who perceived themselves as a little bit fat and very fat accounted for 25.7% and 6.1%, respectively, whereas female students accounted for 33.8%
and 8.1% (P<0.001).
Among the surveyed students, 52.7% tried to control their weight. By gender, more female students made an attempt, ac- counting for 62.1%, than male students, accounting for 44.9%
(P<0.001). Students who tried diet for weight control accounted for 30.9%. By gender, the difference showed that 19.0% of male students and 45.0% female students tried the behavior (P<0.001).
Two percent tried medication for weight control, and the differ- ence was 1.3% in male students and 2.9% in female students (P<0.001). Finally, 40.8% of students controlled weight through exercise. The difference was 34.7% in male students and 48.0% in female students (P<0.001) (Table 1).
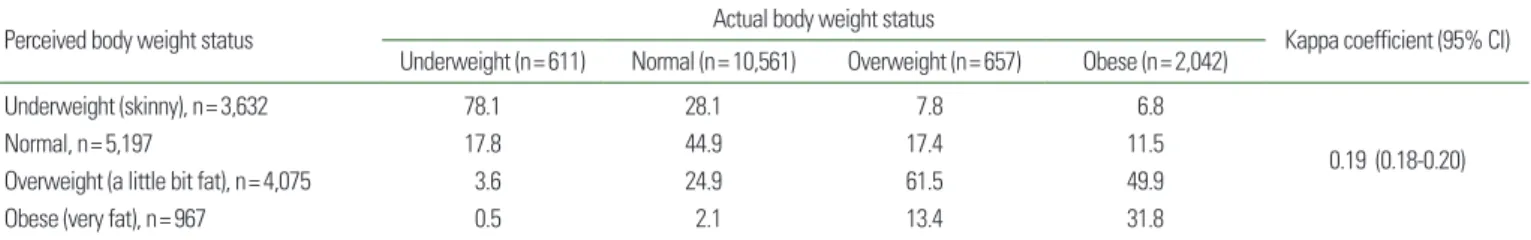
Agreement between actual and perceived body weight status
The percentile of agreement between the actual and perceived body weight status was examined. The “agreement” case of actual
“underweight” and perceived “skinny” accounted for 78.1%, the
“normal” case of actual “normal” and perceived “normal” for 44.9%, the case of actual “overweight” and perceived “a little bit fat” for 61.5%, and the case of actual “obese” and perceived “very fat” for 31.8%. The kappa coefficient was 0.19 (95% CI, 0.18-0.20), and the agreement level was weak (Table 2).
13Comparison of agreement and disagreement in body weight status according to participant characteristics
The actual and perceived body weight statuses were examined
based on the participant characteristics. The agreement of male
students was 42.3%, which was lower than that of female students
at 48.7% (P<0.001). The grade with the highest agreement level
was middle school 7th grade at 47.9%, and the lowest was middle
school 9th grade at 42.6% (P<0.001).
“Mild overestimation” and “severe overestimation” were higher in female students, accounting for 27.1% and 2.5%, respectively, than in male students, accounting for 14.8% and 1.2%; they were higher in higher grades with 17.0% and 0.9%, respectively, in mid- dle school 7th graders, 19.3% and 1.8% in middle school 9th grad- ers, and 22.8% and 2.4% in high school 12th graders. They were higher in students who attempted weight control, accounting for 27.1% and 2.3%, respectively, and those who did not, accounting
for 13.0% and 1.2%; in students who controlled their diet, account- ing for 30.5% and 2.9%, than in those who did not, accounting for 15.9% and 1.3%; and in students who exercised, accounting for 27.8% and 2.5%, than those who did not, accounting for 15.3% and 1.4% (P<0.001).
“Mild underestimation” and “severe underestimation” were found in 39.0% and 9.8%, respectively, in students who took medi- cation for weight control, higher than the percentiles 29.4% and 2.9% of those who did not (P<0.001) (Table 3).
Table 1. Demographic and obesity-related characteristics
Classification Total Male Female Chi-square P
Subjects 13,871 7,568 (100) 6,303 (100)
Grade 7th 2,345 1,314 (17.4) 1,031 (16.4) 52.45 < 0.001
8th 2,232 1,246 (16.5) 986 (15.6)
9th 2,372 1,410 (18.6) 962 (15.3)
10th 2,428 1,215 (16.1) 1,213 (19.2)
11th 2,193 1,140 (15.1) 1,053 (16.7)
12th 2,301 1,243 (16.4) 1,058 (16.8)
Actual body weight status Underweight 611 283 (3.7) 328 (5.2) 353.35 < 0.001
Normal 10,561 5,685 (75.1) 4,876 (77.4)
Overweight 657 194 (2.6) 463 (7.4)
Obese 2,042 1,406 (18.6) 636 (10.1)
Perceived body weight status Underweight (skinny) 3,632 2,377 (31.4) 1,255 (19.9) 271.28 < 0.001
Normal 5,197 2,786 (36.8) 2,411 (38.3)
Overweight (a little bit fat) 4,075 1,947 (25.7) 2,128 (33.8)
Obese (very fat) 967 458 (6.1) 509 (8.1)
Attempt(s) to lose weight Yes 7,307 3,396 (44.9) 3,911 (62.1) 407.01 < 0.001
No 6,564 4,172 (55.1) 2,392 (38.0)
Methods of weight control Diet Yes 1,441 (19.0) 2,839 (45.0) 1089.72 < 0.001
No 6,127 (81.0) 3,464 (55.0)
Medication Yes 95 (1.3) 182 (2.9) 46.81 < 0.001
No 7,473 (98.7) 6,121 (97.1)
Exercises Yes 2,628 (34.7) 3,026 (48.0) 251.31 < 0.001
No 4,940 (65.3) 3,277 (52.0)
Data shown are number (percent) by descriptive and Chi-square.
Grades 7th, 8th, and 9th are middle school students.
Grades 10th, 11th, and 12th are high school students.
Table 2. Agreement percent between actual and perceived body weight status
Perceived body weight status Actual body weight status
Kappa coefficient (95% CI) Underweight (n= 611) Normal (n= 10,561) Overweight (n= 657) Obese (n= 2,042)
Underweight (skinny), n= 3,632 78.1 28.1 7.8 6.8
0.19 (0.18-0.20)
Normal, n= 5,197 17.8 44.9 17.4 11.5
Overweight (a little bit fat), n= 4,075 3.6 24.9 61.5 49.9
Obese (very fat), n= 967 0.5 2.1 13.4 31.8
Data shown are agreement percent with Kappa Coefficient.
Factors related to the disagreement between actual and perceived body weight status
For the subjects with disagreed actual and perceived body weight statuses, the variables influencing “mild overestimation,” “severe overestimation,” “mild underestimation,” and “severe underestima- tion” were examined through multinomial logistic regression.
In Model 1, the odds ratio was examined after introducing gender, grade, and weight control attempt to the model. The respective odds ratio of “mild overestimation” and “severe overestimation” 1.43 (95%
CI, 1.31-1.57) and 1.59 (95% CI, 1.22-2.07) in female students; 1.25 (95% CI, 1.06-1.46) and 2.09 (95% CI, 1.24-3.53) in middle school 9th graders;1.35 (95% CI, 1.15-1.58) and 1.97 (95% CI, 1.17-3.32) in high school 10th graders; 1.41 (95% CI, 1.20-1.65) and 2.77 (95% CI, 1.68-4.59) in high school 11th graders; and 1.38 (95% CI, 1.18-1.62) and 2.62 (95% CI, 1.59-4.33) in high school 12th grad- ers. The ratios were 2.05 (95% CI, 1.87-2.26) and 1.81 (95% CI, 1.38-2.38) when weight control was attempted respectively.
In Model 2, the weight control methods of diet, medication, and exercise were newly introduced in place of weight control attempt in Model 1. The odds ratio of “mild overestimation” and “severe
overestimation” was also higher as the grade got higher, just as in Model 1. For diet control, the odd ratios were 1.66 (95% CI, 1.50- 1.83) and 1.78 (95% CI, 1.36-2.34) when controlled respectively and 1.58 (95% CI, 1.44-1.74) and 1.53 (95% CI, 1.18-2.00) when exercise was performed, respectively Therefore, it was found that it was more likely for students on a diet and those controlling weight through exercise to overestimate their body weight. Conversely, in the case of taking medication, the odds ratios of “mild underesti- mation” and “severe underestimation” were 2.29 (95% CI, 1.72- 3.07) and 5.77 (95% CI, 3.68-9.06), respectively. It was found that students who did take some medication for weight control was more likely to underestimate their body weight (Table 4).
DISCUSSION
Obesity continues to grow in modern societies, and the trend of adolescent obesity is increasing at a more rapid rate.
14Therefore, various health improvement strategies should be designed to man- age obesity. In this context, this study was initiated to explore the degree of agreement between actual and perceived body weight
Table 3. Agreement and disagreement percent between actual and perceived body weight by demographic and obesity-related characteristicsClassification Subjects Agreement
(n= 6,271)
Disagreement
Chi-square P
Mild over- estimation (n= 2,827)
Severe over- estimation (n= 251)
Mild under- estimation (n= 4,098)
Severe under- estimation
(n= 424)
Total 13,871 45.2 20.4 1.8 29.5 3.1
Gender Male 7,568 42.3 14.8 1.2 37.7 4.0 738.20 < 0.001
Female 6,303 48.7 27.1 2.5 19.7 2.0
Grade 7th 2,345 47.9 17.0 0.9 30.7 3.5 105.21 < 0.001
8th 2,232 46.1 18.2 1.5 31.2 3.0
9th 2,372 42.6 19.3 1.8 33.0 3.3
10th 2,428 44.0 21.9 1.8 29.1 3.2
11th 2,193 44.1 23.2 2.5 28.0 2.2
12th 2,301 46.6 22.8 2.4 25.2 3.0
Attempt(s) to lose weight Yes 7,307 44.4 27.1 2.3 22.9 3.3 594.82 < 0.001
No 6,564 46.1 13.0 1.2 36.9 2.8
Methods of weight control Diet Yes 4,280 43.3 30.5 2.9 20.7 2.7 521.23 < 0.001
No 9,591 46.0 15.9 1.3 33.5 3.2
Medication Yes 277 32.5 16.3 2.5 39.0 9.8 63.22 < 0.001
No 13,594 45.5 20.5 1.8 29.4 2.9
Exercises Yes 5,654 45.1 27.8 2.5 21.6 3.0 482.28 < 0.001
No 8,217 45.3 15.3 1.4 35.0 3.1
Data shown are percent of agreement and disagreement type by descriptive and Chi-square.
Grades 7th, 8th, and 9th are middle school students.
Grades 10th, 11th, and 12th are high school students.
status and the relationship between body weight perception and obesity control behaviors.
Adolescents, who are more sensitive to their appearances than any other age group, tended to perceive their weight by comparing it to that of others rather than their actual body weight status
1,3, and their weight control behaviors varied depending on how they per- ceived their weight. In other words, they were performing behav- iors to prevent or manage obesity when they perceived their weight as excessive.
10,11Therefore, it will be possible to predict the involve- ment of weight control behaviors according to their weight percep- tion. The weight control behaviors of adolescents based on their weight perception are particularly important as these may shape their habitual behaviors, which may continue into adulthood.
The rate of agreement between actual and perceived body weight status was 45.2%, and the disagreement rate was 54.8%. In a
study on the Korean adult population, the agreement of obesity and body-shape perception was 74.9%, and disagreement was 25.1%.
15Thus, the disagreement was higher in adolescents, and it is necessary to emphasize more precise weight perception among ad- olescents. In case of disagreement, it derives from underestimating or overestimating one’s own weight. In this study, “mild overestima- tion” was found in 20.4%, and “severe overestimation” was found in 1.8%. “Mild underestimation” was found in 29.5%, and “severe un- derestimation” was found in 3.1%. The percentage of subjects who perceived themselves as underweight was higher than that of those who considered themselves overweight. This was quite different from some precedent studies on adolescents, which suggested that adolescents perceived themselves more as overweight even though they were normal.
9,16With regard to the agreement of actual and perceived body
Table 4. Factors of disagreement between actual and perceived body weight status by multinomial logistic regressionModel Classification Disagreement
Mild over-estimation Severe over-estimation Mild under-estimation Severe under-estimation
Model 1 Gender Male 1.0 1.0 1.0 1.0
Female 1.43 (1.31-1.57) 1.59 (1.22-2.07) 0.48 (0.44-0.52) 0.41 (0.33-0.51)
Grade 7th 1.0 1.0 1.0 1.0
8th 1.09 (0.93-1.29) 1.66 (0.96-2.86) 1.06 (0.93-1.22) 0.86 (0.62-1.21)
9th 1.25 (1.06-1.46) 2.09 (1.24-3.53) 1.19 (1.04-1.36) 1.02 (0.74-1.40)
10th 1.35 (1.15-1.58) 1.97 (1.17-3.32) 1.07 (0.94-1.23) 1.03 (0.75-1.42)
11th 1.41 (1.20-1.65) 2.77 (1.68-4.59) 1.02 (0.89-1.17) 0.69 (0.48-1.00)
12th 1.38 (1.18-1.62) 2.62 (1.59-4.33) 0.84 (0.73-0.96) 0.87 (0.63-1.22)
Attempt(s) to lose weight No 1.0 1.0 1.0 1.0
Yes 2.05 (1.87-2.26) 1.81 (1.38-2.38) 0.71 (0.65-0.77) 1.35 (1.11-1.65)
Model 2 Gender Male 1.0 1.0 1.0 1.0
Female 1.32 (1.20-1.45) 1.40 (1.07-1.84) 0.48 (0.44-0.52) 0.40 (0.32-0.50)
Grade 7th 1.0 1.0 1.0 1.0
8th 1.08 (0.92-1.27) 1.63 (0.95-2.81) 1.06 (0.93-1.22) 0.86 (0.62-1.21)
9th 1.22 (1.04-1.44) 2.03 (1.20-3.43) 1.19 (1.04-1.36) 1.01 (0.74-1.40)
10th 1.29 (1.10-1.50) 1.86 (1.10-3.14) 1.07 (0.94-1.23) 1.02 (0.74-1.40)
11th 1.37 (1.17-1.60) 2.65 (1.60-4.38) 1.02 (0.88-1.17) 0.70 (0.49-1.02)
12th 1.35 (1.15-1.58) 2.54 (1.53-4.19) 0.83 (0.72-0.95) 0.87 (0.62-1.21)
Methods of weight control Diet No 1.0 1.0 1.0 1.0
Yes 1.66 (1.50-1.83) 1.78 (1.36-2.34) 0.87 (0.79-0.96) 1.07 (0.85-1.36)
Medication No 1.0 1.0 1.0 1.0
Yes 0.91 (0.63-1.31) 1.57 (0.72-3.46) 2.29 (1.72-3.07) 5.77 (3.68-9.06)
Exercise No 1.0 1.0 1.0 1.0
Yes 1.58 (1.44-1.74) 1.53 (1.18-2.00) 0.67 (0.62-0.74) 1.04 (0.85-1.28) Data shown are odds ratio (95% CI) adjusted for gender, grade and attempt to lose weight (model 1) or methods of weight control (model 2) by multinomial logistic regression.
Grades 7th, 8th, and 9th are middle school students.
Grades 10th, 11th, and 12th are high school students.