pISSN 2288-9272 eISSN 2383-8493 J Oral Med Pain 2017;42(1):1-7 https://doi.org/10.14476/jomp.2017.42.1.1
Clinical Characteristics and Polysomnographic Features of Patients Visited a Snoring and Sleep Apnea Clinic of Dental Hospital in Korea
Ji-Rak Kim, Jin Woo Chung
Department of Oral Medicine and Oral Diagnosis, School of Dentistry and Dental Research Institute, Seoul National University, Seoul, Korea
Received February 10, 2017 Revised March 16, 2017 Accepted March 17, 2017
Purpose: The aims of this study were to evaluate the clinical characteristics and polysomno- graphic results of patients visited the Seoul National University Dental Hospital (SNUDH) and to suggest guidelines for the management of sleep disordered-breathing patients in a dental clinic.
Methods: Five hundred sixty-two patients who visited the Snoring and Sleep Apnea Clinic of SNUDH were evaluated for clinical characteristics including associated comorbidities, age, gen- der, body mass index (BMI), neck circumference, and daytime sleepiness and among them 217 patients were performed nocturnal polysomnography for evaluating respiratory disturbance in- dex, apnea-hypopnea index (AHI), oxygen saturation levels, and sleep stages. The associations among clinical characteristics, sleep parameters, and positional and rapid eye movement (REM) dependencies of the patients were analyzed.
Results: The most common co-morbidities of the patients were cardiovascular (30.2%), endo- crine (10.8%), and respiratory diseases (7.9%). Age (β=0.394), total AHI (β=0.223), and lowest O
2saturation levels (β=0.205) were significantly associated with the number of co-morbidities in patients with obstructive sleep apnea (OSA). Mean O
2saturation was not significantly as- sociated with number of co-morbidities. Non-positional OSA patients had higher BMI, longer neck circumferences, more severe AHI values, and lower mean and lowest O
2saturation levels compared to positional OSA patients. Not-REM-related patients were older and had more se- vere AHI values compared to REM-related patients. Not-REM-related patients have longer du- ration of stage I sleep and shorter stage II, III, and REM sleep than REM-related patients. There were no significant differences in each sleep stage between positional and non-positional pa- tients. Neck circumference, positional dependency, REM dependency, and percentage of supine position were significantly associated with severity of OSA.
Conclusions: Age, total AHI, and lowest O
2saturation level were significantly associated with the number of co-morbidities in patients with OSA. Neck circumference, positional dependency, REM dependency, and percentage of supine position were significantly associated with severity of OSA.
Key Words: Obstructive sleep apnea; Polysomnography; REM sleep; Sleep position; Snoring
Correspondence to:
Jin Woo Chung
Department of Oral Medicine and Oral Diagnosis, School of Dentistry and Dental Research Institute, Seoul National University, 101 Daehak-ro, Jongno-gu, Seoul 03080, Korea Tel: +82-2-2072-3021 Fax: +82-2-744-9135 E-mail: [email protected]
JOMP
Journal of Oral Medicine and PainCopyright Ⓒ 2017 Korean Academy of Orofacial Pain and Oral Medicine. All rights reserved.
CC This is an open-access article distributed under the terms of the Creative Commons Attribution Non-Commercial License (http://creativecommons.org/licenses/by-nc/4.0/), which permits unrestricted non-commercial use, distribution, and reproduction in any medium, provided the original work is properly cited.
INTRODUCTION
Obstructive sleep apnea (OSA) is defined as a cessation of breathing by repetitive complete or partial the collapse of upper airway during sleep resulting in sleep fragmentation
and oxygen desaturation. Signs and symptoms of OSA in-
clude excessive daytime sleepiness, insomnia, nocturia,
morning headache, and intermittent hypoxemia. Risk fac-
tors for developing OSA include aging, obesity, male gen-
der, menopause, family history, nasal obstruction, alcohol
consumption, and craniofacial abnormalities.
1)The prevalence of OSA is higher in the elderly and male gender. In a recent Korean study, the prevalence of OSA (apnea-hypopnea index [AHI]>5) was reported to be 27.1%
in men and 16.8% in women.
2)Despite of its high preva- lence, recognition of this disease remains low and many recent studies suggested that untreated patients with OSA have high risk of death from all causes, especially cardio- vascular co-morbidities. There are many evidences that OSA causes cardiovascular complications including hyper- tension, myocardial infarction, stroke and treatment of OSA can improve cardiovascular morbidity and mortality.
3-7)Various surgical and non-surgical modalities have been suggested for treating snoring and sleep apnea. For non- surgical modalities, general and behavioral therapy, such as weight loss, smoking cessation, avoidance of alcohol, and changing position during sleep can be a possible treatment.
People with moderate to severe apnea are recommended continuous positive airway pressure (CPAP) or oral appli- ances. While CPAP therapy is the most effective treatment option for most patients with OSA, its discomfort causes less tolerance and compliance. Therefore, clinical needs for oral appliance have increased and the role of dentists has become more important in the management of OSA. There are many surgical modalities for treating OSA such as uvu- lopalatopharyngoplasty, orthognathic surgery, and trache- ostomy. The type of surgery should be selected according to the individual’s anatomy, health status, age, and severity of sleep apnea.
Even though the upper airway space is not significantly different, the severity of OSA can differ according to the patient’s sleep position or duration of rapid eye movement (REM) sleep. Cartwright suggested positional patients were defined as those whose AHI is at least twice as high while sleeping in supine position as in non-supine position.
8)Haba-Rubio et al.
9)suggested REM-related patients were de- fined as those whose AHI during REM sleep is more than twice than that during non-REM (NREM) sleep.
The aims of this study were to evaluate clinical charac- teristics and polysomnography data of patients with OSA who visited the Seoul National University Dental Hospital (SNUDH) to evaluate the differences in clinical and poly- somnography parameters according to positional or REM
dependencies, and to analyze risk factors on severity of OSA.
MATERIALS AND METHODS
1. Subjects
A total of 562 patients who visited the Snoring and Sleep Apnea Clinic from January 2007 through August 2014 for the treatment of snoring and sleep apnea were evaluated.
Among them 217 patients were examined by grade I poly- somnography, and 163 patients were analyzed after exclu- sion of the patients who showed AHI score less than 5.
The patients examined by polysomnography were clas- sified into positional (supine AHI ≥2×lateral AHI) and non- positional (supine AHI <2×lateral AHI) OSA patients accord- ing to the positional dependency,
8)and REM-related (REM AHI ≥2×non-REM AHI) and not-REM-related (REM AHI
<2×non-REM AHI) OSA patients according to the REM de- pendency.
9)From the 163 subjects, 43 patients were catego- rized as non-positional OSA and 120 patients as positional OSA, and 105 patients were categorized as not-REM-related OSA and 58 patients as REM-related OSA. Demographic and co-morbidity data of the patients including age, gen- der, body mass index (BMI), neck circumference, and day- time sleepiness were obtained. The daytime sleepiness was evaluated using Epworth Sleepiness Scale (ESS).
This study was approved by the institutional review board of SNUDH (CRI 14037).
2. Polysomnography
Among the patients, 163 patients were performed level 1 polysomnography including electroencephalography (EEG), electrooculography (EOG), chin electromyography (EMG), leg EMG, electrocardiogram (ECG), airflow recorded with nasal thermistor and cannula, pulse oximetry, and body po- sition by Alice 5 (Respironics, Pittsburgh, PA, USA).
Apnea was scored when 1) there is a drop in the peak
signal excursion by ≥90% of pre-event baseline using an
oronasal thermal sensor. 2) The duration of the ≥90% drop
in sensor signal is ≥10 seconds. The duration of the event
is from the nadir in flow preceding the first breath that is
clearly reduced to the start of the first breath that approxi-
mates baseline breathing.
Hypopneas were initially scored when 1) the peak signal excursions drop by ≥30% of pre-event baseline using nasal pressure, 2) the duration of the ≥30% drop in signal excur- sions is ≥10 seconds, and 3) there is ≥3% oxygen desatura- tion from pre-event baseline or the event is associated with an arousal.
10)The AHI was defined as the total number of apnea and hypopnea events per hour of sleep. The severity of sleep apnea was classified into mild (AHI 5-14), moder- ate (AHI 15-30), and severe (more than 30).
The respiratory disturbance index (RDI) was calculated as the number of apnea plus hypopnea plus respiratory effort related arousal.
3. Statistical Analysis
Baseline demographics (age, BMI, and neck circumfer- ence), total AHI, mean and lowest O
2saturation levels, and differences between positional and REM dependency were analyzed by independent t-test and Mann-Whitney test.
Associations between AHI value and risk factors including gender, age, neck circumference, percentage time in supine position, and positional and REM dependencies were es- timated using multiple linear regression analysis. Because AHI value showed non-parametric distribution, the AHI value was log-transformed and then used for multiple lin- ear regression analyses.
RESULTS
1. Clinical and Polysomnographic Characteristics of the Patients
The patients were consisted of 437 men (77.8%) and 125 women (22.2%), and age ranged from 2 to 88 years (mean age 48.9±15.4 years). The most common co-morbidities of patients were cardiovascular (hypertension, stroke, and heart disease, 30.2%), endocrine (10.8%), respiratory (7.9%), gastrointestinal (7.7%), and neuromuscular (5.3%) diseases.
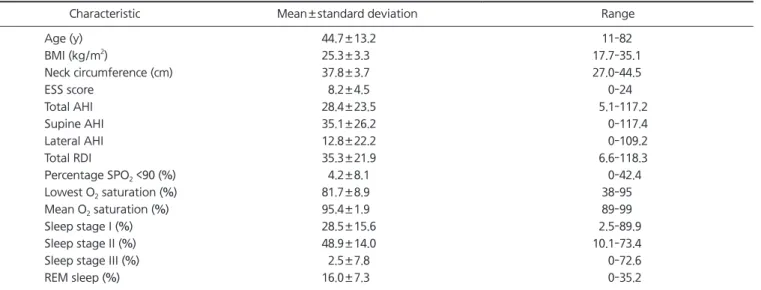
Table 1 shows the general characteristics and polysom- nographic features. There were 135 men (82.8%) and 28 women (17.2%), age ranged from 11 to 82 years (mean age 44.7±13.2 years). According to their AHI, the percentages of the patients were for mild, moderate, and severe OSA were 42.3%, 21.5%, and 36.2%, respectively.
2. Impacts of Sleep Parameters on Number of Co-morbidities
Table 2 shows the results of multiple linear regression analyses of the risk factors on the number of co-morbidi- ties of the patients. Age (β=0.394), total AHI (β=0.223), and lowest O
2saturation (β=0.205) were significantly associ- ated with number of co-morbidities in patients with OSA.
However, mean O
2saturation was not significantly associ- ated with number of co-morbidities after adjusting for the confounding factors in patients with OSA.
Table 1. Demographic features and polysomnographic results
Characteristic Mean±standard deviation Range
Age (y) 44.7±13.2 11-82
BMI (kg/m
2) 25.3±3.3 17.7-35.1
Neck circumference (cm) 37.8±3.7 27.0-44.5
ESS score 8.2±4.5 0-24
Total AHI 28.4±23.5 5.1-117.2
Supine AHI 35.1±26.2 0-117.4
Lateral AHI 12.8±22.2 0-109.2
Total RDI 35.3±21.9 6.6-118.3
Percentage SPO
2<90 (%) 4.2±8.1 0-42.4
Lowest O
2saturation (%) 81.7±8.9 38-95
Mean O
2saturation (%) 95.4±1.9 89-99
Sleep stage I (%) 28.5±15.6 2.5-89.9
Sleep stage II (%) 48.9±14.0 10.1-73.4
Sleep stage III (%) 2.5±7.8 0-72.6
REM sleep (%) 16.0±7.3 0-35.2
BMI, body mass index; ESS, Epworth Sleepiness Scale; AHI, apnea-hypopnea index; RDI, respiratory disturbance index; REM, rapid eye
movement.
3. Comparison of Patients according to the Positional and REM Dependencies
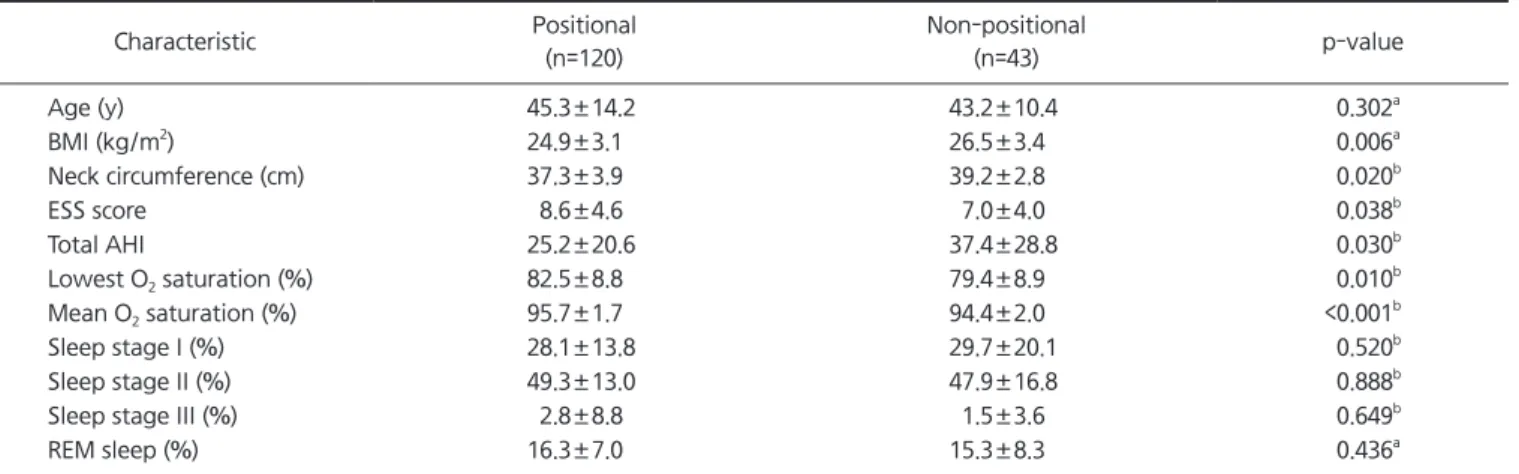
Descriptive data between positional and non-positional OSA groups are shown in Table 3. One hundred twenty pa- tients (73.6%) were positional and 43 patients were non- positional OSA. There were significant differences in BMI, neck circumference, and ESS score between positional and non-positional OSA groups. Non-positional OSA patients had more severe AHI values, and lower mean and lowest O
2saturation levels than positional OSA patients. There was no significant difference in each sleep stage between positional and non-positional patients.
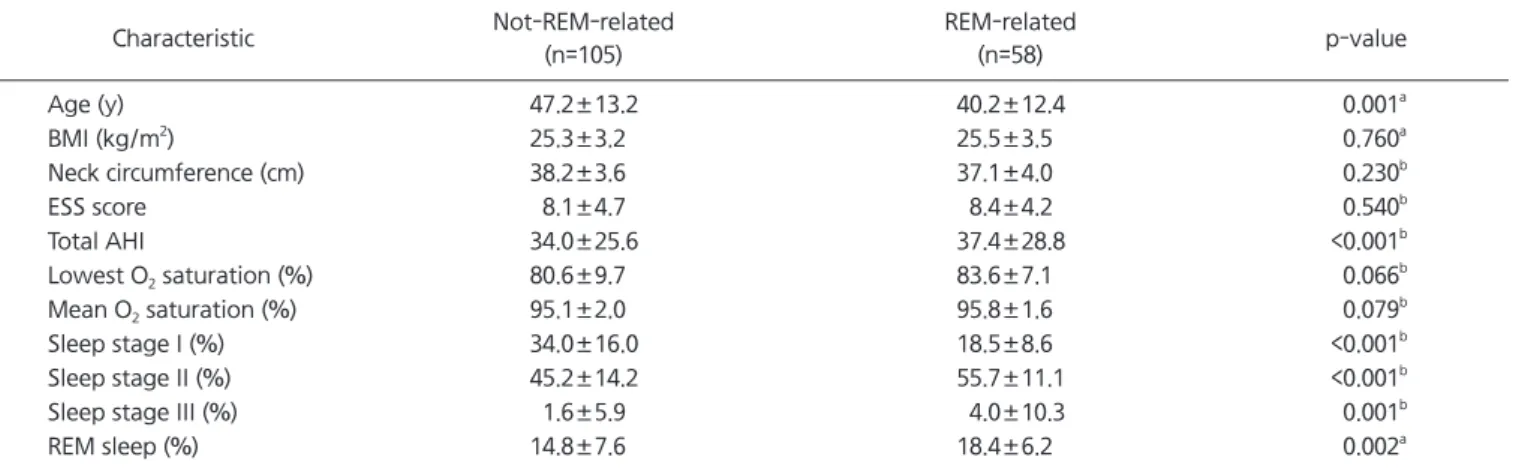
Table 4 shows the descriptive data of REM dependencies.
One hundred five patients (64.4%) were classified as not- REM-related and 58 patients were classified as REM-related
OSA. Not-REM-related patients were significantly older and had more severe AHI values than REM-related patients.
Not-REM-related patients have significantly longer dura- tion of stage I sleep and shorter stage II, III, and REM sleep than REM-related group.
4. Impacts of Risk Factors on Severity of OSA
Table 5 shows multiple linear regression analysis for the impacts of risk factors on severity of OSA. Neck circumfer- ence was the most significant associated factor on severity of OSA (β=0.405). Positional dependency (β=0.190), REM dependency (β=0.271), and percentage of supine position (β=0.200) were also significantly associated with severity of OSA.
Table 2. Multivariate linear regression analysis of the risk factors on the number of co-morbidities
Risk factor Coefficient β-value p-value Adjusted R
2A 0.458
Age 0.030 0.394 <0.001
BMI 0.025 0.080 0.320
Total AHI 0.009 0.223 0.022
Lowest O
2saturation 0.023 0.205 0.027
Total sleep time 0.002 0.132 0.088
B 0.450
Age 0.030 0.395 <0.001
BMI 0.031 0.097 0.266
Total AHI 0.008 0.194 0.045
Mean O
2saturation 0.097 0.179 0.072
Total sleep time 0.002 0.134 0.090
A, lowest O
2saturation was included for the risk factor; B, mean O
2saturation was included for the risk factor.
BMI, body mass index; AHI, apnea-hypopnea index.
Table 3. Comparison of polysomnographic results according to positional dependency
Characteristic Positional
(n=120)
Non-positional
(n=43) p-value
Age (y) 45.3±14.2 43.2±10.4 0.302
aBMI (kg/m
2) 24.9±3.1 26.5±3.4 0.006
aNeck circumference (cm) 37.3±3.9 39.2±2.8 0.020
bESS score 8.6±4.6 7.0±4.0 0.038
bTotal AHI 25.2±20.6 37.4±28.8 0.030
bLowest O
2saturation (%) 82.5±8.8 79.4±8.9 0.010
bMean O
2saturation (%) 95.7±1.7 94.4±2.0 <0.001
bSleep stage I (%) 28.1±13.8 29.7±20.1 0.520
bSleep stage II (%) 49.3±13.0 47.9±16.8 0.888
bSleep stage III (%) 2.8±8.8 1.5±3.6 0.649
bREM sleep (%) 16.3±7.0 15.3±8.3 0.436
aBMI, body mass index; ESS, Epworth Sleepiness Scale; AHI, apnea-hypopnea index; REM, rapid eye movement.
Values are presented as mean±standard deviation.
a
p-value was obtained from independent t-test.
bp-value was obtained from Mann-Whitney test.
DISCUSSION
OSA is involved with several co-morbidities including car- diovascular,
4-7)metabolic,
11)and neurocognitive diseases.
12)Above all, hypertension is most strongly associated with OSA and OSA is considered as an independent predic- tor or major cause of hypertension.
4,13,14)In our study, co- morbid diseases accounted for 40.5% of the total patients and the most common co-morbidities were cardiovascu- lar diseases (30.2%), endocrine (10.8%), respiratory (7.9%), gastrointestinal (7.7%), and neuromuscular (5.3%) dis- eases. Hypertension was the most common single disease with 26.3%. These results were generally agreed with prior studies.
15-17)Pathophysiology of upper airway obstruction is multifac- torial and complex, leading to a chronic recurrent state of
intermittent hypoxemia and re-oxygenation during sleep, maintaining a state of oxidative stress, which seems to be the key to development of a number of high systematic complications.
18)Our study showed that lowest O
2satura- tion levels (β=0.205) were significantly associated with number of co-morbidities in patients with OSA while mean O
2saturation was not associated with the number of co- morbidities in patients with OSA. Recently Min et al.
19)also reported the lowest O
2saturation level during sleep was the only significant associated factor (odds ratio=0.9) influenc- ing the presence of hypertension whereas mean O
2satura- tion did not show any significant associations.
In our study, non-positional OSA patients showed signifi- cantly higher BMI, longer neck circumferences, more severe AHI values, and lower mean and lowest O
2saturation lev- els than positional OSA patients. Oksenberg et al.
20)reported positional patients were on thinner, younger, and less se- vere breathing abnormalities and preserve better sleep qual- ity than non-positional patients. There is a complex rela- tionship between sleep apnea and BMI, age, and positional dependency, so simple comparison may not be acceptable.
Chung et al.
21)reported patients with non-positional OSA had more severe overall AHI values, and showed lower mean O
2saturation, and higher percentage snoring time compared with the age-, gender-, and BMI-matched posi- tional OSA patients.
The overall prevalence of REM-related OSA was similar with previous studies. O’Connor et al.
22)reported an overall
Table 4. Comparison of polysomnographic results according to REM dependency
Characteristic Not-REM-related
(n=105)
REM-related
(n=58) p-value
Age (y) 47.2±13.2 40.2±12.4 0.001
aBMI (kg/m
2) 25.3±3.2 25.5±3.5 0.760
aNeck circumference (cm) 38.2±3.6 37.1±4.0 0.230
bESS score 8.1±4.7 8.4±4.2 0.540
bTotal AHI 34.0±25.6 37.4±28.8 <0.001
bLowest O
2saturation (%) 80.6±9.7 83.6±7.1 0.066
bMean O
2saturation (%) 95.1±2.0 95.8±1.6 0.079
bSleep stage I (%) 34.0±16.0 18.5±8.6 <0.001
bSleep stage II (%) 45.2±14.2 55.7±11.1 <0.001
bSleep stage III (%) 1.6±5.9 4.0±10.3 0.001
bREM sleep (%) 14.8±7.6 18.4±6.2 0.002
aREM, rapid eye movement; BMI, body mass index; ESS, Epworth Sleepiness Scale; AHI, apnea-hypopnea index.
Values are presented as mean±standard deviation.
a