ABSTRACT
Background: Without standardization of medical laboratory's testing practices, there is an increase in false diagnoses when relying on test results. However, the effect of test standardization is difficult to assess numerically. This study's purpose is to quantify the effect of the standardization level of a laboratory on the prevalence of diabetes mellitus (DM) and impaired fasting glucose (IFG).
Methods: Laboratories were classified into three levels: ‘highly-standardized laboratory,’
‘basically-standardized laboratory,’ and ‘non-standardized laboratory.’ Based on the results of Korean External Quality Assessment Scheme (KEQAS), the cutoff values for diagnosis of DM and IFG were recalculated, given false positive and false negative rates.
Results: The prevalence of DM and IFG in the population as a whole was estimated using the 2013 Korea National Health and Nutrition Examination Survey (KNHANES) database. When the prevalence of DM from KNHANES was 11.88% (95% confidence interval [CI], 10.59%–
13.17%), the proportion with a systematic false error ranged from 10.91% (95% CI, 9.65%–
12.17%) to 13.09% (95% CI, 11.74%–14.45%). The prevalence of IFG varied from 13.59% (95%
CI, 12.25%–14.91%) to 40.49% (95% CI, 38.54%–42.43%), in contrast to 24.58% (95% CI, 22.85%–26.31%) of the reference value. The prevalence of DM and IFG tended to be over- and under-estimated more as the laboratory standardization level became lower, respectively.
Conclusion: Our study proved that standardization of clinical laboratory tests is an important factor affecting the prevalence estimation of national disease statistics based on the
simulation using KNHANES data.
Keywords: Standardization of Diagnostic Tests; Korean External Quality Assessment Scheme; Variance Index Score; National Prevalence; False Positivity; False Negativity
Original Article
Bora Lee ,1* Ji Sung Lee ,2* Yong-Wha Lee ,3 Mi-Ae Jang ,3 Junghan Song ,4 Jeong-Ho Kim ,5 Wee Gyo Lee ,6 Won-Ki Min ,7 Juneyoung Lee ,8 and You Kyoung Lee 3
1 Department of Biostatistics, Clinical Trial Center, Soonchunhyang University Bucheon Hospital, Soonchunhyang University College of Medicine, Bucheon, Korea
2Clinical Trial Center, University of Ulsan College of Medicine, Asan Medical Center, Seoul, Korea
3 Department of Laboratory Medicine and Genetics, Soonchunhyang University Bucheon Hospital, Soonchunhyang University College of Medicine, Bucheon, Korea
4 Department of Laboratory Medicine, Seoul National University Bundang Hospital, Seoul National University College of Medicine, Seongnam, Korea
5Department of Laboratory Medicine, Yonsei University College of Medicine, Seoul, Korea
6Department of Laboratory Medicine, Ajou University School of Medicine, Suwon, Korea
7 Department of Laboratory Medicine, University of Ulsan College of Medicine, Asan Medical Center, Seoul, Korea
8Department of Biostatistics, Korea University College of Medicine, Seoul, Korea
Effect of the Standardization of Diagnostic Tests on the Prevalence of Diabetes Mellitus and Impaired Fasting Glucose
Received: Apr 27, 2017 Accepted: Jan 5, 2018 Address for Correspondence:
You Kyoung Lee, MD, PhD
Department of Laboratory Medicine and Genetics, Soonchunhyang University Bucheon Hospital, Soonchunhyang University College of Medicine, 170 Jomaru-ro, Wonmi-gu, Bucheon 14584, Republic of Korea.
E-mail: [email protected]
*Bora Lee and Ji Sung Lee contributed equally to this work.
© 2018 The Korean Academy of Medical Sciences.
This is an Open Access article distributed under the terms of the Creative Commons Attribution Non-Commercial License (https://
creativecommons.org/licenses/by-nc/4.0/) which permits unrestricted non-commercial use, distribution, and reproduction in any medium, provided the original work is properly cited.
ORCID iDs Bora Lee
https://orcid.org/0000-0002-6322-5712 Ji Sung Lee
https://orcid.org/0000-0001-8194-3462 Yong-Wha Lee
https://orcid.org/0000-0002-4459-6286 Mi-Ae Jang
https://orcid.org/0000-0002-6558-5236 Junghan Song
https://orcid.org/0000-0003-0576-9938 Jeong-Ho Kim
https://orcid.org/0000-0003-2479-0548
Laboratory Medicine
Wee Gyo Lee
https://orcid.org/0000-0003-2635-4774 Won-Ki Min
https://orcid.org/0000-0002-5158-2130 Juneyoung Lee
https://orcid.org/0000-0001-8073-9304 You Kyoung Lee
https://orcid.org/0000-0003-1835-2007 Funding
This work was supported by the Soonchunhyang University Research Fund (2017).
Disclosure
The authors have no potential conflicts of interest to disclose.
Author Contributions
Conceptualization: Lee YK, Min WK. Formal analysis: Lee B, Lee JS. Writing - original draft:
Lee B, Jang MA. Writing - review & editing: Lee YW, Song J, Kim JH, Lee WG, Lee J.
INTRODUCTION
A medical laboratory test is defined as a test done on a clinical specimen which is meant to provide information about the diagnosis, treatment, and prevention of disease to healthcare professionals.1 Test results are widely used as objective evidence when making clinical decisions or explaining a patient's health status. Laboratory tests are also known to affect medical decisions in about 70% of cases.2
To achieve reliable test results, many laboratories are taking a more focused and stringent approach to standardization. Without standardization, it is impossible to guarantee the reliability or accuracy of test results, which increases the false positive (FP) and false negative (FN) rates. FP results lead to an unnecessary increase in spending on subsequent tests and treatments, and FN results deprive patients of the opportunity to be treated in a timely manner. The World Health Organization (WHO) places importance on ‘accurate and relevant diagnostic testing’ to achieve the medical objectives of the millennium development goals suggested by the United Nations (UN).3
In order to improve the quality of clinical laboratory tests, it is necessary to standardize not only the products used for the tests, but also the standardization of the clinical laboratory practice. Internationally, various means have been developed and introduced to standardize and assure clinical laboratory quality in terms of clinical laboratory practices. The Technical Committee (TC) 212 of the International Standard Organization (ISO) enacted ISO 15189 (medical laboratories: requirements for quality and competence) in 2003. It has already been implemented in Europe and Australia and has recently come into play in Asia.4 The Centers for Disease Control and Prevention (CDC) in America has been running the lipid standardization program to improve the accuracy of clinical testing in laboratories.5 In Korea, no national regulatory standards have been provided for clinical laboratories.
The standardization of laboratory practice depends on a private sector entity, the Korean Laboratory Accreditation Program (KLAP), and the Korean External Quality Assessment Scheme (KEQAS).6,7 In a previous study, it turned out that the result of the KEQAS had significant differences depending on the laboratories with or without KLAP.8 However, it is unknown yet the effects of test standardization caused by the KLAP and KEQAS, so this study is intended to quantify and compare the effect of the two laboratory standardization programs on the prevalence of diabetes mellitus (DM) and impaired fasting glucose (IFG).
Although the KLAP and KEQAS do not directly assess the ‘standardization’ level, they aim to pursue the standardization of laboratories through quality assurance. Therefore, the degree of participation in these programs was used as the index of standardization level of each laboratory.
To determine disease prevalence, we used data from the Korea National Health and Nutrition Examination Survey (KNHANES), which is a population-based cross-sectional survey designed to assess the health-related behavior, health conditions, and nutritional status of Koreans.9
METHODS
Study subjects and protocol
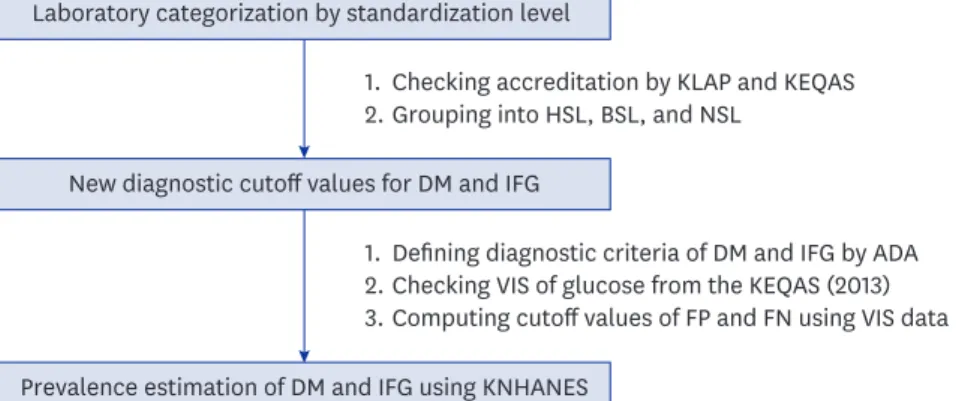
This study used data obtained from the KEQAS and/or KLAP in 2013. The study protocol involved three steps (Fig. 1): As a first step, all participants in the KLAP and/or KEQAS were categorized into three laboratory subgroups of standardization levels as follows;
highly-standardized laboratory (HSL) with both KLAP and KEQAS accreditation; basically- standardized laboratory (BSL) with only KEQAS accreditation; and non-standardized laboratory (NSL) without any accreditation from either program. Next, new diagnostic cutoff values for DM and IFG, with which FP and FN values we obtained, were calculated for each laboratory subgroup using the variance index score (VIS) data on glucose level in the KEQAS. The VIS developed by United Kingdom National External Quality Assessment Service (UK NEQAS) in 1973 was considered as important because it removed the variability of standard deviation and it allowed comparison of performance between samples of different concentration and comparison between analytes by standardizing the error calculation.10 Thus, the VIS gives a simple but reliable indication of laboratory performance that has proved robust over many years of use.11 Lastly, we estimated the prevalence of DM and IFG using the new cutoff values, and compared their differences among laboratory subgroups. To estimate disease prevalence in Korea, we used data from the KNHANES (2013).
Diagnostic glucose cutoff values for DM and IFG
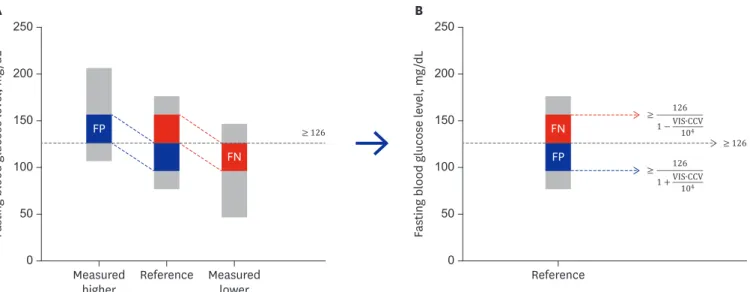
Reference cutoff values for DM and IFG in adults aged over 30 were defined as fasting blood glucose levels equal to or greater than 126 mg/dL and 100–125 mg/dL, respectively, in accordance with the guidelines of the American Diabetes Association (ADA).12 We hypothesized that the cutoff values of the ADA diagnostic criteria may differ according to the standardization level of each laboratory. Therefore, new cutoff values were estimated by using VIS data on glucose levels from the KEQAS with taking into account its standardization level of the laboratories. The value of the VIS was computed as follows; VIS = [(Measured value – Reference value)/Reference value × 100]/CCV × 100, in where “measured value” was the result from each participating laboratory and chosen coefficient of variation (CCV) was the chosen coefficient of variation taken from the National External Quality Assessment Scheme in the United Kingdom (1971).13 The CCV of fasting blood glucose used in this study was defined as 7.7.13
From the database of KNHANES, the measured glucose values of the subjects who were diagnosed with DM for each of laboratory subgroups, were estimated by inverting the VIS
Laboratory categorization by standardization level
New diagnostic cutoff values for DM and IFG
Prevalence estimation of DM and IFG using KNHANES 1.
2.Checking accreditation by KLAP and KEQAS Grouping into HSL, BSL, and NSL
1.
2.
3.
Defining diagnostic criteria of DM and IFG by ADA Checking VIS of glucose from the KEQAS (2013) Computing cutoff values of FP and FN using VIS data
Fig. 1. Steps of the study protocol: 1) All participants in the KLAP and/or KEQAS were categorized into three laboratory subgroups based on their standardization level, such as HSL, BSL, and NSL; 2) New diagnostic cutoff values for DM and IFG which could provide FP and FN were calculated; and 3) The prevalence of DM and IFG were estimated using the new diagnostic cutoff values, and compared among laboratory subgroups.
DM = diabetes mellitus, IFG = impaired fasting glucose, KNHANES = Korea National Health and Nutrition Examination Survey, KLAP = Korean Laboratory Accreditation Program, KEQAS = Korean External Quality Assessment Scheme, HSL = highly-standardized laboratory, BSL = basically-standardized laboratory, NSL = non- standardized laboratory, ADA = American Diabetes Association, VIS = variance index score, FP = false positive, FN = false negative.
formula as follows; 1) Glucose (mg/dL) = Reference value × [1 + (VIS × CCV)/104] if the measured value of glucose was larger than the reference value of 126 mg/dL, and 2) Glucose (mg/dL) = Reference value × [1 − (VIS × CCV)/104] if the former was smaller than the latter.
Based on the formulae of 1) and 2), the new diagnostic cutoff values for DM were suggested as follows; 3) Cutoff value (mg/dL) = 126/[1 + (VIS × CCV)/104], with which FP results for DM would be estimated, and 4) Cutoff value (mg/dL) = 126/[1 − (VIS × CCV)/104], with which its FN results would be obtained. Similarly, to obtain FP and FN IFG diagnosis, we suggested the following criteria; 5) use a cutoff value (mg/dL) of 100/[1 + (VIS × CCV)/104] to calculate FP IFG diagnoses, while 6) that of 100/[1 − (VIS × CCV)/104] to estimate FN IFG diagnoses.
A relationship of changing diagnostic cutoff values with its induced measurement error are illustrated in Fig. 2.
In case of NSL, no VIS data was available because they did not participate in the KEQAS.
However, it was shown that there is the significant difference between the group with or without KLAP and the practice standardization is strongly associated with the accuracy of test results.8 Also, the participants in the KEQAS have achieved good performance (less than 100 VIS) in clinical chemistry tests in number up to 83.2% of all participants during 1990s after the onset of KEQAS,6 so that, in order to estimate the VIS of fasting blood glucose in NSLs, we hypothesized the following scenarios; First, the VIS of fasting blood glucose will increase linearly as standardization level decreases (HSL < BSL < NSL). Second, the VIS of NSL is higher than that of BSL and can be estimated from the difference between HSL and BSL (denoted as ΔHB). Under these assumptions; the VIS of fasting blood glucose of NSL was estimated by adding ΔHB to the median VIS of BSL. Considering that the NL represents the lowest standardized level of laboratories, as a sensitivity analysis, we also computed an addition of twice of ΔHB to the median VIS of BSL NSL. We referred the former as ‘NSL-I,’
while the latter as ‘NSL-II.’
Estimation of the prevalence of DM and IFG using data from KNHANES
Based on the suggested cutoff values for diagnostic criteria, prevalence of DM and IFG were estimated using data from the 2013 KNHANES, which were presented along with its 95%confidence intervals (CIs).
Measured lower Reference
Measured
higher Reference
0 250
50 150
≥ 126
≥ 126
200
100
0 250
50 150 200
100
Fasting blood glucose level, mg/dL Fasting blood glucose level, mg/dL
A B
FP
FP FN
FN ≥
126 1 − VIS∙CCV104
≥ 126
1 + VIS∙CCV 104
Fig. 2. Relationship between the change in diagnostic cutoff values for diabetes mellitus and its induced measurement error, regarding FP and FN.
FP = false positive, FN = false negative, VIS = variance index score, CCV = chosen coefficient of variation.
Statistical analyses
All statistical analyses were conducted using the ‘survey’ package of R software (version 3.1.3;
The R Foundation for Statistical Computing, Vienna, Austria), which incorporates a survey's complex sampling design by considering its sampling weights and strata.14 Student's t-test was used to compare the VIS for fasting blood glucose between HSL and BSL from the 2013 KEQAS data. Median VIS value was selected as a representative summary measure for our scenarios. In the sensitivity analysis, values of the first and third quartiles were also provided.
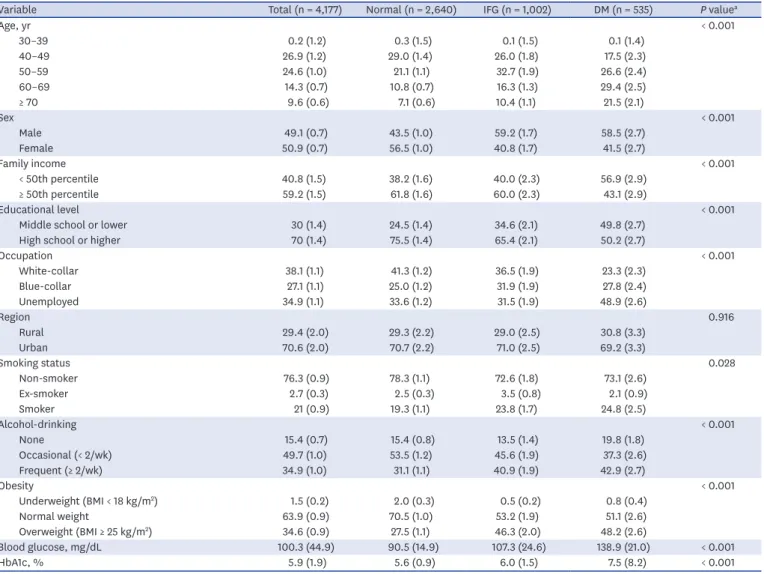
The demographic characteristics of the subjects from KNHANES were reported as weighted percentage (standard error [SE]) for categorical variables and weighted mean (SE) for continuous variables. They were compared by Rao-Scott χ2 test for categorical variables and analysis of variance for continuous variables.
Ethics statement
The KNHANES was approved by the Institutional Review Board of Centers for Disease Control and Prevention in Korea (IRB No. 2013-07CON-03-4C), but using the open data of the survey does not necessarily require review of the study protocol.
RESULTS
Laboratory categorization by standardization level
According to the accreditation by the KLAP and/or KEQAS in 2013, a total of 1,242 laboratories were classified into HSL (21%, 261/1,242) and BSL (79%, 981/1,242). The distribution of the VIS of fasting blood glucose for HSL and BSL is given in Table 1. The HSL showed significantly lower mean and median VIS values for glucose level than the BSL (P < 0.001).
Diagnostic glucose cutoff values for DM and IFG by laboratory subgroup
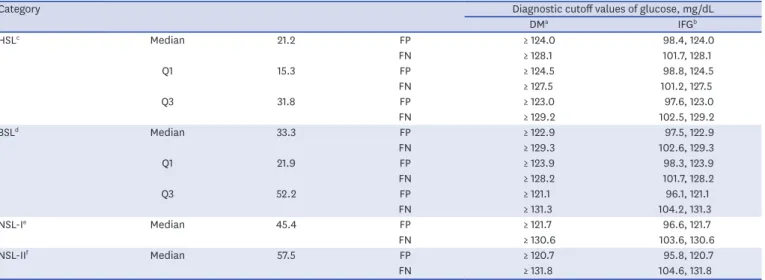
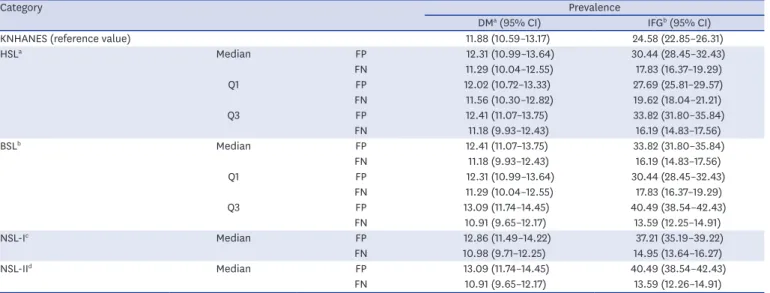
The cutoff values of diagnostic criteria for DM and IFG estimated based on the FP and FN scenarios are presented in Table 2. We note that these values go further apart from the reference value (126 mg/dL for DM and 100–125 mg/dL for IFG) as the laboratory standardization level decreases.Estimated prevalence of DM and IFG using data from KNHANES
The demographic characteristics of the subjects used in the analysis from the KNHANES are summarized in Table 3 and the estimated prevalence of DM and IFG are in Table 4. When the new diagnostic cutoff values for DM associated with the FP rate were used, the prevalence was overestimated compared to the reference value obtained from the KNHANES data. The estimated prevalence of both NSL-I and NSL-II showed the largest difference. Compared to the prevalence of DM of 11.88% (95% CI, 10.59%–13.17%) in the KNHANES data as a reference value, the estimated prevalence of DM was 12.31% (95% CI, 10.99%–13.64%) in
Table 1. VIS of glucose according to laboratory standardization levels
VIS of blood glucose HSLb (na = 261) BSLc (na = 981) P value
Mean ± SD 26.7 ± 18.1 43.7 ± 34.7 < 0.001
Median (IQR) 21.2 (15.3–31.8) 33.3 (21.9–52.2) -
P value by Student's t-test.
VIS = variance index score, HSL = highly-standardized laboratory, BSL = basically-standardized laboratory, SD = standard deviation, IQR = interquartile range, KLAP = Korean Laboratory Accreditation Program, KEQAS = Korean External Quality Assessment Scheme.
aNumber of laboratories; bLaboratories received both KLAP and KEQAS accreditations in 2013; cLaboratories received KEQAS accreditation only in 2013.
HSL, 12.41% (95% CI, 11.07%–13.75%) in BSL, and 12.86% (95% CI, 11.49%–14.22%) and 13.09% (95% CI, 11.74%–14.45%) in NSL-I and NSL-II, respectively (Fig. 3). The estimated prevalence of IFG showed more severe deviation than DM. They were 30.44% (28.45%–
32.43%) in HSL, 33.82% (31.80%–35.84%) in BSL, 37.21% (95% CI, 35.19%–39.22%) in NSL-I, and 40.49% (38.54%–42.43%) in NSL-II compared to the reference value of 24.58%
(95% CI, 22.85%–26.31%) with the KNHANES data.
As sensitivity analyses, we estimated prevalence of DM and IFG after categorizing individuals who responded to KNHANES into five age groups, namely, 30's, 40's, 50's, 60's, and over 70's. The estimated prevalence showed systematic FP and FN biases across all of the groups.
Specifically, when the new diagnostic cutoff values for DM and IFG associated with FN results were used, the prevalence of DM and IFG underestimated reference values, and, further, the amount of underestimation was getting severe as the laboratory standardization level became lower. Similar systematic biases were also observed for the FP (Supplementary Table 1).
DISCUSSION
This study analyzed the KNHANES data assuming a systematic bias of glucose testing. The prevalence of DM was overestimated using the FP cutoff value and underestimated using the FN cutoff value. The prevalence of DM showed a difference of about 2%, from 10.91% to 13.09%, but the prevalence of IFG showed a larger difference of about 27%, from 13.59% to 40.49%. Although this study was based on a virtual scenario, it is a first attempt to present data showing that standardization may influence data on national prevalence.
Table 2. Assumptions based on the virtual scenario for the diagnosis of DM and IFG
Category Diagnostic cutoff values of glucose, mg/dL
DMa IFGb
HSLc Median 21.2 FP ≥ 124.0 98.4, 124.0
FN ≥ 128.1 101.7, 128.1
Q1 15.3 FP ≥ 124.5 98.8, 124.5
FN ≥ 127.5 101.2, 127.5
Q3 31.8 FP ≥ 123.0 97.6, 123.0
FN ≥ 129.2 102.5, 129.2
BSLd Median 33.3 FP ≥ 122.9 97.5, 122.9
FN ≥ 129.3 102.6, 129.3
Q1 21.9 FP ≥ 123.9 98.3, 123.9
FN ≥ 128.2 101.7, 128.2
Q3 52.2 FP ≥ 121.1 96.1, 121.1
FN ≥ 131.3 104.2, 131.3
NSL-Ie Median 45.4 FP ≥ 121.7 96.6, 121.7
FN ≥ 130.6 103.6, 130.6
NSL-IIf Median 57.5 FP ≥ 120.7 95.8, 120.7
FN ≥ 131.8 104.6, 131.8
The reference cutoff values for DM and IFG in adults were 126 mg/dL and 100–125 mg/dL, respectively, as defined by the American Diabetes Association.11 DM = diabetes mellitus, IFG = impaired fasting glucose, HSL = highly-standardized laboratory, BSL = basically-standardized laboratory, NSL = non-standardized laboratory, Q1 = 1st quartile, Q3 = 3rd quartile, FP = false positive, FN = false negative, VIS = variance index score, CCV = chosen coefficient of variation, KLAP = Korean Laboratory Accreditation Program, KEQAS = Korean External Quality Assessment Scheme.
aThe diagnostic cutoff values for DM as follows; cutoff value (mg/dL) = 126/[1 + (VIS × CCV)/104], which can produce FP results, and cutoff value (mg/dL) = 126/[1 − (VIS × CCV)/104], which can produce FN results; bThe diagnostic cutoff values for IFG as follows; cutoff value (mg/dL), whose range is from 100/[1 + (VIS × CCV)/104] to 126/[1 + (VIS × CCV)104], which can produce FP results, and cutoff value (mg/dL), whose range is from 100/[1 − (VIS × CCV)/104] to 126/[1 − (VIS × CCV)/104], which can produce FN results; cLaboratories received both KLAP and KEQAS accreditations in 2013; dLaboratories received KEQAS accreditation only in 2013; eLaboratories received neither KLAP nor KEQAS accreditation (one difference in VIS between HSL and BSL); fLaboratories received neither KLAP nor KEQAS accreditation (two differences in VIS between HSL and BSL).
As society is aging and the prevalence of chronic disease is on the rise, the importance of national physical examination is magnified and an interest in individual health is increasing. This may grow the demands for diagnostic tests and increase the number of laboratories. If a disease is detected early or prevented with the aid of accurate test results, it could not only save on medical costs but also improve the quality of individual and national health. Recent studies estimated that the US health care system paid $66–199 million per year for tests that yielded wrong results due to calibration errors.15 Another study reported that the standardization program for creatinine measurement decreased the average total error from 23.9% to 9.7% and the average analytical bias from 16.5% to 2.7%. This can reduce the FP rate for stage 3 chronic kidney disease by 84%.16 Accurate and reliable test results can be useful in reducing economic cost as well as in the management, prognosis, and monitoring of disease.17 Also, health indicators, such as prevalence and incidence of certain diseases based on test results, create an important basis when establishing national policy.
Table 3. Demographic characteristics of the subjects from KNHANES for Korean individuals over the age of 30
Variable Total (n = 4,177) Normal (n = 2,640) IFG (n = 1,002) DM (n = 535) P valuea
Age, yr < 0.001
30–39 0.2 (1.2) 0.3 (1.5) 0.1 (1.5) 0.1 (1.4)
40–49 26.9 (1.2) 29.0 (1.4) 26.0 (1.8) 17.5 (2.3)
50–59 24.6 (1.0) 21.1 (1.1) 32.7 (1.9) 26.6 (2.4)
60–69 14.3 (0.7) 10.8 (0.7) 16.3 (1.3) 29.4 (2.5)
≥ 70 9.6 (0.6) 7.1 (0.6) 10.4 (1.1) 21.5 (2.1)
Sex < 0.001
Male 49.1 (0.7) 43.5 (1.0) 59.2 (1.7) 58.5 (2.7)
Female 50.9 (0.7) 56.5 (1.0) 40.8 (1.7) 41.5 (2.7)
Family income < 0.001
< 50th percentile 40.8 (1.5) 38.2 (1.6) 40.0 (2.3) 56.9 (2.9)
≥ 50th percentile 59.2 (1.5) 61.8 (1.6) 60.0 (2.3) 43.1 (2.9)
Educational level < 0.001
Middle school or lower 30 (1.4) 24.5 (1.4) 34.6 (2.1) 49.8 (2.7)
High school or higher 70 (1.4) 75.5 (1.4) 65.4 (2.1) 50.2 (2.7)
Occupation < 0.001
White-collar 38.1 (1.1) 41.3 (1.2) 36.5 (1.9) 23.3 (2.3)
Blue-collar 27.1 (1.1) 25.0 (1.2) 31.9 (1.9) 27.8 (2.4)
Unemployed 34.9 (1.1) 33.6 (1.2) 31.5 (1.9) 48.9 (2.6)
Region 0.916
Rural 29.4 (2.0) 29.3 (2.2) 29.0 (2.5) 30.8 (3.3)
Urban 70.6 (2.0) 70.7 (2.2) 71.0 (2.5) 69.2 (3.3)
Smoking status 0.028
Non-smoker 76.3 (0.9) 78.3 (1.1) 72.6 (1.8) 73.1 (2.6)
Ex-smoker 2.7 (0.3) 2.5 (0.3) 3.5 (0.8) 2.1 (0.9)
Smoker 21 (0.9) 19.3 (1.1) 23.8 (1.7) 24.8 (2.5)
Alcohol-drinking < 0.001
None 15.4 (0.7) 15.4 (0.8) 13.5 (1.4) 19.8 (1.8)
Occasional (< 2/wk) 49.7 (1.0) 53.5 (1.2) 45.6 (1.9) 37.3 (2.6)
Frequent (≥ 2/wk) 34.9 (1.0) 31.1 (1.1) 40.9 (1.9) 42.9 (2.7)
Obesity < 0.001
Underweight (BMI < 18 kg/m2) 1.5 (0.2) 2.0 (0.3) 0.5 (0.2) 0.8 (0.4)
Normal weight 63.9 (0.9) 70.5 (1.0) 53.2 (1.9) 51.1 (2.6)
Overweight (BMI ≥ 25 kg/m2) 34.6 (0.9) 27.5 (1.1) 46.3 (2.0) 48.2 (2.6)
Blood glucose, mg/dL 100.3 (44.9) 90.5 (14.9) 107.3 (24.6) 138.9 (21.0) < 0.001
HbA1c, % 5.9 (1.9) 5.6 (0.9) 6.0 (1.5) 7.5 (8.2) < 0.001
Data were reported as weighted percentage (SE) for categorical variables and mean (SE) for continuous variables.
DM = diabetes mellitus, IFG = impaired fasting glucose, KNHANES = Korea National Health and Nutrition Examination Survey, BMI = body mass index, SE = standard error.
aP values were calculated by Rao-Scott χ2 test for categorical variables and analysis of variance for continuous variables.
Based on the results concerning prevalence in this study, the cost-effectiveness of DM screening was analyzed by applying a Markov model.18 The results showed that HSLs were superior not only in terms of cost reduction but also in increased quality-adjusted life years (QALYs), and this effect tended to be greater in older age groups. Compared to NSLs, HSLs showed lifetime cost savings of about 13,000 won per person and an increase in QALY of 0.0012 for those in their 30's, about 54,900 won and 0.005 QALY, respectively, for those in their 40's, about 213,000 won and 0.02 QALY, respectively, for those in their 50's, and about 167,000 won and 0.02 QALY, respectively, for those in their 60's.
Table 4. Estimated prevalence of DM and IFG for Korean individuals over the age of 30
Category Prevalence
DMa (95% CI) IFGb (95% CI)
KNHANES (reference value) 11.88 (10.59–13.17) 24.58 (22.85–26.31)
HSLa Median FP 12.31 (10.99–13.64) 30.44 (28.45–32.43)
FN 11.29 (10.04–12.55) 17.83 (16.37–19.29)
Q1 FP 12.02 (10.72–13.33) 27.69 (25.81–29.57)
FN 11.56 (10.30–12.82) 19.62 (18.04–21.21)
Q3 FP 12.41 (11.07–13.75) 33.82 (31.80–35.84)
FN 11.18 (9.93–12.43) 16.19 (14.83–17.56)
BSLb Median FP 12.41 (11.07–13.75) 33.82 (31.80–35.84)
FN 11.18 (9.93–12.43) 16.19 (14.83–17.56)
Q1 FP 12.31 (10.99–13.64) 30.44 (28.45–32.43)
FN 11.29 (10.04–12.55) 17.83 (16.37–19.29)
Q3 FP 13.09 (11.74–14.45) 40.49 (38.54–42.43)
FN 10.91 (9.65–12.17) 13.59 (12.25–14.91)
NSL-Ic Median FP 12.86 (11.49–14.22) 37.21 (35.19–39.22)
FN 10.98 (9.71–12.25) 14.95 (13.64–16.27)
NSL-IId Median FP 13.09 (11.74–14.45) 40.49 (38.54–42.43)
FN 10.91 (9.65–12.17) 13.59 (12.26–14.91)
CI = confidence interval, HSL = highly-standardized laboratory, BSL = basically-standardized laboratory, NSL = non-standardized laboratory, DM = diabetes mellitus, IFG = impaired fasting glucose, Q1 = 1st quartile, Q3 = 3rd quartile, FP = false positive, FN = false negative, KNHANES = Korea National Health and Nutrition Examination Survey, VIS = variance index score, KLAP = Korean Laboratory Accreditation Program, KEQAS = Korean External Quality Assessment Scheme.
aLaboratories received both KLAP and KEQAS accreditations; bLaboratories received KEQAS accreditation only; cLaboratories received neither KLAP nor KEQAS accreditation (one difference in VIS between HSL and BSL); dLaboratories received neither KLAP nor KEQAS accreditation (two differences in VIS between HSL and BSL).
NSL-I NSL-II
In KNHANES
In KNHANES
BSL
HSL HSL BSL NSL-I NSL-II
0 20
16
12
4 8 18
14
10
2 evalPrence of DM, % 6
0 45
35 40
30 25
5 15 20
Prevalence of IFG, % 10
A B
Assuming FP Assuming FN
Assuming FP Assuming FN
Fig. 3. Estimated prevalence of DM and IFG according to the standardized level assuming false positivity and false negativity. Each point and its vertical bar represents average prevalence and its 95% confidence interval. The dashed line indicates the prevalence in the KNHANES dataset, which is considered the reference value. Estimated prevalence of (A) DM and (B) IFG according to laboratory standardization level.
DM = diabetes mellitus, IFG = impaired fasting glucose, KNHANES = Korea National Health and Nutrition Examination Survey, FP = false positive, FN = false negative, HSL = highly-standardized laboratory, BSL = basically-standardized laboratory, NSL = non-standardized laboratory.
This study has some limitations. It included only one diagnostic test for DM screening, however, the standardization of diagnostic tests affects a wide range of areas, including practically all medical practices and clinical diseases, so cannot be limited to a specific disease or test. In addition, the values for NSLs in the virtual scenario could not be validated because the true VIS of NSLs was not obtainable. To make up for uncertainty of the virtual scenario, sensitivity analyses for the values of the first and third quartiles and various age groups were performed in the present study.
Taken together, standardization affects matters of national importance, such as the prevalence of disease, economic costs, and further more health-related policies. It is necessary to manage the standardization of laboratories on the national level, and to introduce a system for quality assurance that will improve the accuracy of tests and the quality of national health.
SUPPLEMENTARY MATERIAL
Supplementary Table 1
Estimated prevalence of diabetes mellitus and impaired fasting glucose for Korean individuals according to the age group
Click here to view
REFERENCES
1. Farr JM, Shatkin L. Best Jobs for the 21st Century. Indianapolis, IN: JIST Works; 2009.
2. Forsman RW. Why is the laboratory an afterthought for managed care organizations? Clin Chem 1996;42(5):813-6.
PUBMED
3. Nkengasong JN, Nsubuga P, Nwanyanwu O, Gershy-Damet GM, Roscigno G, Bulterys M, et al. Laboratory systems and services are critical in global health: time to end the neglect? Am J Clin Pathol 2010;134(3):368-73.
PUBMED | CROSSREF
4. Hamza A, Ahmed-Abakur E, Abugroun E, Bakhit S, Holi M. Cost effectiveness of adopted quality requirements in hospital laboratories. Iran J Public Health 2013;42(6):552-8.
PUBMED
5. Hoerger TJ, Wittenborn JS, Young W. A cost-benefit analysis of lipid standardization in the United States.
Prev Chronic Dis 2011;8(6):A136.
PUBMED
6. Cho HI. Twenty-years of experiences in external quality assurance in Korea. Southeast Asian J Trop Med Public Health 1999;30 Suppl 3:32-8.
PUBMED
7. Shin BM, Chae SL, Min WK, Lee WG, Lim YA, Lee DH, et al. The implementation and effects of a clinical laboratory accreditation program in Korea from 1999 to 2006. Korean J Lab Med 2009;29(2):163-70.
PUBMED | CROSSREF
8. Jang MA, Yoon YA, Song J, Kim JH, Min WK, Lee JS, et al. Effect of accreditation on accuracy of diagnostic tests in medical laboratories. Ann Lab Med 2017;37(3):213-22.
PUBMED | CROSSREF
9. Kweon S, Kim Y, Jang MJ, Kim Y, Kim K, Choi S, et al. Data resource profile: the Korea National Health and Nutrition Examination Survey (KNHANES). Int J Epidemiol 2014;43(1):69-77.
PUBMED | CROSSREF
10. Hirst AD. External quality assurance. Ann Clin Biochem 1998;35(Pt 1):12-8.
PUBMED | CROSSREF
11. Fifield R. Diagnostic allergy laboratory external proficiency testing in Europe. Methods 1997;13(1):33-42.
PUBMED | CROSSREF
12. American Diabetes Association. Diagnosis and classification of diabetes mellitus. Diabetes Care 2010;33 Suppl 1:S62-9.
PUBMED | CROSSREF
13. Whitehead TP, Woodford FP. External quality assessment of clinical laboratories in the United Kingdom. J Clin Pathol 1981;34(9):947-57.
PUBMED | CROSSREF
14. Lumley T. Analysis of complex survey samples. J Stat Softw 2004;9(8):1-19.
CROSSREF
15. Downer K. How much does test calibration error cost? NIST report suggests $60–$199M for calcium testing alone. Clin Lab News 2004;30(4):1, 8-9.
16. Komenda P, Beaulieu M, Seccombe D, Levin A. Regional implementation of creatinine measurement standardization. J Am Soc Nephrol 2008;19(1):164-9.
PUBMED | CROSSREF
17. Zaninotto M, Mion MM, Altinier S, Varagnolo M, Venturini R, Plebani M. Performance characteristics of laboratory testing and clinical outcomes. Clin Chim Acta 2009;404(1):41-5.
PUBMED | CROSSREF
18. Briggs A, Sculpher M. An introduction to Markov modelling for economic evaluation. Pharmacoeconomics 1998;13(4):397-409.
PUBMED | CROSSREF