A U-shaped Association between Body Mass Index and
Psychological Distress on the Multiphasic Personality Inventory:
Retrospective Cross-sectional Analysis of 19-year-old Men in Korea
Objective personality tests, such as the Minnesota Multiphasic Personality Inventory (MMPI), might be more sensitive to reflect subclinical personality and be more state- dependent in an individual’s lifetime, so they are good scales to predict the psychological distress regarding certain states. The aim of this study was to identify the specific pattern between body mass index (BMI) and psychological distress using the objective personality test. For this study, we investigated BMI and the Korean Military Multiphasic Personality Inventory (MPI). A retrospective cross-sectional study was conducted with 19-yr-old examinees who were admitted to the Military Manpower Administration in Korea from February 2007 to January 2010. Of 1,088,107 examinees, we enrolled 771,408 subjects who were psychologically apparent healthy possible-military-service groups. Afterwards, we reviewed and analyzed directly measured BMI and MPI results. In terms of the validity scales, the faking-good subscale showed an inverted U-shaped association, and faking- bad and infrequency subscales showed a U-shaped association with BMI groups. In terms of the neurosis scales, all clinical subscales (anxiety, depression, somatization, and personality disorder) also showed a U-shaped association with BMI groups. For the psychopath scales, the schizophrenia subscale showed a U-shaped association, and the paranoia subscale showed a near-positive correlation with BMI. In conclusion, a specific U-shaped pattern was observed between BMI and the MPI in 19-yr-old men in Korea.
Underweight and obesity are related to psychological distress, so supportive advice and education are needed to them.
Keywords: Body Mass Index; MMPI; U-shaped Association; Psychological Distress Taehyun Kim,1,2 Jung Jun Kim,1,3
Mi Yeon Kim,1 Shin Kyoung Kim,4 Sungwon Roh,5 and Jeong Seok Seo6,7
1Incheon-Gyeonggi Regional Military Manpower Administration, Suwon; 2Department of
Neuropsychiatry, Seoul National University Bundang Hospital, Seongnam; 3Department of Urology, Samsung Medical Center, Sungkyunkwan University School of Medicine, Seoul; 4Department of Rehabilitation Medicine, Konkuk University Chungju Hospital, Chungju; 5Department of Mental Health Research, Seoul National University Hospital, Seoul;
6Department of Psychiatry, Konkuk University Chungju Hospital, Chungju; 7Department of Psychiatry, School of Medicine, Konkuk University, Seoul, Korea
Received: 10 October 2014 Accepted: 23 January 2015 Address for Correspondence:
Jeong Seok Seo, MD
Department of Psychiatry, Konkuk University Chungju Hospital, 82 Gugwon-daero, Chungju 380-704, Korea
Tel: +82.43-840-8470, Fax: +82.43-845-8470 E-mail: [email protected]
http://dx.doi.org/10.3346/jkms.2015.30.6.793 • J Korean Med Sci 2015; 30: 793-801
INTRODUCTION
Obesity significantly increases the risk of chronic diseases such as cardiovascular disease (CVD), type 2 diabetes mellitus, coro- nary heart disease, osteo-arthritis, and certain cancers (1). Be- ing underweight is also associated with greater mortality from non-cancer and non-CVD causes (2).
Over the past few decades, many studies have been conduct- ed regarding the relationship between body mass index (BMI) and mental health, but the results have been inconsistent. Some studies have reported that increased BMI is associated with poor mental health, such as depression, anxiety disorders, and schizo- phrenia (3-7). Others have reported that being overweight is as- sociated with a lower risk of depression or a reduction in de- pressive symptoms, known as the “jolly fat” hypothesis (8-11).
However, there are few studies on lower BMI groups; especially those who are underweight. According to one prospective co- hort study, BMI is inversely associated with suicide because a low BMI is likely to act as a marker for other factors that may be
relevant to understanding the etiology of suicide (12). Currently some studies have reported that the relationship between BMI and mental health has shown a U-shaped association (13-16).
Objective personality tests, such as the Personality Assess- ment Inventory (PAI), Temperament and Character Inventory (TCI), and California Personality Inventory (CPI), are useful screening tools for the assessment of personality structure and psychopathology. The Minnesota Multiphasic Personality In- ventory (MMPI) among them is the most widely used test (17, 18). Objective personality tests, such as the MMPI, might be more sensitive to subclinical personality and more state-de- pendent in an individual’s lifetime (17, 19, 20), so they are good scales to predict the psychological distress regarding certain states. Accordingly, the aim of this study was to identify the spe- cific pattern between BMI and psychological distress using an objective personality test. For this study, we investigated BMI and the Korean Military Multiphasic Personality Inventory (MPI) in 19-yr-old men who were psychologically apparent healthy military-service-candidate groups.
MATERIALS AND METHODS Data source
In Korea, a conscription system has been adopted, wherein all men 19 yr old and over have military duty. Before joining the army, all men undergo evaluations of physical and psychologi- cal status by clinicians from all departments of the Military Man- power Administration (MMA). These include radiographs (chest X-ray: CT and MRI when necessary), chemical and physical ex- amination of general medical conditions (GMC), and a psychi- atric evaluation including completion of the Korean Military MPI. If examinees submit any hospital records, the correspond- ing clinicians review and certify the medical records. Although they are completed the evaluation on their states, they are not yet soldiers but still general civilian population. They can freely select the time joining the army until their mid-30s. We retro- spectively surveyed 19-yr-old examinees who were admitted to all regional MMAs from February 2007 to January 2010. To pro- tect personal information, all personal identification numbers were replaced with numbers that ensured anonymity of data.
Study design and sample
We conducted a retrospective cross-sectional study to investi- gate the relationship between BMI and the MPI. In the Korean conscription system, all subjects are stratified among seven gra- des based on physical and psychological health states. Then, they are classified into four categories: a possible-military-ser- vice group (grades 1-3), possible-public-service group (grade 4), exemption-from-military-service group (grades 5-6), and reex- amine group within a certain period of time (grade 7). Those in grades 1-2 have no health problems, while those in grade 3 have mild social, occupational, or other functional impairments. Thus, grade 1-3 groups are classified as possibly suitable for military service. Respectively, grade 4 and grades 5-6 groups have mod- erate and severe functional impairments, so they are classified as possibly suitable for public service and exempt from military service. Those in grade 7 group were reserved for further evalu- ation because there was not enough information about present functioning. The functional evaluations were conducted by cli- nicians from all departments of the MMA in accordance with the Korean National Defense Law.
Of 1,088,107 19-yr-old examinees tested from February 2007 to January 2010, there were 782,602 placed in grades 1-3, and 305,748 categorized in grades 4-7. Given that our purpose was to examine the relationship between BMI and the MPI in psy- chologically apparent healthy possible-military-service groups, we enrolled the grade 1-3 groups who were possibly suitable for military service. Of the 782,602 possible-military-service group cases, 1,533 were missing and 9,418 did not have reliable results for the MPI. Furthermore, because it is possible that the rela- tionship between BMI and the MPI could be complicated by
the presence of psychiatric problems, we enrolled examinees without any apparent psychological problems (grade 1 psychi- atric domain). Therefore, we finally collected and analyzed data for 771,408 examinees.
Body mass index
BMI was calculated as weight (in kilograms) divided by height (in meters) squared, and was directly measured using the same type of equipment used in the MMA. BMI categorization was completed according to the WHO International Classification system that defines the following categories: underweight (< 18.5 kg/m2), normal weight (18.5-24.9 kg/m2), overweight (25-29.9 kg/m2), class I obese (30-34.9 kg/m2), class II obese (35-39.9 kg/
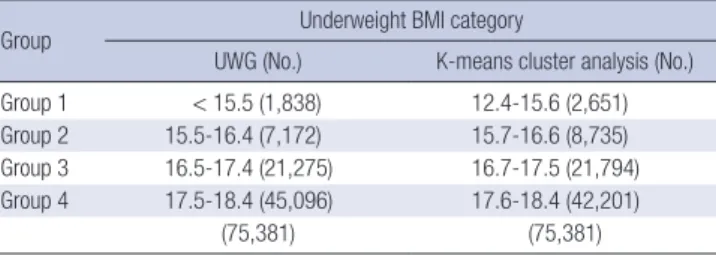
m2), and class III obese (> 40 kg/m2) (21). To test our hypothe- sis, however, the underweight group was divided into the fol- lowing categories: underweight group 1 (UWG1: < 15.5 kg/m2), group 2 (UWG2: 15.5-16.4 kg/m2), group 3 (UWG3: 16.5-17.4 kg/m2), and group 4 (UWG4: 17.5-18.4 kg/m2). Then, to identify the distributional tendency of the underweight group, we car- ried out K-means cluster analysis; Table 1 shows the results. Our underweight group classification is similar to the results of the cluster analysis.
Korean Military Multiphasic Personality Inventory The MPI has been developed for use in Korean conscription and has the same scoring system as the MMPI. The purpose of the MPI is to distinguish between psychologically healthy and unhealthy subjects, as well as to provide early screening for psy- chiatric disorders and criminal behavior. The MPI consists of validity scales (faking-good, faking-bad, and infrequency), neu- rosis scales (anxiety, depression, somatization, and personality disorder), psychopath scales (schizophrenia and paranoia), and specific content scales (criminal and military-related scales) (22, 23). Of these, we collected data for, and analyzed, the valid- ity, neurosis, and psychopath scales.
The MPI consists of 5-steps. First, several questions were cre- ated and military related questions were added. Second, a pre- test (1,285 questions) was then administered to 1,283 normal soldiers, 352 normal university students, 211 military prisoners, and 388 psychiatric patients in army hospitals. Third, 362 ques-
Table 1. Results of the K-means cluster analysis in the underweight category (BMI <
18.5)
Group Underweight BMI category
UWG (No.) K-means cluster analysis (No.) Group 1 < 15.5 (1,838) 12.4-15.6 (2,651) Group 2 15.5-16.4 (7,172) 15.7-16.6 (8,735) Group 3 16.5-17.4 (21,275) 16.7-17.5 (21,794) Group 4 17.5-18.4 (45,096) 17.6-18.4 (42,201)
(75,381) (75,381)
UWG, underweight group.
tions were selected and three scales (validity, clinical, and con- tent scales) were established. Then, the 362 questions were ad- ministered to 3,524 normal soldiers, 2,115 new recruits, 489 pris- oners, 215 psychiatric patients in army hospitals, 192 civilian prisoners, and 151 psychiatric patients in general hospitals. Fi- nally, score standardization was performed (22-24). Thus, the test is an objective personality test similar to the MMPI. The test- retest reliability and Cronbach’s alpha of the MPI range from 0.61-0.83 and 0.58-0.80 for the scales, and the discrimination rate of the MPI is 80% (25).
Statistical analysis
We controlled for age, sex, and race-ethnicity; however, there were still some confounding factors in the multivariate analysis.
These factors included education (high school or less, college or more), socioeconomic status (SES: low, low-middle, middle, middle-high, high), and parents relationship (none, father only, mother only, both).
Data were analyzed using STATA 13.0 (Stata Corp., College Station, TX, USA). Differences in the characteristics of examin- ees by BMI categories were analyzed using the chi-square test for categorical data (education, SES, and parents relationship).
To control for confounding factors, we set them as covariates.
Then, multivariate analysis of covariance (MANCOVA) with the post-hoc test (Bonferroni test) and locally weighted scatterplot smoothing (LOWESS) were carried out to examine the associa- tion between BMI groups and the MPI. Statistical significance was defined as P < 0.05.
Ethics statement
This study was approved by the committee of the MMA, and also the protocol was reviewed and approved by the institution- al review board of Konkuk University Chungju Hospital (IRB number: 2014-013). Informed consent was exempted by the board.
RESULTS
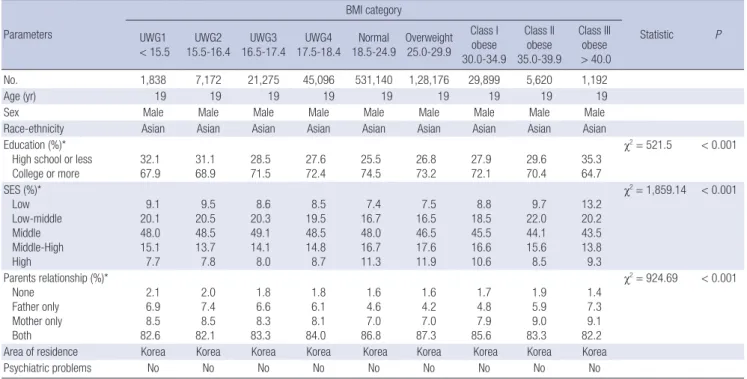
Table 2 presents the demographic data for each BMI group. All examinees were 19-yr-old men without psychiatric problems who lived in Korea. Education, SES, and parents relationship categorical variables were not independent from BMI category (chi-square = 521.5, P < 0.001; chi-square = 1859.14, P < 0.001;
chi-square = 924.69, P < 0.001).
Table 3 summarizes the MPI results for each BMI group. The overall MANCOVA for MPI results by BMI group was significant (Pillai’s Trace = 0.013, F = 143.61, P < 0.001, partial η2= 0.002).
The validity scales were significantly different between most BMI groups. The faking-good and faking-bad subscales were different for all groups except for UWG1 and UWG2. The infre- quency subscale was different for all groups except for UWG1 and UWG2, and the normal and overweight groups. The neuro- sis scales were also significantly different between most BMI groups. The anxiety and personality disorder subscales differed between groups, except for between UWG1 and UWG2, and the normal and overweight groups. The depression subscale differed for all groups except for the normal and overweight Table 2. Demographic characteristics of body mass index (BMI) groups
Parameters
BMI category
Statistic P UWG1
< 15.5 UWG2
15.5-16.4 UWG3
16.5-17.4 UWG4
17.5-18.4 Normal
18.5-24.9 Overweight 25.0-29.9
Class I obese 30.0-34.9
Class II obese 35.0-39.9
Class III obese
> 40.0
No. 1,838 7,172 21,275 45,096 531,140 1,28,176 29,899 5,620 1,192
Age (yr) 19 19 19 19 19 19 19 19 19
Sex Male Male Male Male Male Male Male Male Male
Race-ethnicity Asian Asian Asian Asian Asian Asian Asian Asian Asian
Education (%)*
High school or less
College or more 32.1
67.9 31.1
68.9 28.5
71.5 27.6
72.4 25.5
74.5 26.8
73.2 27.9
72.1 29.6
70.4 35.3 64.7
χ2= 521.5 < 0.001
SES (%)*
Low Low-middle Middle Middle-High High
9.1 20.1 48.0 15.1 7.7
9.5 20.5 48.5 13.7 7.8
8.6 20.3 49.1 14.1 8.0
8.5 19.5 48.5 14.8 8.7
7.4 16.7 48.0 16.7 11.3
7.5 16.5 46.5 17.6 11.9
8.8 18.5 45.5 16.6 10.6
9.7 22.0 44.1 15.6 8.5
13.2 20.2 43.5 13.8 9.3
χ2= 1,859.14 < 0.001
Parents relationship (%)*
None Father only Mother only Both
2.1 6.9 8.5 82.6
2.0 7.4 8.5 82.1
1.8 6.6 8.3 83.3
1.8 6.1 8.1 84.0
1.6 4.6 7.0 86.8
1.6 4.2 7.0 87.3
1.7 4.8 7.9 85.6
1.9 5.9 9.0 83.3
1.4 7.3 9.1 82.2
χ2= 924.69 < 0.001
Area of residence Korea Korea Korea Korea Korea Korea Korea Korea Korea
Psychiatric problems No No No No No No No No No
*SES, socioeconomic status, significant association with BMI category, P < 0.05. UWG, underweight group.
groups. The somatization subscale differed for all groups except for UWG1 and UWG2. The psychopath scales show different tendencies compared to the validity and neurosis scales. The schizophrenia subscale differed between groups except for be- tween UWG1 and UWG2, UWG3 and UWG4, and the class I to III obese groups. The paranoia subscale differed between groups except for UWG1 to UWG4, and class II and III obese groups. Fig.
1 shows graphically the relationship between BMI and the MPI.
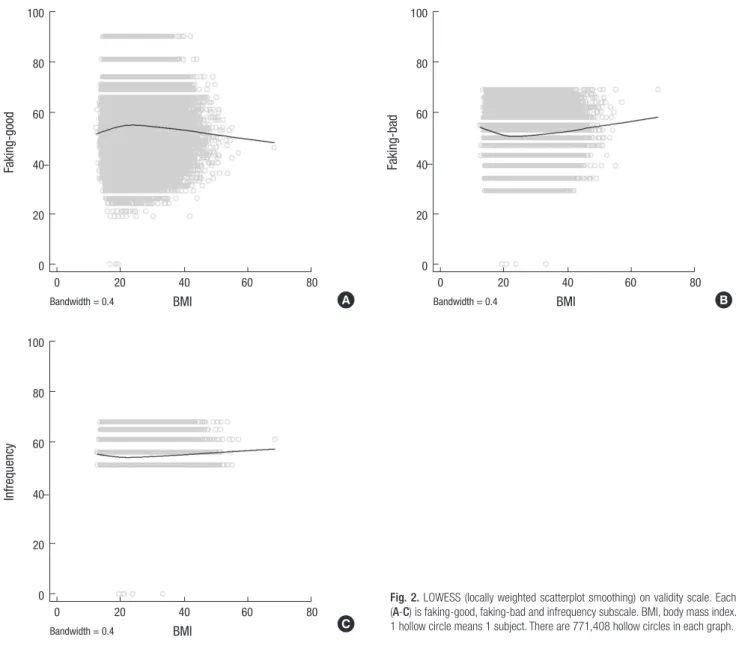
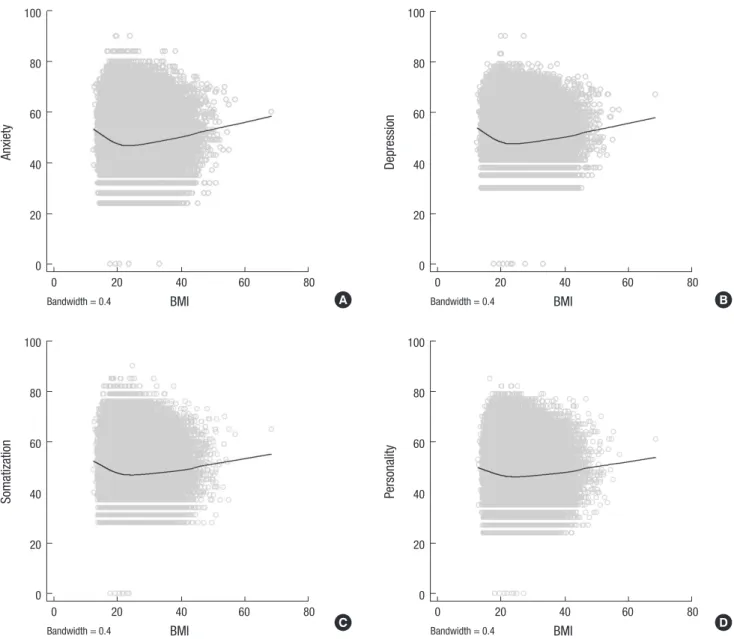
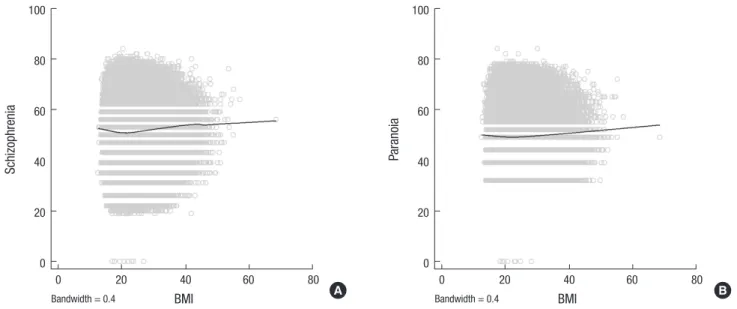
In LOWESS, specific patterns between BMI and the MPI were identified (Fig. 2-4). For the validity scales, the faking-good sub- scale tended to show an inverted U-shaped association with BMI categories, while faking-bad and infrequency subscale tend- ed to show a U-shaped association. For the neurosis scales, all subscales tended to show U-shaped associations. For the psy- chopath scales, the schizophrenia subscale tended to show a U- shaped association, while the paranoia subscale showed a near- positive correlation with BMI.
DISCUSSION
We conducted a retrospective cross-sectional study of 771,408 men to investigate the relationship between BMI and the MPI.
A U-shaped association was found between BMI and the MPI.
In our study, both underweight and obese groups tended less toward faking good, and more toward faking bad, than each nor- mal and overweight group. The infrequency subscale showed a U-shaped association with BMI categories. It means that both the underweight and obese groups tended to exaggerate their symptoms more than the normal and overweight groups. In terms of the neurosis subscales, the underweight and obese groups tended to be more anxious and depressive. They also had more somatic concerns (or symptoms) and personality disorder traits (social withdrawal or impulsivity, and aggres- sion). In terms of the psychopath scales, higher scores meant that obese groups tended to be more vigilant, sensitive, and suspicious (paranoia subscale). Both underweight and obese groups also tended to be more alienated and isolated from oth- ers and they tended to feel more mental and emotional confu- sion (schizophrenia subscale).
Our result is same as previous studies that have shown a U- shaped association between BMI and psychological distress.
Zhao et al. conducted a cross-sectional survey of 153,865 adults aged ≥ 18 yr from the 2007 Behavioral Risk Factor Surveillance System (BRFSS). BMI was calculated indirectly and psychologi- cal distress was assessed by the Kesler-6 Questionnaire. They found that underweight and obesity were associated with an increased likelihood of having severe psychological distress (SPD) (13). Martínez et al. evaluated the association between BMI and psychological distress in 563 inhabitants aged between 18 and 65 yr of Málaga (South of Spain). They found a symmet- ric U-shaped relationship between weight status and psycho-
Table 3. Results of the Korean military multiphasic personality inventory in relation to body mass index (BMI) groups (Mean ± SD, 95% CI) ScalesBMI category PPost hoc UWG1a<15.5UWG2b 15.5-16.4UWG3c 16.5-17.4UWG4d 17.5-18.4Normale 18.5-24.9Overweightf 25.0-29.9Class I obeseg 30.0-34.9Class II obeseh 35.0-39.9Class III obesei >40.0
Validity scale FG FB INF
52.47±0.22 53.71±0.21 55.30±0.10
52.42±0.12 53.76±0.11 55.18±0.05
52.97±0.07 53.00±0.07 54.99±0.03
53.33±0.05 52.71±0.05 54.85±0.02
54.12±0.03 51.86±0.03 54.63±0.02
54.16±0.04 51.85±0.04 54.77±0.02
53.72±0.06 52.36±0.06 55.07±0.03
53.10±0.13 53.09±0.12 55.41±0.06
52.31±0.28 54.16±0.26 55.64±0.13
<0.001 <0.001 <0.001
a=b>c>d>e e=f<g<h<i a=b>c>d>e e=f<g<h<i a=b>c>d>e e<f<g<h<i
Neurosis scale AX DEP SOM PD
51.75±0.22 52.69±0.20 51.30±0.21 49.33±0.22
51.25±0.11 52.01±0.10 51.00±0.11 49.25±0.11
50.00±0.07 50.78±0.06 49.93±0.07 48.58±0.07
49.27±0.05 50.10±0.05 49.35±0.05 48.25±0.05
47.76±0.03 48.73±0.03 48.08±0.03 47.38±0.03
47.72±0.04 48.58±0.04 47.71±0.04 47.17±0.04
48.60±0.06 49.17±0.06 48.10±0.06 47.63±0.06
49.71±0.13 50.15±0.12 48.90±0.12 48.50±0.13
50.96±0.27 51.49±0.25 50.01±0.26 49.36±0.27
<0.001 <0.001 <0.001 <0.001
a=b>c>d>e e=f<g<h<i a>b>c>d>e e=f<g<h<i a=b>c>d>e e<f<g<h<i a=b>c>d>e e=f<g<h<i
Psychopath scale SCZ PA
53.00±0.22 50.19±0.21
52.64±0.11 50.38±0.11
52.15±0.07 50.09±0.07
52.00±0.05 50.11±0.05
51.84±0.03 49.94±0.03
52.79±0.04 50.19±0.04
53.52±0.06 50.49±0.06
53.79±0.13 50.96±0.12
53.90±0.27 51.33±0.26
<0.001 <0.001
a=b>c=d>e e<f<g=h=i a=b=c=d>e e<f<g<h=i
SD, Standard Deviation; CI, Confidence Intervals; UWG, underweight group; FG, faking good; FB, faking bad; INF, infrequency; AX, anxiety; DEP, depression; SOM, somatization; PD, personality disorder; SCZ, schizophrenia; PA, paranoia.
Fig. 1. Means of the Korean military multiphasic personality inventory scales by BMI groups. (A) is validity scale. (B) and (C) are neurosis scale. (D) is psychopath scale. Under- weight group BMI ranges (1-4) are <15.5, 15.5-16.4, 16.5-17.4, and 17.5-18.4. N, normal; OW, overweight; FG, faking good; FB, faking bad; INF, infrequency; AX, anxiety;
DEP, depression; SOM, somatization; PD, personality disorder; SCZ, schizophrenia; PA, paranoia.
Mean
Underweight group Obesity class
BMI
1 2 3 4 N OW I II III 57
56 55 54 53 52 51 50 49 48
FG FB INF
Mean
Underweight group Obesity class
BMI
1 2 3 4 N OW I II III 53
52 51 50 49 48 47 46 45 44
SOM PD
Mean
Underweight group Obesity class
BMI
1 2 3 4 N OW I II III 54
53 52 51 50 49 48 47 46 45
SCZ PA
Mean
Underweight group Obesity class
BMI
1 2 3 4 N OW I II III
54 53 52 51 50 49 48 47 46 45
AX DEP
A B
C D
logical distress in all the Symptoms Checklist Revised (SCL-90-R) dimensions for both men and women (14).
Additionally, some previous studies have shown that under- weight and obesity are associated with psychiatric disorders such as depression and anxiety. McCrea et al. conducted a cross-sec- tional survey of 7,043 adults. All participants were diagnosed with one of six mental disorders (depressive episodes, general- ized anxiety disorder, phobias, obsessive compulsive disorder, panic disorder, and mixed anxiety and depressive disorder) us- ing the revised Clinical Interview Schedule (CIS-R). They were categorized into six BMI groups (< 18.5, 18.5 ≤ 25, 25 ≤ 30, 30
≤ 35, 35 ≤ 40, and > 40). In young men the probability of a U- shaped relationship was higher for both underweight and obese men (15). Scott et al. categorized participants into 11 BMI groups
(< 15, 15-16.9, 17-18.49, 18.5-19.9, 20-24.9, 25-29.9, 30-34.9, 35- 39.9, 40-44.9, 45-49.9, and ≥ 50) and observed the prevalence of any mood disorder, anxiety disorder, and substance use disor- der during a 12-month period. The relationship between BMI and mood and anxiety disorders revealed a roughly U-shaped relationship with the lowest values in the BMI 25-25.9 kg/m2 group (4). de Wit et al. also categorized 43,534 participants into four BMI groups (underweight, normal, overweight, and obese) and rated depressive symptoms using the mental health inven- tory (MHI). They found a very significant U-shaped association between BMI and depression (P < 0.001) (16). Another study found that increasing BMI was related to higher risk of schizo- phrenia, although it was not a completely U-shaped association (between BMI and schizophrenia and paranoia) (6). It is nota-
Fig. 2. LOWESS (locally weighted scatterplot smoothing) on validity scale. Each (A-C) is faking-good, faking-bad and infrequency subscale. BMI, body mass index.
1 hollow circle means 1 subject. There are 771,408 hollow circles in each graph.
Fig. 2. LOWESS (locally weighted scatterplot smoothing) on validity scale. Each A-C is faking-good, faking-bad and infrequency subscale. BMI, body mass index. 1 hollow circle means 1 subject. There are 771,408 hollow circles in each graph.
A B
C
Faking-good
BMI
Bandwidth = 0.4
0 20 40 60 80
100
80
60
40
20
0
Fig. 2. LOWESS (locally weighted scatterplot smoothing) on validity scale. Each A-C is faking-good, faking-bad and infrequency subscale. BMI, body mass index. 1 hollow circle means 1 subject. There are 771,408 hollow circles in each graph.
A B
C
Infrequency
BMI
Bandwidth = 0.4
0 20 40 60 80
100
80
60
40
20
0
Fig. 2. LOWESS (locally weighted scatterplot smoothing) on validity scale. Each A-C is faking-good, faking-bad and infrequency subscale. BMI, body mass index. 1 hollow circle means 1 subject. There are 771,408 hollow circles in each graph.
A B
C
Faking-bad
BMI
Bandwidth = 0.4
0 20 40 60 80
100
80
60
40
20
0
A B
C
ble that the same tendency was observed between previous studies of clinical aspects and the current study of subclinical aspects.
The present study has some limitations. First, use of the MPI has not been widely documented or analyzed because it was developed only for military conscription. However, the MPI has been officially approved by the Korean government. The validi- ty and reliability of the MPI are also stable. Second, subjects were samples enrolled for military conscription. Therefore, the possibility of a draft-dodging tendency among subjects, and a corresponding tendency to exaggerate responses on the MPI, must be considered. Thus, we excluded high standardized T- scores (> 70) among the faking bad or infrequency subscales.
Furthermore, they are not yet soldiers but are still civilians and they can freely select the time joining the army until their mid- 30s. Third, although the statistical significance was small (η2= 0.002), it was significant. Furthermore, LOWESS showed a U-
shaped association between BMI and the MPI, so we could pre- dict the psychological impact of BMI on the MPI. Fourth, sub- jects were limited to only 19-yr old men, but the large group of over 0.75 million participants is a strength. Fifth, the present study was a retrospective cross-sectional design; therefore, it is somewhat unclear whether the U-shaped association reflected actual clinical psychopathology. Future studies should be per- formed to address these limitations.
In conclusion, specific patterns were observed between BMI and the MPI in 19-yr-old men in Korea. For the validity scales, the faking-good subscale showed an inverted U-shaped associ- ation, and others (faking-bad and infrequency) showed a U- shaped association with BMI groups. For the neurosis scales, all clinical subscales (anxiety, depression, somatization, and per- sonality disorder) also showed a U-shaped association with BMI groups. For the psychopath scales, the schizophrenia subscale showed a U-shaped association, and the paranoia subscale show-
Fig. 3. LOWESS (locally weighted scatterplot smoothing) on neurosis scale. Each (A-D) is anxiety, depression, somatization and personality disorder subscale. BMI, body mass index. 1 hollow circle means 1 subject. There are 771,408 hollow circles in each graph.
Fig. 3. LOWESS (locally weighted scatterplot smoothing) on neurosis scale. Each A-D is anxiety, depression, somatization and personality disorder subscale. BMI, body mass index. 1 hollow circle means 1 subject. There are 771,408 hollow circles in each graph.
A B
C D
Anxiety
BMI
Bandwidth = 0.4
0 20 40 60 80
100
80
60
40
20
0
Fig. 3. LOWESS (locally weighted scatterplot smoothing) on neurosis scale. Each A-D is anxiety, depression, somatization and personality disorder subscale. BMI, body mass index. 1 hollow circle means 1 subject. There are 771,408 hollow circles in each graph.
A B
C D
Somatization
BMI
Bandwidth = 0.4
0 20 40 60 80
100
80
60
40
20
0
Fig. 3. LOWESS (locally weighted scatterplot smoothing) on neurosis scale. Each A-D is anxiety, depression, somatization and personality disorder subscale. BMI, body mass index. 1 hollow circle means 1 subject. There are 771,408 hollow circles in each graph.
A B
C D
Personality
BMI
Bandwidth = 0.4
0 20 40 60 80
100
80
60
40
20
0
Fig. 3. LOWESS (locally weighted scatterplot smoothing) on neurosis scale. Each A-D is anxiety, depression, somatization and personality disorder subscale. BMI, body mass index. 1 hollow circle means 1 subject. There are 771,408 hollow circles in each graph.
A B
C D
Depression
BMI
Bandwidth = 0.4
0 20 40 60 80
100
80
60
40
20
0
A B
C D
ed a near-positive correlation with BMI. Underweight and obe- sity are related to psychological distress, so supportive advice and education are needed to them.
ACKNOWLEDGMENTS
The authors are indebted to J. Patrick Barron, Professor Emeri- tus, Tokyo Medical University and Adjunct Professor, Seoul Na- tional University Bundang Hospital for his pro bono editing of this manuscript.
DISCLOSURE
There is no potential conflict of interest among the authors.
AUTHOR CONTRIBUTION
Conception & design of the study: Seo JS, Kim T, Kim JJ. Data collection: Kim T, Kim JJ, Kim MY. Analyzed the data: Data anal- ysis: Kim T, Kim SK, Roh S. Writing the first draft: Kim T. ICMJE criteria for authorship read and met: Seo JS, Kim T, Kim JJ, Kim MY, Kim SK, Roh S. Agree with Approval of manuscript: Seo JS, Kim T, Kim JJ, Kim MY, Kim SK, Roh S.
ORCID
Taehyun Kim http://orcid.org/0000-0002-6393-8026 Jeong Seok Seo http://orcid.org/0000-0001-9836-8425
Fig. 4. LOWESS (locally weighted scatterplot smoothing) on psychopath scale. Each (A) and (B) is schizophrenia and paranoia subscale. BMI, body mass index. 1 hollow circle means 1 subject. There are 771,408 hollow circles in each graph.
Fig. 4. LOWESS (locally weighted scatterplot smoothing) on psychopath scale. Each A and B is schizophrenia and paranoia subscale. BMI, body mass index. 1 hollow circle means 1 subject. There are 771,408 hollow circles in each graph.
A B
Schizophrenia
BMI
Bandwidth = 0.4
0 20 40 60 80
100
80
60
40
20
0
Fig. 4. LOWESS (locally weighted scatterplot smoothing) on psychopath scale. Each A and B is schizophrenia and paranoia subscale. BMI, body mass index. 1 hollow circle means 1 subject. There are 771,408 hollow circles in each graph.
A B
Paranoia
BMI
Bandwidth = 0.4
0 20 40 60 80
100
80
60
40
20
0
A B
REFERENCES
1. Subramaniam M, Picco L, He V, Vaingankar JA, Abdin E, Verma S, Rekhi G, Yap M, Lee J, Chong SA. Body mass index and risk of mental disor- ders in the general population: results from the Singapore Mental Health Study. J Psychosom Res 2013; 74: 135-41.
2. McCarthy JF, Ilgen MA, Austin K, Blow FC, Katz IR. Associations between body mass index and suicide in the veterans affairs health system. Obe- sity (Silver Spring) 2014; 22: 269-76.
3. Stanley SH, Laugharne JD, Addis S, Sherwood D. Assessing overweight and obesity across mental disorders: personality disorders at high risk.
Soc Psychiatry Psychiatr Epidemiol 2013; 48: 487-92.
4. Scott KM, McGee MA, Wells JE, Oakley Browne MA. Obesity and men- tal disorders in the adult general population. J Psychosom Res 2008; 64:
97-105.
5. Scott KM, Bruffaerts R, Simon GE, Alonso J, Angermeyer M, de Girola- mo G, Demyttenaere K, Gasquet I, Haro JM, Karam E, et al. Obesity and mental disorders in the general population: results from the world men- tal health surveys. Int J Obes (Lond) 2008; 32: 192-200.
6. Hu HY, Wu CY, Chou YJ, Huang N. Body mass index and mental health problems in general adults: disparity in gender and socioeconomic sta- tus. J Psychosom Res 2012; 72: 393-8.
7. Barry D, Pietrzak RH, Petry NM. Gender differences in associations be- tween body mass index and DSM-IV mood and anxiety disorders: re- sults from the National Epidemiologic Survey on Alcohol and Related Conditions. Ann Epidemiol 2008; 18: 458-66.
8. Crisp AH, McGuiness B. Jolly fat: relation between obesity and psycho- neurosis in general population. Br Med J 1976; 1: 7-9.
9. Palinkas LA, Wingard DL, Barrett-Connor E. Depressive symptoms in overweight and obese older adults: a test of the “jolly fat” hypothesis. J Psychosom Res 1996; 40: 59-66.
10. Revah-Levy A, Speranza M, Barry C, Hassler C, Gasquet I, Moro MR, Falissard B. Association between Body Mass Index and depression: the
“fat and jolly” hypothesis for adolescents girls. BMC Public Health 2011;
11: 649.
11. Jasienska G, Ziomkiewicz A, Górkiewicz M, Pajak A. Body mass, depres- sive symptoms and menopausal status: an examination of the “Jolly Fat”
hypothesis. Womens Health Issues 2005; 15: 145-51.
12. Magnusson PK, Rasmussen F, Lawlor DA, Tynelius P, Gunnell D. Asso- ciation of body mass index with suicide mortality: a prospective cohort study of more than one million men. Am J Epidemiol 2006; 163: 1-8.
13. Zhao G, Ford ES, Li C, Strine TW, Dhingra S, Berry JT, Mokdad AH. Se- rious psychological distress and its associations with body mass index:
findings from the 2007 Behavioral Risk Factor Surveillance System. Int J Public Health 2009; 54: 30-6.
14. Martinez EV, Gutiérrez-Bedmar M, A. G-R, Mariscal A, Muñoz-Bravo C, Navajas JF. Weight status and psychological distress in a Mediterranean Spanish population: a symmetric U-shaped relationship. Nutrients 2014;
6: 1662-77.
15. McCrea RL, Berger YG, King MB. Body mass index and common men- tal disorders: exploring the shape of the association and its moderation by age, gender and education. Int J Obes (Lond) 2012; 36: 414-21.
16. de Wit LM, van Straten A, van Herten M, Penninx BW, Cuijpers P. De- pression and body mass index, a u-shaped association. BMC Public Health 2009; 9: 14.
17. Subotnik KL, Asarnow RF, Nuechterlein KH, Fogelson DL, Thorpe TI, Payne DL, Giannini CA, Kuppinger HE, Torquato RD, Mintz J, et al. MMPI vulnerability indicators for schizophrenia and attention deficit disorder:
UCLA family study of biological parents of offspring with childhood-on- set schizophrenia or ADHD. Behav Genet 2005; 35: 159-75.
18. Hathaway SR, McKinley JC. The Minnesota multiphasic personality in- ventory. Minneapolis: The University of Minnesota Press, 1943.
19. Lahey BB, Russo MF, Walker JL, Piacentini JC. Personality characteris- tics of the mothers of children with disruptive behavior disorders. J Con- sult Clin Psychol 1989; 57: 512-5.
20. Lee SJ, Kwon JH, Lee YJ. Personality characteristics of mothers of children with attention deficit hyperactivity disorder as assessed by the Minnesota multiphasic personality inventory. Psychiatry Investig 2008; 5: 228-31.
21. Physical status: the use and interpretation of anthropometry. Report of a WHO Expert Committee. World Health Organ Tech Rep Ser 1995; 854:
1-452.
22. Lee JG, Nam WM. The evaluation of the Korean military personality in- ventory. Korean Psychological Association Annual Conference. Seoul:
Korean Psychological Association, 2006, p.466-7.
23. Lee JG, Nam WM, Park JH, Lim HS, Yoon HH, Han JH. The relationship between the KMPI and the military personality inventory. Korean Psy- chological Association Annual Conference. Seoul: Korean Psychological
Association, 2006, p.464-5.
24. Won HT, Han DW, Sin ES, Park KB, Lee YH, Yuk SP. Final report on de- velopment study of military personality inventory. Seoul: Korean Psy- chological Association, 1998.
25. Choi KH, Jung SG, Choi KP, Moon CB, Kim JM. Development of new military personality inventory. Seoul: Korea Institute for Defense Analy- ses, 2009; Report No.Un07-2699.