Received June 16, 2020 Revised June 19, 2020 Accepted June 26, 2020 Corresponding author Chol Shin
Internal Medicine / Institute University / Hospital: Institute of Human Genomic Study / Korea University / Ansan Hospital Street Name & Number: 123 Jeokgeum-ro, Danwon-gu, Gyeonggi-do City, State, Postal code, Country: Ansan-si, 15355, Republic of Korea
Tel: +82-31-412-5603, E-mail: [email protected]
Ⓒ The Society of Sasang Constitutional Medicine.
All rights reserved. This is an open acess article distributed under the terms of the Creative Commons attribution Non-commercial License (http:// creativecommons.org/licenses/by-nc/3.0/)
사상체질과 골밀도, 골감소증, 골다공증과의 연관성
이승구1,7⋅윤대위2⋅김종렬3⋅김진관2⋅이혜련4⋅이성희5⋅애보트 로버트1,7⋅신철1,6,7*
1고려대학교 인간유전체연구소 연구교수, 2중원대학교 임상병학과 교수,
3한국한의학연구원 미래의학부 책임연구원, 4나사렛대학교 간호학과 교수, 5강원대학교 식품영양학과 교수,
6고려대학교 안산병원 호흡기내과 교수, 7고려대학교 의과대학 내과 교수
Abstract
Association of Sasang Constitutional Type with Bone Mineral Density, Osteopenia, and Osteoporosis
Seung Ku Lee1,7⋅Dae Wui Yoon2⋅Jong Yeol Kim3⋅Jin Kwan Kim2⋅Hyeryeon Yi4⋅ Sunghee Lee5⋅Robert D. Abbott1,7⋅Chol Shin1,6,7*
1Institute of Human Genomic Study, College of Medicine, Korea University Ansan Hospital
2Department of Biomedical Laboratory Science, College of Health Science, Jungwon University
3Constitutional Medicine and Diagnosis Research Group, Korea Institute of Oriental Medicine
4Department of Nursing, Korea Nazarene University
5Department of Food and Nutrition, College of Health Science, Kangwon National University
6Department of Pulmonary, Sleep and Critical Care Medicine, College of Medicine, Korea University Ansan Hospital
7College of Medicine, Korea University Object
Although Taeeum and Soyang constitutional types have bigger body shapes and higher body mass index values than those with the Soeum, the relationship between the Sasang constitutional type and bone mass density is controversial and the association of osteopenia and osteoporosis remains unknown. Therefore, we investigated the relationship between bone mineral density, osteopenia, and osteoporosis according to Sasang constitutional type.
Methods
A total of 2,508 participants were included in this study. Among the study participants, 1,396 had Taeeum type, 276 had Soeum type, and 836 had Soyang type, respectively. The relationships to bone mass density, osteopenia, and osteoporosis in those with Sasang constitutional type were estimated using logistic and linear regression models.
Results
Bone mass density was significantly higher in the order of Taeeum, Soyang, and Soeum group (p < 0.01). Soeum group in comparison with Taeeum or Soyang group was significantly associated with a high odds ratio for osteopenia and osteoporosis except in the hip and femoral neck in the comparison of Taeeum and Soeum group (p < 0.01). Moreover, the bone mass density of Soeum group decreased more rapidly as the age increased when compared with Taeeum and Soyang group.
Conclusions
Our findings may contribute to the early prevention and management of high-risk individuals with poor bone mass density, osteopenia, and osteoporosis using Sasang constitution medicine.
Key Words: Sasang constitution, Osteopenia; Osteoporosis; Bone loss; Bone mineral density
Ⅰ. Introduction
Obesity and osteoporosis in older people have been rec- ognized as public health issues for several decades1,2. The world has an increasing aging population. In 2019, people older than 65 years of age made up 9% of the global population; by 2050, this number is expected to increase to almost 16%. Therefore, improving the health and qual- ity of life with diseases in an aging society is thought to be an important global concern.
Imbalance between bone resorption and bone formation causes osteopenia, osteoporosis, and osteoporotic fractures3. Many risk factors for osteoporosis and fracture have recently been identified including genetics, nutrition, lifestyle char- acteristics [e.g., cigarette smoking, alcohol consumption, exercise, body mass index (BMI)], and hormone deficien- cies4,5. Moreover, osteoporotic fractures are associated with an increased risk for all-cause mortality6, cardiovascular events7, decreased quality of life5, and higher health care costs8, which are recognized as important issues facing the elderly.
Sasang constitution medicine (SCM) was introduced in Korea by Jema Lee in 1894 as a way of classifying people into four constitutional body types based on a set of biopsy- chological traits9. The four types are Taeyang (TY), Taeeum (TE), Soyang (SY), and Soeum (SE). Indices of body composition, which include BMI, weight, height, and body circumference, play an important role in this system of classification. In general, TE and SY individuals tend to have higher BMI, body weight, muscle mass, and body fat values relative to SE10. Other characteristics used in the SCM classification include psychological and other physiological traits (e.g., disease susceptibility, response to herbal medicines, and equilibrium of bodily functions).
Based on these traits, a useful description of the differences in SCM body types is provided elsewhere11. However, to summarize, SY tend to be more outgoing, have more en-
ergy, and show a greater level of curiosity than TE and SE. SY are also more temperamental and quicker to re- spond impulsively, while SE tend to be more withdrawn and guarded, and are often more focused, tolerant, and well-prepared. Although TE individuals are more like- ly to have greater body anthropometry, in terms of psychological traits, they tend to fall in between the SY and SE.
Previously studies indicate that BMI and body weight are associated with bone mineral density(BMD)12. However, the relationship between Sasang constitutional type (SCT) and BMD remains controversial13-15. In a comparative SCT study of young and older groups of women, those who were older showed a significant difference in BMD of the lumbar spine (p < 0.05; 1.085 ± 0.126 for TE, 1.065
± 0.161 for SY, and 0.924 ± 0.109 for SE), while those who were younger showed no such significance14. In other study, The T-score of the femoral neck in the old-age population exhibited significant differences according to SCT (p < 0.05; 0.76 ± 1.07 for TE, 0.92 ± 0.81 for SY, and 0.84 ± 0.86 for SE)13. However, these studies do not confirm significant results adjusted for co- variates13,15. Therefore, we investigated the associations be- tween BMD, osteopenia, and osteoporosis according to SCT in a large population-based cohort study.
Ⅱ. Subjects and Methods
A. Subjects
We studied participants enrolled in the Korean Genome and Epidemiology Study (KoGES) Ansan cohort, a pro- spective community-based cohort study conducted in 5,012 residents between 40 and 70 years of age in Ansan city from 2001 to 2002. Biennial follow-up assessments were completed. For osteoporosis, we performed a first
dual-energy X-ray absorptiometry (DXA) examination from 2009 to 2010. During the same period, participants of the cohort were enrolled in an SCM study16. We in- cluded 2,508 (1,278 females and 1,230 males) of 2,969 people who had complete DXA data (n = 2,871) and an SCT classification (n = 3,211). The Institutional Review Board of Korea University Ansan Hospital approved the study protocol and written informed consent was obtained from study participants.
B. DXA and criteria for osteoporosis
Bone mineral density (g/cm2) was measured at the total hip, femoral neck, and lumbar spine by certified radiology technicians using DXA (DPX-MD+, General Electric, Boston, MA, USA) according to the manufacturer’s instructions. Osteopenia and osteoporosis were diagnosed on the basis of BMD T-scores following standard guidelines. Here, osteoporosis was defined when the T-score was −2.5 point or less. Osteoporosis was also de- fined when a subject was treated for osteoporosis based on the World Health Organization International Society for Clinical Densitometry criteria17. Osteopenia was de- fined when the T-score exceeded −2.5 point but remained
−1 point or less. Subjects having either osteoporosis or osteopenia were combined to form an overall bone-loss group.
C. Classification of SCTs
We used an integrated diagnostic model for SCT classification. The diagnostic model was based on proba- bility values for each type using multinomial logistic regression-based individual quantitative data for the face, body shape, and voice as well as that gathered from a biopsychological questionnaire16. Diagnostic accuracy of training set and test was 68.9% and 64.0% in men
and 62.3% and 55.2% in women, respectively. In this study, TY individuals were not included because the TY classification is known to affect a very rare frequency of three to four per 10,000 people in the Korean pop- ulation18.
D. Definition of measurements
Blood samples were collected in the morning after an overnight fast. Blood pressure was measured using a mer- cury sphygmomanometer with the patient in a seated position. Sex was used to indicate physical or physiological differences between men and women. Diabetes was defined as presenting a fasting glucose level of 126 mg/dL or more, two-hour glucose level of 200 mg/dL or more, or current diabetic drug usage. Hypertension was defined as a sys- tolic/diastolic pressure of 140/90 mmHg or more, and/or the use of antihypertensive drugs. BMI was calculated by dividing the weight in kilograms by the height in meters squared (kg/m2). Hyperlipidemia was defined as the use of antihyperlipidemia drugs. Leisure-time physical activity was evaluated using questionnaires covering the type of activity, frequency, and duration. A metabolic equivalent (MET) score was assigned for each sports activity based on a compendium of physical activities. Time spent per day performing each activity was multiplied by the MET value of the activity to obtain the total MET minutes per week19. Beverage-specific alcohol consumption in g/day was calculated on the basis of the alcohol content (i.e., 4.5% for beer, 13% for wine, 40% for hard liquor, 22% for soju, 15% for chungju, and 6% for makgeolli), the frequency of drinking, and the amount consumed20. Blood test findings were determined using an autoanalyzer (ADVIA 1650; Siemens, Munich, Germany) in the Seoul Clinical Laboratories (Seoul, Korea).
E. Statistical analysis
Data are presented as means ± standard deviation for continuous variables and frequencies and percentages for categorical variables. Significant differences in means were evaluated using a generalized linear model for continuous variables and the chi-squared test for categorical variables.
In addition, a logistic regression model was adopted to estimate the relative odds of osteopenia, osteoporosis, and all bone loss between SCT (including 95% confidence in- tervals). In the multiple logistic and linear regression mod- els, potential confounding variables were adjusted, which included age, sex, BMI, alcohol consumption, exercise, smoking, hypertension, diabetes, hyperlipidemia, lean mass (tertiles), and fat mass (tertiles). Statistical analysis was performed using SAS version 9.4 (SAS Institute, Cary, NC, USA). All reported p-values were based on two-sided tests of significance.
Ⅲ. Results
A. Study characteristics according to SCT
Table 1 presents the general characteristics according to SCT. Participants included 1,396 with the TE, 276 with the SE, and 836 with the SY, respectively. The pro- portions of women were 45.8% in the TE group, 55.8%
in the SE group, and 58% in the SY group. The average age of study participants according to SCT was 57.5 ± 7.8 years for TE, 55.5 ± 6.8 years for SE, 55.4 ± 6.6 years for SY. Weight and BMI had lower means in the order of SE, SY, and TE. Separately, height and alcohol consumption of SE and SY participants presented lower means than those of TE participants, while there was no difference between SE and SY participants in this regard.
SCT had significant associations with diabetes, hyper- tension, hyperlipidemia, current smoking, lean mass, and
fat mass (p < 0.05). Specifically, diabetes affected lower proportions of participants in the order of SE, SY, and TE. Hypertension and hyperlipidemia in SE and SY partic- ipants also affected lower proportions relative to those found among TE participants, while there was no differ- ence between SE and SY participants in this regard.
Exercise was only significant in the comparison between SE and SY, while current smoking was only significant in the comparison between SY and TE. The low- and mid-level groups of lean mass and fat mass affected higher proportions in the order of SE, SY, and TE.
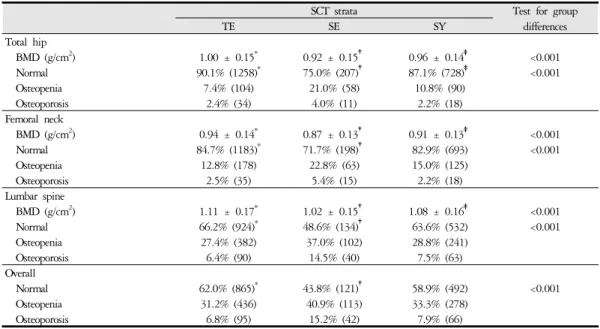
B. Prevalence rates of osteopenia, osteoporosis, and mean BMD according to SCT
The prevalence rates of osteopenia, osteoporosis, and mean BMD of the three sites (total hip, femoral neck, and lumbar spine) and all sites stratified by SCT are shown in Table 2. Total hip and lumbar spine had higher BMDs in the order of TE, SY, and SE (p < 0.05; 1.00 ± 0.15, 0.96 ± 0.14, and 0.92 ± 0.15 for total hip; 0.94 ± 0.14, 0.91 ± 0.13, and 0.87 ± 0.13 for femoral neck; and 1.11
± 0.17, 1.08 ± 0.16, and 1.02 ± 0.15 for lumbar spine, respectively).
Osteopenia and osteoporosis affected a significantly larger proportion of the SE group than the TE and SY groups at the total hip, femoral neck, lumbar spine, and all sites (p < 0.05). In the case of the TE and SY groups, only the total hip findings presented a significant differ- ence, while the other sites did not show any difference.
In Figure 1, we indicate the proportions of normal (black bar), osteopenic (light grey bar), and osteoporotic (grey bar) bone according to SCT and age in various skeletal sites. The proportions of osteopenia and osteoporosis at all sites increased progressively with age. With the in- creases in the SE group confirmed to be higher relative to those in the TE and SY groups.
SCT Strata Test for group differences
Characteristic TE (n = 1,396) SE (n = 276) SY (n = 836)
Women 45.8% (639)* 55.8% (154) 58.0% (485)‡
Age (years) 57.5 ± 7.8* 55.5 ± 6.8 55.4 ± 6.6‡ <0.001
Weight, kg 69.0 ± 8.9* 55.0 ± 6.3† 59.2 ± 7.5‡ <0.001
Height, cm 162.1 ± 8.3* 160.1 ± 7.4 159.6 ± 8.0‡ <0.001
Body mass index, kg/m2 26.2 ± 2.5* 21.4 ± 1.8* 23.2 ± 1.9‡ <0.001
Alcohol consumption, g/day 10.4 ± 21.5* 5.7 ± 18.6 6.3 ± 15.9‡ <0.001
Exercise, MET-min/week 200.8 ± 259.4 160.3 ± 209.3 208.3 ± 270.9 0.025
Hypertension 42.2% (589)* 19.2% (53) 22.8% (191)‡ <0.001
Diabetes 32.8% (458)* 14.5% (40)† 20.1% (168)‡ <0.001
Hyperlipidemia 11.8% (165)* 5.8% (16) 6.5% (54)‡ <0.001
Current smoker 13.9% (194) 13.8% (38) 10.3% (86)‡ <0.001
Lean mass (tertiles) <0.001
Low 23.1% (322) 46.0% (127) 46.3% (387)
Middle 34.4% (480) 40.2% (111) 29.3% (245)
High 42.6% (594)* 13.8% (38)† 24.4% (204)‡
Fat mass (tertiles) <0.001
Low 18.4% (257) 70.3% (194) 46.1% (385)
Middle 32.2% (450) 22.1% (61) 38.9% (325)
High 49.4% (689)* 7.6% (21)† 15.1% (126)‡
Continuous variables are expressed as average ± SD and categorical variables are expressed as % (n).
*Significant difference between TE and SE strata (p < 0.05)
†Significant difference between SE and SY strata (p < 0.05)
‡Significant difference between SY and TE strata (p < 0.05) Abbreviation: MET; metabolic equivalent of task
Table 1. Average and Percentage of Study Characteristics according to Sasang Constitutional Type
SCT strata Test for group
differences
TE SE SY
Total hip
BMD (g/cm2) 1.00 ± 0.15* 0.92 ± 0.15† 0.96 ± 0.14‡ <0.001
Normal 90.1% (1258)* 75.0% (207)† 87.1% (728)‡ <0.001
Osteopenia 7.4% (104) 21.0% (58) 10.8% (90)
Osteoporosis 2.4% (34) 4.0% (11) 2.2% (18)
Femoral neck
BMD (g/cm2) 0.94 ± 0.14* 0.87 ± 0.13† 0.91 ± 0.13‡ <0.001
Normal 84.7% (1183)* 71.7% (198)† 82.9% (693) <0.001
Osteopenia 12.8% (178) 22.8% (63) 15.0% (125)
Osteoporosis 2.5% (35) 5.4% (15) 2.2% (18)
Lumbar spine
BMD (g/cm2) 1.11 ± 0.17* 1.02 ± 0.15† 1.08 ± 0.16‡ <0.001
Normal 66.2% (924)* 48.6% (134)† 63.6% (532) <0.001
Osteopenia 27.4% (382) 37.0% (102) 28.8% (241)
Osteoporosis 6.4% (90) 14.5% (40) 7.5% (63)
Overall
Normal 62.0% (865)* 43.8% (121)† 58.9% (492) <0.001
Osteopenia 31.2% (436) 40.9% (113) 33.3% (278)
Osteoporosis 6.8% (95) 15.2% (42) 7.9% (66)
BMD is expressed as average ± SD and osteopenia and osteoporosis are expressed as % (n)
*Significant difference between TE and SE strata (p < 0.05)
†Significant difference between SE and SY strata (p < 0.05)
‡Significant difference between SY and TE strata (p < 0.05) Abbreviation: BMD; Bone mass density
Table 2. Average Bone Mass Density and Prevalence of Osteopenia and Osteoporosis according to Sasang Constitutional Type
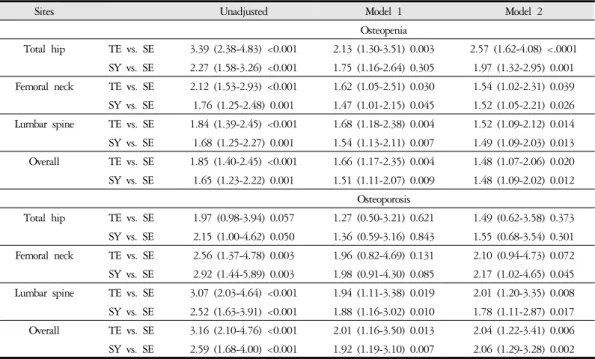
C. Association between osteopenia, osteoporosis, and SCT
We used a logistic regression model to evaluate osteope- nia and osteoporosis in the total hip, femoral neck, lumbar
spine, and all sites according to SCT (Table 3). The odds ratios (ORs) were analyzed by selecting the TE or SY group as the reference. Before adjusting for confounding variables, the osteopenia proportion of the SE group compared to that in the TE or SY group was significantly associated Figure 1. Age-specific prevalence of overall bone loss, osteopenia, and osteoporosis according to Sasang constitutional type
across different skeletal sites.
with all sites (OR for all sites: minimum 1.65 and max- imum 3.39; p < 0.05). Osteoporosis in the SE groups rela- tive to that in the TE or SY group significantly affected the femoral neck, lumbar spine, and all sites (OR: 2.52–
3.16; p < 0.05), while the findings in the total hip were not significant. After the adjustment of model 1 including age, sex, BMI, alcohol consumption, exercise, smoking, hypertension, diabetes, and hyperlipidemia, osteopenia in the SE group was significantly associated with a higher OR when compared with the TE or SY group in all sites (OR: 1.47–2.13; p < 0.05). Further, osteoporosis in the SE group was significantly associated with a higher OR when compared with in the TE or SY group at the lumbar spine and all sites (OR: 1.88–2.01; p < 0.05). However, findings for the total hip and femoral neck in this context were not significant. Separately, model 2 was adjusted for age, sex, alcohol consumption, exercise, smoking, hyper-
tension, diabetes, and hyperlipidemia, lean mass (tertiles), and fat mass (tertiles). Here, osteopenia in the SE group was significantly associated with a higher OR when com- pared with the TE or SY groups in all sites (OR: 1.48– 2.57; p < 0.05). Finally, osteoporosis in the SE group was significantly associated with a higher OR relative to in the TE or SY groups at the lumbar spine, femoral neck (SY vs. SE), and all sites (OR: 1.78–2.06; p < 0.05), while that in the total hip and femoral neck (TE vs. SE) was not significant.
D. Distribution of BMD according to SCT
We displayed the distribution of BMD according to SCT using kernel density estimate curves (Figure 2A–2C).
The median BMD at all sites had higher in the order of TE, SY, and SE (p < 0.05; 1.00, 0.95, and 0.91 for
Sites Unadjusted Model 1 Model 2
Osteopenia
Total hip TE vs. SE 3.39 (2.38-4.83) <0.001 2.13 (1.30-3.51) 0.003 2.57 (1.62-4.08) <.0001 SY vs. SE 2.27 (1.58-3.26) <0.001 1.75 (1.16-2.64) 0.305 1.97 (1.32-2.95) 0.001 Femoral neck TE vs. SE 2.12 (1.53-2.93) <0.001 1.62 (1.05-2.51) 0.030 1.54 (1.02-2.31) 0.039 SY vs. SE 1.76 (1.25-2.48) 0.001 1.47 (1.01-2.15) 0.045 1.52 (1.05-2.21) 0.026 Lumbar spine TE vs. SE 1.84 (1.39-2.45) <0.001 1.68 (1.18-2.38) 0.004 1.52 (1.09-2.12) 0.014 SY vs. SE 1.68 (1.25-2.27) 0.001 1.54 (1.13-2.11) 0.007 1.49 (1.09-2.03) 0.013 Overall TE vs. SE 1.85 (1.40-2.45) <0.001 1.66 (1.17-2.35) 0.004 1.48 (1.07-2.06) 0.020 SY vs. SE 1.65 (1.23-2.22) 0.001 1.51 (1.11-2.07) 0.009 1.48 (1.09-2.02) 0.012
Osteoporosis
Total hip TE vs. SE 1.97 (0.98-3.94) 0.057 1.27 (0.50-3.21) 0.621 1.49 (0.62-3.58) 0.373 SY vs. SE 2.15 (1.00-4.62) 0.050 1.36 (0.59-3.16) 0.843 1.55 (0.68-3.54) 0.301 Femoral neck TE vs. SE 2.56 (1.37-4.78) 0.003 1.96 (0.82-4.69) 0.131 2.10 (0.94-4.73) 0.072 SY vs. SE 2.92 (1.44-5.89) 0.003 1.98 (0.91-4.30) 0.085 2.17 (1.02-4.65) 0.045 Lumbar spine TE vs. SE 3.07 (2.03-4.64) <0.001 1.94 (1.11-3.38) 0.019 2.01 (1.20-3.35) 0.008 SY vs. SE 2.52 (1.63-3.91) <0.001 1.88 (1.16-3.02) 0.010 1.78 (1.11-2.87) 0.017 Overall TE vs. SE 3.16 (2.10-4.76) <0.001 2.01 (1.16-3.50) 0.013 2.04 (1.22-3.41) 0.006 SY vs. SE 2.59 (1.68-4.00) <0.001 1.92 (1.19-3.10) 0.007 2.06 (1.29-3.28) 0.002 Model 1 was adjusted for age, sex, BMI, alcohol consumption, exercise, smoking, hypertension, diabetes, and hyperlipidemia.
Model 2 was adjusted for age, sex, alcohol consumption, exercise, smoking, hypertension, diabetes, hyperlipidemia, lean mass (tertiles), and fat mass (tertiles). *p < 0.05
Abbreviation: BMD; Bone mass density
Table 3. Relative Odds Ratios of Osteopenia and Osteoporosis comparing TE and SY with SE
total hip; 0.93, 0.09, and 0.86 for the femoral neck; and 1.10, 1.07, and 1.01 for lumbar spine, respectively). Also, variable age-related declines in BMD at the various sites according to SCT are shown in Figures 2D, 2E, and 2F.
All sites had lower BMD in the SE group than in the TE and SY groups with increased age. Noticeably, the BMD of the SE group decreased more rapidly as age in- creased than in the TE and SY groups (p for SCT < 0.01, p for age < 0.01, and interaction p < 0.01).
Ⅳ. Discussion and Conclusion
In this study, we examined the BMD and prevalence rates of osteopenia and osteoporosis according to SCT in a large population-based cohort study. We found that SE
not only experience higher proportions of osteopenia and osteoporosis in comparison with TE or SY but also had lower BMD than either TE or SY. Moreover, increased aging of SE leads to significantly higher proportions of osteopenia and osteoporosis and lower BMD than in TE and SY matched for age.
SCM is a traditional medicine approach with a long history that has been applied clinically in Korea.
Personalized medicine using herbal medicines according to individual SCT has been adopted for about 100 years21. In SCM, obesity is an important traits. Specifically, BMI, waist circumference, and waist-to-hip ratio of TE and SY impart significantly higher odds for such than in SE22.
Obesity and osteoporosis have multifactorial etiologies including genetic and environmental risk factors, with po- tential interactions between them23. Obesity has tradition- Figure 2. Distribution of bone mass density according to Sasang constitutional type and age. Percentage frequency distribution of bone mass density in various sites according to Sasang constitutional type (A, B, C). Age-related decline in bone mass density at various sites according to Sasang constitutional type (D, E, F).
ally been recognized as a protector or inhibitor of osteoporosis. In several studies, it has been reported that high weight or BMI is positively associated with high bone density and that weight loss leads to bone loss12. In contrast, extreme obesity (BMI > 40 kg/m2) is associated with lower BMD24. BMI is the most commonly used meas- urement of obesity, but it does not distinguish body fat mass from lean mass25. The development of DXA and bioelectrical impedance analysis enabled the measurements of body fat mass, lean mass, and bone mass, which led to active relevant research26. A recent meta-analysis sug- gested that both body fat mass and lean mass are positively correlated with BMD of the lumbar spine, femoral neck, and whole body despite sex, age, ethnicity, and menopausal status27.
Although these results indicated that fat mass and mus- cle mass show interdependent relationships in the growth and maintenance of bone mass, it is difficult to explain this in the context of bone metabolism among different SCT classifications. Several mechanisms including mechan- ical loading and adipocytokines have been proposed to ex- plain the relationships between lean mass and fat mass with BMD or bone mineral contents.
The effects of mechanical load on bone metabolism have been reported in studies of BMD encompassing weight loss achieved by calorie restrictions and exercise. One year of follow-up revealed that caloric restriction-induced weight loss reduced BMD of the lumbar spine, total hip, femoral neck, and intertrochanter site, but this not sim- ilarly achieved by exercise12. During the 12-week study period, dietary intervention with energy restrictions led to the BMDs of the higher-protein chicken group and higher-protein beef group exhibiting a more significant decrease than that in the nonintervention control group28. Different kinds of exercise, including gymnastics, running, and no exercise, were studied to determine differences in BMD among adolescent girls during 12 months.
Gymnastics help with increasing the BMD in the femoral neck, trochanter, and lumbar spine29. Additionally, gym- nasts and runners in comparison with those in the control group showed increases in BMD in the lumbar spine and femoral neck during seven years of follow-up study30. These results support that regular weight-bearing activity is strongly connected to BMD. Also, mechanical loading ac- tions such as greater weight-bearing increases bone for- mation by decreasing apoptosis and increasing the pro- liferation and differentiation of osteoblasts and osteoclasts through the Wnt/b-catenin signaling pathway31.
In our previous study, we reported that TE not only showed significantly lower adiponectin and ghrelin levels relative to the SE and SY, whereas the SE had the highest levels of adiponectin and ghrelin among all SCT classi- fications, but also showed that the contributions of adipo- nectin, ghrelin, and leptin to metabolic syndrome and its components differ according to SCT32. Adiponectin and leptin are released predominantly from fat tissues, while ghrelin is predominantly released from the stomach33. These appetite-regulating hormones are types of adipocyto- kines and are associated with bone metabolism34. The tra- becular bone mass volume in an adiponectin transgenic mouse model increased compared with control animals, and tartrate-resistant acid phosphatase–positive mono- nuclear cell count was confirmed to have decreased. Also, adiponectin not only inhibited macrophage colony-stim- ulating factor and receptor activator of nuclear factor kap- pa-Β ligand–induced differentiation of osteoclasts in vitro but also suppressed bone resorption activity by inhibiting osteoclastogenesis35. Known as the hunger hormone, ghre- lin stimulates appetite and promotes eating. Research sug- gests that ghrelin increases the bone resorption of mature rat osteoclasts but does not affect the differentiation of osteoclasts. In human primary osteoblasts culture, ghrelin promoted an increase in the roughly two-fold proliferation of osteoblasts36. Ob/ob (leptin mutant) mice and db/db
(leptin receptor mutant) presented bone mass and volume increases, while bone mass was inhibited with an intra- cerebroventricular infusion of leptin37. A recent meta-anal- ysis suggested that adipokine was negatively associated with BMD and independently with sex, menopausal status, and fat mass parameters38, while leptin appears positively correlated with BMD, in particular in postmenopausal women39. Although many studies have been conducted to discern the link between bone mass and bone density of adiponectin, ghrelin, and leptin, results are not con- sistent and the roles of bone mass and bone density remain unclear. The fact that even the systematic review report emphasized a need for further investigation in larger longi- tudinal studies supports this. Moreover, follow-up research in the areas of osteopenia and osteoporosis may explain the importance of managing low BMD by the development of high bone fractions (1.73- and 2.74-fold respectively)40.
Despite the importance of osteoporosis and obesity in SCT, studies of BMD, osteoporosis, and osteopenia remain inadequate. In this study, we suggested that SE not only exhibit higher proportions of osteopenia and osteoporosis in comparison with TE or SY but also reduced BMD.
These results are meaningful as they come after the adjust- ment of previously known risk factors. The possible ex- planation for the discrepancies between these studies might be related to variations between populations (small or large), research designs (random or population-based), and methodological differences (Questionnaire of Sasang Constitution Classification, Phonetic system, or integrated diagnostic model for the classification of SCT).
Although our results did not reveal the exact mecha- nism of BMD, osteopenia, or osteoporosis according to SCT, we still show differences in BMD, osteopenia, and osteoporosis depending on SCT. These findings may con- tribute to the early prevention and management of high-risk individuals of osteoporosis according to SCT.
Further investigations are needed to confirm BMI changes
in baseline and over time and the incidences of osteopenia and osteoporosis through longitudinal studies, while future research should attempt to confirm the risk factors for osteoporosis according to SCT and to explore the physio- logical mechanisms underlying the association.
Ⅴ. Acknowledgment
This research was supported by the Bio & Medical Technology Development Program of the National Research Foundation of Korea (NRF) funded by the Ministry of Science, ICT & Future Planning (no. 2015M 3A9B6027142), by research funding (nos. 2009-E71002 -00 and 2010-E71001-00) from the Korea Centers for Disease Control and Prevention, and by a Korea University Grant.
We would like to thank participants of the cohort at the Korean University and the involved in the present work.
Ⅵ. References
1. Riggs BL, Melton LJ, 3rd. The worldwide problem of osteoporosis: insights afforded by epidemiology.
Bone 1995;17(5 Suppl):505S-511S. doi: 10.1016/8756 -3282(95)00258-4
2. Low S, Chin MC, Deurenberg-Yap M. Review on epi- demic of obesity. Ann Acad Med Singapore 2009;38(1):
57-59.
3. Manolagas SC, Jilka RL. Bone marrow, cytokines, and bone remodeling. Emerging insights into the patho- physiology of osteoporosis. The New England journal of medicine 1995;332(5):305-311. doi: 10.1056/NEJM 199502023320506
4. Baron JA, Farahmand BY, Weiderpass E, Michaelsson
K, Alberts A, Persson I, et al. Cigarette smoking, alco- hol consumption, and risk of hip fracture in women.
Archives of internal medicine 2001;161(7):983-988. doi:
10.1001/archinte.161.7.983
5. Lips P, Cooper C, Agnusdei D, Caulin F, Egger P, Johnell O, et al. Quality of life in patients with verte- bral fractures: validation of the Quality of Life Questionnaire of the European Foundation for Osteoporosis (QUALEFFO). Working Party for Quality of Life of the European Foundation for Osteoporosis. Osteoporosis international : a journal established as result of cooperation between the European Foundation for Osteoporosis and the National Osteoporosis Foundation of the USA 1999;
10(2):150-160. doi: 10.1007/s001980050210 6. Haentjens P, Magaziner J, Colon-Emeric CS, Van-
derschueren D, Milisen K, Velkeniers B, et al.
Meta-analysis: excess mortality after hip fracture among older women and men. Annals of internal medi- cine 2010;152(6):380-390. doi: 10.7326/0003-4819- 152-6-201003160-00008
7. Szulc P, Chapurlat R, Hofbauer LC. Prediction of Fractures and Major Cardiovascular Events in Men Using Serum Osteoprotegerin Levels: The Prospective STRAMBO Study. Journal of bone and mineral research : the official journal of the American Society for Bone and Mineral Research 2017 doi: 10.1002/jbmr.3213 8. Viswanathan HN, Curtis JR, Yu J, White J, Stolshek
BS, Merinar C, et al. Direct healthcare costs of osteopo- rosis-related fractures in managed care patients receiv- ing pharmacological osteoporosis therapy. Applied health economics and health policy 2012;10(3):163-173.
doi: 10.2165/11598590-000000000-00000
9. Choi S-h. Longevity and Life Preservation In Eastern Medicine. Kyung Hee University Press 2009:1-368.
(Korean)
10. Lee SK, Yoon DW, Choi KM, Lee SW, Kim JY, Kim JK, et al. Association of Sasang Constitutional
Type with Sarcopenia. Evidence-based complementary and alternative medicine : eCAM 2015;2015:651090. doi:
10.1155/2015/651090
11. Lee SJ, Park SH, Cloninger CR, Kim YH, Hwang M, Chae H. Biopsychological traits of Sasang typology based on Sasang personality questionnaire and body mass index. BMC complementary and alternative medicine 2014;14:315. doi: 10.1186/1472-6882-14-315 12. Villareal DT, Fontana L, Weiss EP, Racette SB,
Steger-May K, Schechtman KB, et al. Bone mineral density response to caloric restriction-induced weight loss or exercise-induced weight loss: a randomized controlled trial. Archives of internal medicine 2006;
166(22):2502-2510. doi: 10.1001/archinte.166.22.2502 13. Kim ES, Lee JM, Lee CH, Jang JB, Lee KS. Association
of Sasang Constitution with Bone Mineral Density in Postmenopausal Korean Women. THE JOURNAL OF ORIENTAL OBSTETRICS & GYNECOLOGY 2009;22(4):149-156. (Korean)
14. Kim HW, Son JM. A Clinical Study on the Relation between Sasang Constitution and Bone Mineral Density (BMD) in Women. Journal of Sasang Constitutional Medicine 2001;13(3):52-58. (Korean)
15. Song HS, Choi JW, Yu JS, Park JK;. Relationship between Osteoporosis and Cardiovascular Risk Factors according to Sasang Constitution in Rural Wonju Cohort. Journal of Sasang Constitutional Medicine 2013;
25(2):81-97. (Korean) doi: 10.7730/JSCM.2013.25.
2.81
16. Do JH, Jang E, Ku B, Jang JS, Kim H, Kim JY.
Development of an integrated Sasang constitution di- agnosis method using face, body shape, voice, and questionnaire information. BMC complementary and al- ternative medicine 2012;12:85. doi: 10.1186/1472- 6882-12-85
17. WHO. Prevention and Management of Osteoporosis.
World Health Organization 2003;WHO Technical
Report Series 921
18. Jung SM, Schumacher HR. Can characterization by traditional Korean medical criteria help in our under- standing of patients with rheumatoid arthritis? Clin Exp Rheumatol 2005;23(5):729-730.
19. Ainsworth BE, Haskell WL, Leon AS, Jacobs DR, Jr., Montoye HJ, Sallis JF, et al. Compendium of phys- ical activities: classification of energy costs of human physical activities. Medicine and science in sports and ex- ercise 1993;25(1):71-80. doi: 10.1249/00005768-199 301000-00011
20. Baik I, Shin C. Prospective study of alcohol con- sumption and metabolic syndrome. The American jour- nal of clinical nutrition 2008;87(5):1455-1463. doi:
10.1093/ajcn/87.5.1455
21. Kim JY, Pham DD. Sasang constitutional medicine as a holistic tailored medicine. Evidence-based comple- mentary and alternative medicine : eCAM 2009;6 Suppl 1:11-19. doi: 10.1093/ecam/nep100
22. Baek Y, Park K, Lee S, Jang E. The prevalence of general and abdominal obesity according to sasang constitution in Korea. BMC complementary and alter- native medicine 2014;14:298. doi: 10.1186/1472-6882 -14-298
23. Migliaccio S, Greco EA, Fornari R, Donini LM, Lenzi A. Is obesity in women protective against osteoporosis?
Diabetes Metab Syndr Obes 2011;4:273-282. doi: 10.21 47/DMSO.S11920
24. Nunez NP, Carpenter CL, Perkins SN, Berrigan D, Jaque SV, Ingles SA, et al. Extreme obesity reduces bone mineral density: complementary evidence from mice and women. Obesity (Silver Spring) 2007;15(8):
1980-1987. doi: 10.1038/oby.2007.236
25. Nuttall FQ. Body Mass Index: Obesity, BMI, and Health: A Critical Review. Nutr Today 2015;50(3):
117-128. doi: 10.1097/NT.0000000000000092 26. Bolanowski M, Nilsson BE. Assessment of human body
composition using dual-energy x-ray absorptiometry and bioelectrical impedance analysis. Med Sci Monit 2001;7(5):1029-1033.
27. Ho-Pham LT, Nguyen UD, Nguyen TV. Association between lean mass, fat mass, and bone mineral density:
a meta-analysis. J Clin Endocrinol Metab 2014;99(1):
30-38. doi: 10.1210/jc.2014-v99i12-30A
28. Campbell WW, Tang M. Protein intake, weight loss, and bone mineral density in postmenopausal women.
The journals of gerontology Series A, Biological sciences and medical sciences 2010;65(10):1115-1122. doi: 10.1093/
gerona/glq083
29. Lehtonen-Veromaa M, Mottonen T, Irjala K, Nuotio I, Leino A, Viikari J. A 1-year prospective study on the relationship between physical activity, markers of bone metabolism, and bone acquisition in peripubertal girls. J Clin Endocrinol Metab 2000;85(10):3726-3732.
doi: 10.1210/jcem.85.10.6889
30. Pikkarainen E, Lehtonen-Veromaa M, Kautiainen H, Heinonen OJ, Viikari J, Mottonen T. Exercise-induced training effects on bone mineral content: a 7-year fol- low-up study with adolescent female gymnasts and runners. Scand J Med Sci Sports 2009;19(2):166-173.
doi: 10.1111/j.1600-0838.2008.00773.x
31. Cao JJ. Effects of obesity on bone metabolism. J Orthop Surg Res 2011;6:30. doi: 10.1186/1749-799X-6-30 32. Lee SK, Yoon DH, Kim J, Lee SW, Kim JY, Jee
S, H., et al. Association ofadiponectin, ghrelin, and- leptin withmetabolic syndrome and its metabolic components in Sasang constitutional type Eur J Integr Med 2018;22:16-21. doi: 10.1016/j.eujim.2018.07.007 33. Havel PJ. Update on adipocyte hormones: regulation
of energy balance and carbohydrate/lipid metabolism.
Diabetes 2004;53 Suppl 1:S143-151. doi: 10.2337/
diabetes.53.2007.s143
34. Ebina K, Fukuhara A, Shimomura I. [Role of adipocy- tokine in bone metabolism]. Clin Calcium 2008;18(5):
623-630. doi: CliCa0805623630
35. Oshima K, Nampei A, Matsuda M, Iwaki M, Fukuhara A, Hashimoto J, et al. Adiponectin increases bone mass by suppressing osteoclast and activating osteoblast.
Biochem Biophys Res Commun 2005;331(2):520-526. doi:
10.1016/j.bbrc.2005.03.210
36. Costa JL, Naot D, Lin JM, Watson M, Callon KE, Reid IR, et al. Ghrelin is an Osteoblast Mitogen and Increases Osteoclastic Bone Resorption In Vitro. Int J Pept 2011;2011:605193. doi: 10.1155/2011/605193 37. Ducy P, Amling M, Takeda S, Priemel M, Schilling
AF, Beil FT, et al. Leptin inhibits bone formation through a hypothalamic relay: a central control of bone mass. Cell 2000;100(2):197-207. doi: 10.1016/s0092- 8674(00)81558-5
38. Biver E, Salliot C, Combescure C, Gossec L, Hardouin P, Legroux-Gerot I, et al. Influence of adipokines and ghrelin on bone mineral density and fracture risk: a systematic review and meta-analysis. J Clin Endocrinol Metab 2011;96(9):2703-2713. doi: 10.1210/jc.2011- 0047
39. Liu K, Liu P, Liu R, Wu X, Cai M. Relationship between serum leptin levels and bone mineral density:
a systematic review and meta-analysis. Clin Chim Acta 2015;444:260-263. doi: 10.1016/j.cca.2015.02.040 40. Siris ES, Miller PD, Barrett-Connor E, Faulkner KG,
Wehren LE, Abbott TA, et al. Identification and frac- ture outcomes of undiagnosed low bone mineral den- sity in postmenopausal women: results from the National Osteoporosis Risk Assessment. Jama 2001;
286(22):2815-2822. doi: 10.1001/jama.286.22.2815