PAPR reduction and Pre-distortion techniques against Non-linear Distortion of Satellite WiBro
Robin Shrestha 1 , Myung Hwan Seo 2 , Gyeong Wan Go, Byung Seub Lee
ABSTRACT
A major drawback of Orthogonal Frequency Division Multiplexing (OFDM) system is high peak-to-average power ratio (PAPR) of the transmitted signal which introduces inevitable non-linear distortion in the transmission due to the amplifier non-linear property. This causes both in-band distortion and out of band spectrum re-growth. A polynomial based pre-distortion is estimated using the non-linear and inverse non-linear polynomial achieved through the Least Square Error (LSE) method. A new technique of PAPR reduction called ‘Phase Realignment’ (PR) is proposed which has a optimal effect in improving the BER performance as well as considerable reduction in the PAPR. In this paper we used the PR method along with the ‘Peak Clipping’ (PC) method is used before the pre-distortion to remove the high peak present in the non constant amplitude of the OFDM signal responsible to drive the amplifier in near saturation region for better performance of the system.
Key Words : Satellite WiBro, OFDM, LSE, Phase Realignment, Pre-distortion
1 . Introduction
The ultimate requirement of the 4 th -generation communication system is efficient implementation of wireless system with high signal dynamics, which is highly expected to be provided by the OFDM. OFDM is a multicarrier transmission technique being considered for many wireless applications. Robust against frequency selective fading [1] is the most important property of OFDM.
Due to robustness in multipath fading and high spectral utilization efficiency, OFDM has been a very attractive technique for high rate wireless communication. Many application like Digital Subscriber Loops (ADSL, VDSL), Digital Audio Broadcasting (DAB), Digital Video Broadcasting (DVB), Wireless LAN, Wireless Broadband (WiBro) and WiMax has adopted OFDM technology. However it has two major serious drawbacks namely PAPR (Peak-to-Average power ratio) problem and ICI (Inter Carrier Interference). PAPR problem is caused by Multicarrier transmission and ICI is caused by the frequency shift. High PAPR causes large
fluctuation in the input signal which results in nonlinear distortion at the RF transmitter when fed to the PA. As a result introduces both in-band distortion resulting in BER (Bit Error Rate) performance degradation and out-of-band spectrum re-growth resulting in adjacent channel interference or ICI. The efficiency of the power consumption at the transmitter becomes very poor without the use of any mitigation technique. There were many different techniques presented to mitigate the performance degradation. These are mainly classified into two categories: signal distortion and signal scrambling. Among signal distortion [2]-[6], envelop clipping is the simplest, but it introduces both in-band and out-band radiation. With signal scrambling technique, OFDM signals are modified without any distortion to present better performance but to recover the original signals correctly, side information should be provided which might reduce data efficiency.
Although several techniques have already been presented, most of them have some form of expenses either it be bandwidth or system complexity or loss of critical signal.
In this paper design of a compensation
*
1School of Information and Telecommunication Engineering, Korea Aerospace University 200-1 Hwajeon-dong Deogyang-gu Goyang-city Geonggi-do, KOREA 412-791, Email: [email protected]
2
School of Information and Telecommunication Engineering, Korea Aerospace University 200-1 Hwajeon-dong Deogyang-gu Goyang-city Geonggi-do, KOREA 412-791, mail: [email protected]
논문번호 : K3-2-4 , 접수일자 : 2008년 11 월 28일, 최종게재논문통보일자 : 2008 년 12 월 26일
technique to improve the linearity of the power amplifier is discussed along with the simple effective technique of PAPR reduction called Phase Realignment (PR) is proposed. Many models of pre-distortion were presented [10]-[12].
Also there is already pre-distorter presented with a look-up-table (LUT)-based implementation which has disadvantage with quantization noise caused by the limited size and a high implementation time required. Here an adaptive pre-distortion scheme in a system with TWT (Travelling Wave Tube) high power amplifier (HPA) has been presented [7]. The odd polynomial of degree seven is used to model HPA for analysis. Inverse of the non-linear amplifier was computed in the form of the polynomial for generating the linearly amplified signal at the HPA output [9]. Both the non-linear and inverse non- linear functions are estimated using LSE criteria.
The pre-distorter function adaptively mitigates the non-linearity of the HPA as the feedback from the HPA output is used to create it along with the set of input.
With the application of pre-distortion function of the non-linear PA we are able to make the overall system linear but the input signal will still have the high peak, thus will not insure that the high power amplifier is not driven in the saturation region. The PA should be avoided to be driven in the saturation region as it also introduces the performance degradation and even burn out the transponder which is very critical in the satellite communication system. The failure of the transponder leads to the failure of the satellite system. A new scheme of PAPR reduction, PR is proposed which is implemented along with Peak Clipping (PC). In this method we first perform clipping of the high peaks at clipping level. The clipping level is determined by setting the appropriate clipping ratio (CR). After performing the PC the phase of the peak clipped signal are re aligned to its original phase. The amplitude lower than certain threshold is raised to the threshold and the remaining are left untouched.
2. OFDM System Model
An input set of data bits [ b b b
1...
2 3b
M] to the OFDM system is modeled using the QAM
(Quadrature Amplitude Modulation) or PSK (Phase Shift Keying) to the baseband symbol.
N such modulated symbols i.e.
( (0), X X (1), X (2),... ( X N − 1)) are packed together at the input of the IFFT block using a serial to parallel converter.
The OFDM signal in the time domain is generated by IFFT operation as shown below,
2 ( 1)( 1)/
1
( ) ( ) ( ) 1 ( ) [1,2, ]
N
j k n N
r i
k
x n x n jx n X k e for k N
N
π − −
=
= + = ∑ = L
(1)
The guard interval is considered as Cyclic Prefix equal to 25% of the length of OFDM symbol.
Normally N is taken very large, so according to central limit theorem, the amplitude of an OFDM signal has Rayleigh distribution. The PAPR can be obtained by
2 2
| ( ) |
, [1, ] [| ( ) | ]
max x n
PAPR n N
ε x n
= ∈
(2)
Where {} ε ⋅ denotes the expectation.
Finally, we get the analog signal after DAC as,
( ( ))
( ) Re[ ( )
j ct t]
x t % = x t e
ω +φ(3)
with the amplitude and phase of the input signal, fed to the HPA for RF transmission.
The high PAPR of OFDM signal requires a very good linear transmission of the signal. Power amplifiers are typically the most power-hungry components of RF transceivers. The design of PAs, especially for linear, low-voltage operations, remains a difficult problem defying an elegant solution.
TWTA for high power satellite communications and SSPA for several other communication systems (especially mobile systems), are the two types of PAs used for communication systems.
The complex output of RF with non-linear distortion can be expressed as
{ ( ) ( ( ))}
( ) { ( )} j t t
X t % = A ρ t e ϕ + φ ρ (4)
Where ρ ( ) t and ϕ ( ) t are amplitude and
phase of the input signal. A ( ) ρ and
φ ρ ( ) are AM/AM and AM/PM conversion of the non-linear distortion.
3. Proposed Scheme
Although the compensation method proposed in [7] has quite achieved the performance enhancement however there was a overhead of sending the reference signal in order to achieve the enhance performance. Since the reference signal has to be transmitted along with the OFDM signal, there is a limitation in the data transmission to some extent. To overcome this problem we proposed the new technique of PAPR reduction (PR). The result also showed that the performance of the proposed technique is much better even without any reference signal. Here in this paper we used the PR method in conjunction with adaptive pre-distorter for TWTA non-linear distortion of satellite WiBro.
Equation (4) gives us a simple model for analysis but further we will use a memory-less polynomial to capture the non-linear characteristics of the transmitter, regardless of the PA type as the inverse of (4) is not easy to solve. The polynomial is written as,
0 1
0 0
( ) ( ) ( ) ( )
P P
i k
i k
i k
y t α x t α α x t α x t
= =
= ∑ = + + ∑
(5)
Where x t and ( ) y t are input and output of ( ) the nonlinear amplifier respectively. α
0represents the DC offset, α
1is the linear scalar, { α
2,... α
p} contribute to non-linearity in the system and P is the highest order of the system. For the sake of simulation, we used the seventh order odd polynomial for representing the non-linear PA [13]
in this paper, i.e. the coefficients α α α
0,
2,
4and α
6are set to zero and remaining α α α
1,
3,
5and α
7were set carefully having positive and negative values alternately. Fig.1. depicts the input/output curve of the polynomial. Here we have only considered AM/AM conversion for the simulation.
Furthermore it will be shown that this model provides several conveniences in estimation and compensation. We used the discrete formulation by assuming that we already get the samples of both x t and ( ) y t in (5). The combinational effect ( )
of various block in the system causing non- linearity are considered for determining the polynomial coefficient. As a result the overall non- linearity for cascade non-linear systems
2 1
(... ( ( ))...)
f
Nf f x was determined, represented as ( ) f x .The pre-distorter schemes consist of two stages: the estimation stage and the compensation stage for the actual signal.
Figure 1: AM/AM response of TWTA
3.1. LS Estimation of Non-linearity
We used a training sequence with sufficient dynamic range to probe the non-linearity. The training sequence is carefully chosen to cover the dynamic range of the PA. A feedback of the RF output to the base-band with this sequence is sampled,
0
( ) ( )
in n
P
i
y f x x t
=
= = ∑
(6)
The signal vectors of N ×1 are defined,
1 2
[ ... ]
Tt N
Y = y y y is the feedback vector of the RF output, X
t= [ x x
12
... x
N]
Tis the input training sequence vector and non-linear polynomial coefficient vector and α = α α α α [
0 1 2...
p]
T. Now, the above equation (6) can be represented in matrix formulation as,
t t
Y = X ∗ α (7)
Where X is a Vandermonde matrix of N
t× , P
each element of which is calculated as,
,
1
, [1, ], [1, ]
i j j
t i
X = x
−i ∈ N j ∈ P
(8)
Finally, the Least Square estimation of the non-linear PA can be represented by the polynomial coefficients which can be computed as below,
[ X
tHX
t]
1X
tHY
tα & =
−∗ (9)
The term X
tHin the above equation denotes the Hermitian of the Vandermonde matrix ( X ). Hermitian is simply the conjugate and
ttranspose of a matrix. Thus the optimal estimation of the non-linearity can be achieved by using the estimated coefficients α & .
3.2. Pre-distorter
Sample-by-sample pre-distortion is performed by feeding the base band digital signal to the processer. The main objective pre-distortion is to make the overall effect of RF output linear. Here we intend to find such function. Let us suppose a function g(x) to be the another polynomial of order Q such that, it would pre-distort the input signal as,
0
( ) ( ( )) ( )
Q i i i
x n g x n β x n
=
= = ∑
(
(10)
So if x n ( ( ) is passed through the PA the output should be linearly scaled. That is,
1
0 0 0
( ) ( ( )) ( ) ( )
Q P Q
P
j i k
i j k
i j k
y n β x n
+γ x n x n
= = =
= ∑ ∑ α = ∑ ≈ α
%
(11)
with γ
krepresenting both α and
iβ .
iFor determining the solution f
−1( ) y is fitted by another Q order polynomial from training data,
1
0
( ) ( ( )) ( ( )) ( )
Q i
t t t i t
i
x n f
−y n l y n λ y n
=
= = = ∑
(12)
Similarly, we get the solution as,
[ Y Y
tH t]
−1Y
tHX
t∧ = & ∗ (13)
with Y t as Vandermonde matrix of the output and Y
tHas the Hermitian of Y .
tλ = [λ λ λ ]
0 1...
Qis the estimated inverse non-linearity coefficient
vector.
Now, form equation (10), (11) & (12) we get the solution of g(x),
1
1
0 0
( ( )) ( ( )) ( ) ( ) 1
Q Q
i i i
i i
i i
g x n f y n x n x n
λα β n
−
= =
= % = ∑ = ∑
(14)
Therefore, β i = λα i 1 i creates the pre- distorter function g(x).
3.3. Phase Realignment (PR)
Before the PR process, the OFDM signal is first clipped in order to reduce the Peak with the appropriate clipping level determined by using the Clipping Ratio (CR) which is the ratio of the clipping level power and the average power.
(
clp)
avgClipping level l = CR P ∗ (15) Clipping of the peak is followed by the filtering process to remove possible Out of Band (OOB) radiation. The clipping of the OFDM signal reduces the high PAPR but introduces the extra distortion which leads to the degradation in BER performance. Thus the role of the PR comes.
After the peak clipping, the phase of the clipped signal changed back to its original state and the magnitude is restricted along certain threshold i.e.
magnitude lower than the threshold are scaled up to the level of threshold and others are left untouched.
The discrete time domain peak clipped OFDM signal can be represented as,
( ) ( )
clp( )
clp clp
j n
e
x n = ρ n ϕ (16)
Where ρ clp ( ) n and ϕ clp ( ) n are the
magnitude and phase of the clipped signal respectively. Now, the phase ϕ clp ( ) n is
realigned to its original position as it was before peak clipping, for this we first set the possible phase to the array of phase. We assume QAM/QPSK for this case,
(17)
(18)
And the amplitude lower than ρ th are scaled up to it,
, ( )
( ) ( ),
th clp th
pr
clp
if n
n n else
ρ ρ ρ
ρ ρ
⎧⎪ <
= ⎨ ⎪⎩
(19)
Thus forming the Phase Realigned signal as,
( ) ( )
pr( )
pr pr
j n
e
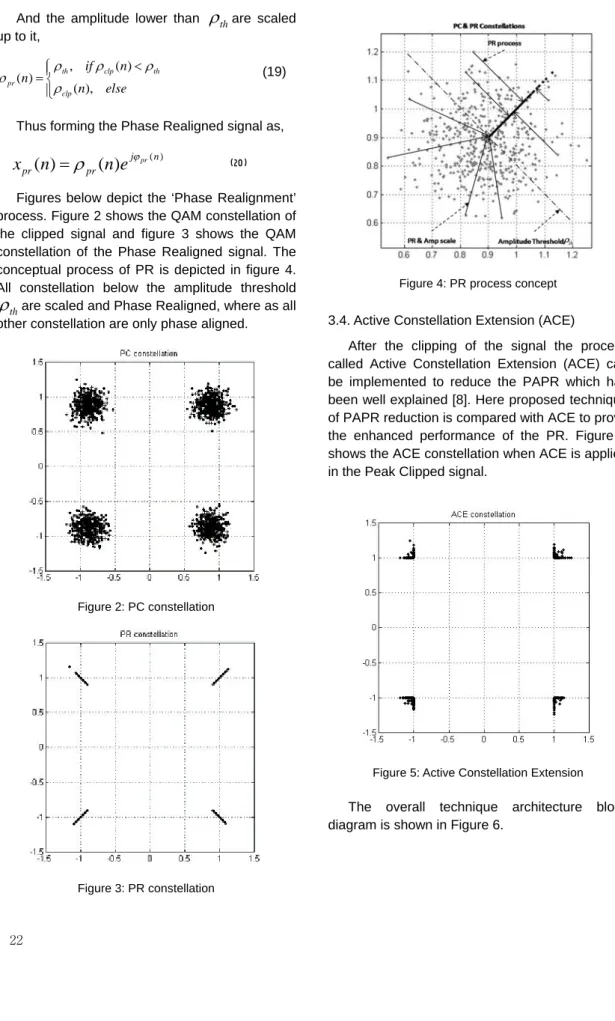
x n = ρ n ϕ (20) Figures below depict the ‘Phase Realignment’
process. Figure 2 shows the QAM constellation of the clipped signal and figure 3 shows the QAM constellation of the Phase Realigned signal. The conceptual process of PR is depicted in figure 4.
All constellation below the amplitude threshold
ρ th are scaled and Phase Realigned, where as all other constellation are only phase aligned.
Figure 2: PC constellation
Figure 3: PR constellation
Figure 4: PR process concept
3.4. Active Constellation Extension (ACE)
After the clipping of the signal the process called Active Constellation Extension (ACE) can be implemented to reduce the PAPR which has been well explained [8]. Here proposed technique of PAPR reduction is compared with ACE to prove the enhanced performance of the PR. Figure 5 shows the ACE constellation when ACE is applied in the Peak Clipped signal.
Figure 5: Active Constellation Extension
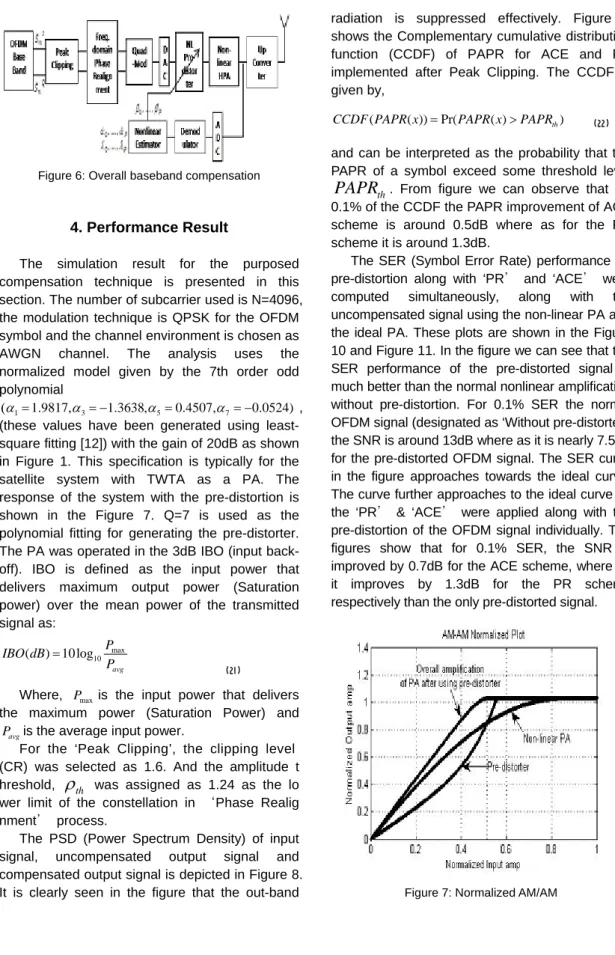
The overall technique architecture block
diagram is shown in Figure 6.
Figure 6: Overall baseband compensation
4. Performance Result
The simulation result for the purposed compensation technique is presented in this section. The number of subcarrier used is N=4096, the modulation technique is QPSK for the OFDM symbol and the channel environment is chosen as AWGN channel. The analysis uses the normalized model given by the 7th order odd polynomial
1
1.9817,
31.3638,
50.4507,
70.0524)
α α α α
( = = − = = − ,
(these values have been generated using least- square fitting [12]) with the gain of 20dB as shown in Figure 1. This specification is typically for the satellite system with TWTA as a PA. The response of the system with the pre-distortion is shown in the Figure 7. Q=7 is used as the polynomial fitting for generating the pre-distorter.
The PA was operated in the 3dB IBO (input back- off). IBO is defined as the input power that delivers maximum output power (Saturation power) over the mean power of the transmitted signal as:
max
( ) 10log
10 avgIBO dB P
= P
(21)
Where, P
maxis the input power that delivers the maximum power (Saturation Power) and
P
avgis the average input power.
For the ‘Peak Clipping’, the clipping level (CR) was selected as 1.6. And the amplitude t hreshold, ρ th was assigned as 1.24 as the lo wer limit of the constellation in ‘Phase Realig nment’ process.
The PSD (Power Spectrum Density) of input signal, uncompensated output signal and compensated output signal is depicted in Figure 8.
It is clearly seen in the figure that the out-band
radiation is suppressed effectively. Figure 9 shows the Complementary cumulative distribution function (CCDF) of PAPR for ACE and PR implemented after Peak Clipping. The CCDF is given by,
( ( )) Pr( ( )
th)
CCDF PAPR x = PAPR x > PAPR (22) and can be interpreted as the probability that the PAPR of a symbol exceed some threshold level
PAPR th . From figure we can observe that for 0.1% of the CCDF the PAPR improvement of ACE scheme is around 0.5dB where as for the PR scheme it is around 1.3dB.
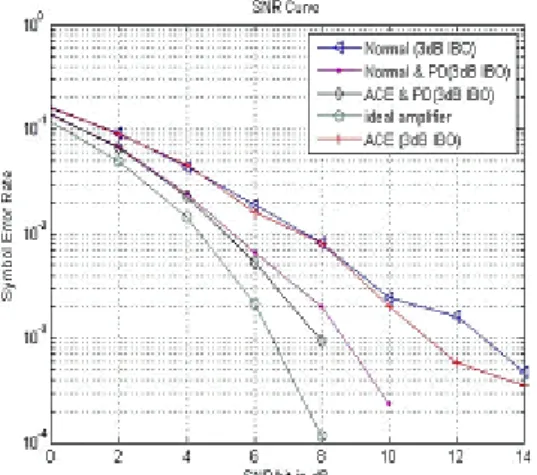
The SER (Symbol Error Rate) performance for pre-distortion along with ‘PR’ and ‘ACE’ were computed simultaneously, along with the uncompensated signal using the non-linear PA and the ideal PA. These plots are shown in the Figure 10 and Figure 11. In the figure we can see that the SER performance of the pre-distorted signal is much better than the normal nonlinear amplification without pre-distortion. For 0.1% SER the normal OFDM signal (designated as ‘Without pre-distorter’) the SNR is around 13dB where as it is nearly 7.5dB for the pre-distorted OFDM signal. The SER curve in the figure approaches towards the ideal curve.
The curve further approaches to the ideal curve as the ‘PR’ & ‘ACE’ were applied along with the pre-distortion of the OFDM signal individually. The figures show that for 0.1% SER, the SNR is improved by 0.7dB for the ACE scheme, where as it improves by 1.3dB for the PR scheme respectively than the only pre-distorted signal.
Figure 7: Normalized AM/AM
Figure 8: Power Spectrum Density
Figure 9: BER and CCDF of PAPR for ACE and PR
Figure 10: BER curve with PR and Pre-distortion
Figure 11: BER curve with ACE and Pre-distortion