Differences in Urine Cadmium Associations with Renal Damage Markers According to the Adjustment with Specific Gravity or Urinary Creatinine
Yong-Dae Kim1*, Sang-Yong Eom1, Dong-Hyuk Yim1, Soon Kil Kwon2, Choong-Hee Park3, Guen-Bae Kim3, Seung-Do Yu3, Byung-Sun Choi4, Jung-Duck Park4 and Heon Kim1
1Department of Preventive Medicine, Chungbuk National University, Cheongju 28644, Korea
2Department of Internal Medicine, College of Medicine, Chungbuk National University, Cheongju 28644, Korea
3Environmental Health Research Division, Environmental Health Research Department, National Institute of Environmental Research, Incheon 22689, Korea
4Department of Preventive Medicine, Chung-Ang University, Seoul 06974, Korea
Received January 3, 2019 /Revised February 18, 2019 /Accepted February 18, 2019
In general, specific gravity (SG) and urinary creatinine (CR) have been used to adjust urinary cad- mium (Cd) concentrations. However, the validity of correction methods has been controversial. We compared the two adjustments to evaluate associations between urinary Cd and various renal damage markers and to evaluate the relationship between urinary Cd concentration and renal disease markers, such as estimated glomerular filtration rate (eGFR), in a relatively large general population sample.
Among the 1,086 volunteers who were enrolled in this study, 862 healthy volunteers who did not have kidney disease were included in the final analysis. Urinary Cd, malondialdehyde (MDA), and N-acetyl-β-D-glucosaminidase (NAG) concentrations were measured, the creatinine-based eGFR was calculated, and the relationships between these markers were subsequently analyzed. This study showed the use of urinary Cd concentration adjusted with SG rather than with urinary creatinine may be appropriate in studies evaluating renal function based on Cd exposure. Urinary Cd concentration adjusted with SG had a positive correlation with urinary MDA levels and a negative correlation with eGFR. This relationship was relatively stronger in women than in men. This study showed that uri- nary Cd level was associated with decreased eGFR in the general population, and oxidative stress was likely to act as an intermediator in this process. These results suggest that eGFR can be a very good indicator of kidney damage caused by Cd exposure in the general population.
Key words : Creatinine adjustment, estimated glomerular filtration rate, malondialdehyde, urinary cadmium
*Corresponding author
*Tel : +82-43-261-2845, Fax : +82-43-274-2965
*E-mail : [email protected]
This is an Open-Access article distributed under the terms of the Creative Commons Attribution Non-Commercial License (http://creativecommons.org/licenses/by-nc/3.0) which permits unrestricted non-commercial use, distribution, and reproduction in any medium, provided the original work is properly cited.
Journal of Life Science 2019 Vol. 29. No. 2. 265~271 DOI : https://doi.org/10.5352/JLS.2019.29.2.265
Introduction
Cadmium (Cd) is a widely distributed metal and its ex- posure occurs via various foods, water, or tobacco, as well as ambient air [11, 16]. Most of the absorbed Cd in the body accumulates in the kidney and liver [7, 11]. As the amount of Cd excreted in the urine is very small (approximately 0.001% of the body's weight is excreted per day), it has a long half-life of more than 20 years in the body [2, 3]. Cd accumulated in the liver promotes the synthesis of metal-
lothionein (MT), which is a high-affinity metal-binding pro- tein in the body. The Cd-MT complex is excreted from the liver, transported to the kidney, and then reabsorbed and degraded into highly toxic Cd2+ ions in the proximal tubules [14]. Free Cd ions are known to cause microscopic tubule damage, an asymptomatic condition [3, 10]. Cd-induced re- nal tubule damage generally increases the urinary excretion of intracellular tubular enzymes such as N-acetyl-β-D-gluco- saminidase (NAG) as well as low molecular weight proteins such as β2-microglobulin (β2-MG) [2, 6, 13]. However, con- tinued renal tubule damage by chronic exposure to Cd can lead to typical kidney damage such as decreased glomerular filtration rate (GFR) [4].
GFR is often used as a renal damage marker for Cd ex- posure because GFR is a very good indicator of kidney func- tion in healthy people. The gold standard of GFR is directly measured by evaluating the clearance of exogenous filtration markers, but an endogenous marker such as serum crea-
tinine is also used for estimation [15].
Several recent studies have reported that environmental or occupational Cd exposure could be associated with renal damage of decreased GFR [4, 5]. However, there are some reports that there is no relationship between the two markers [6]. Hence, further research is warranted.
For the evaluation of urinary Cd levels, many researchers generally use an adjusted value with urinary creatinine (CR) concentration to reduce the effect of hydration. However, there is also an opinion that CR adjustment can induce addi- tional error because CR concentration is influenced not only by individual muscle mass but also by age, sex, meat intake, and exercise, among others [12, 17]. Specific gravity (SG) of urine is an alternative method even it is not widely used.
In this study, we evaluated the association between urinary Cd exposure and several renal damage markers including eGFR in general population, and compared SG and CR cor- rection method on their relationships.
Materials and Methods Study population
The subjects of this study were healthy people over 30 years old residing in Seocheon-gun, Chungcheongnam-do.
Some of them lived near the Janghang smelter, which was established in 1936 in the town of Janghang and smelted copper (Cu), lead (Pb), and tin (Sn) until 1989. Hence, the subjects had relatively high exposure to environmental Cd.
Informed consent was obtained from all participants and demographic information, including occupation and smok- ing history, was obtained through a questionnaire survey conducted by skilled interviewers. Blood and urine samples were collected and stored at -80℃ until analysis. A total of 1,086 people (456 males and 630 females) were enrolled in the study. Among them, 224 persons with diabetes or other renal diseases were excluded and 862 persons (368 males, 494 females) were finally analyzed.
The study protocol was approved by the Chungbuk National University Institutional Review Board (CBNU-IRB- 2011-BQ02).
Determination of cadmium concentration in urine The concentration of Cd in urine was analyzed as pre- viously described by Subramanian et al [18]. In brief, urine was added to nitric acid and diluted with diammonium hy-
drogen phosphate and 1% Triton X-100; this was then mixed vigorously. Detection of Cd in the solution was performed by a flameless atomic absorption spectrophotometer (Model Z-8270; Hitachi, Tokyo, Japan) equipped with a Zeeman graphite furnace. The urine detection of limit (LOD) was 0.1 μg/l. For 11 samples that showed urinary Cd level below LOD, we used the method of replacing nondetectable values with the LOD divided by the square root of 2.
Determination of N-acetyl-β-D-glucosaminidase (NAG) activity and malondialdehyde (MDA) in urine
NAG activity in urine was measured using a commercial kit (NAG Quantitative Kit, Shionogi, Osaka, Japan) accord- ing to the manufacturers’ instructions. In short, a synthetic substrate solution (1 ml) was preincubated at 37℃ for 5 min.
The supernatant of the urine samples (50 ml) obtained by centrifuging was mixed with a warm synthetic substrate sol- ution and the mixture was then incubated in a 37℃ water bath for 15 min. The stopping solution (2 ml) was then add- ed and mixed thoroughly. The fluorescence intensities of the samples and the NAG standard solution were measured at 580 nm using a spectrophotometer. Urinary NAG activity was corrected using the urinary creatinine concentration, which was determined by the modified Jaffe reaction method.
The serum creatinine level was determined by the Jaffe method to estimate the GFR. The estimated GFR (eGFR) was calculated using the Modification of Diet in Renal Disease (MDRD) formula [eGFR = 175× serum creatinine -1.154 × age-0.203 ×0.742 (if female)] [15].
The concentration of malondialdehyde (MDA) in the urine as a marker of oxidative stress was determined using a high-performance liquid chromatographic system with a fluorescence detector [1].
Statistical analyses
Statistical analyses were performed using SPSS version 24.0 (SPSS Inc., Chicago, IL, USA). Urinary Cd, NAG and MDA levels, and eGFR were transformed to a lognormal distribution because the distributions were right skewed.
Statistical comparisons of means were performed using Student’s t-tests, and Pearson correlation coefficients were used to evaluate the relationship between variables. Linear logistic regression was applied to identify determinants on eGFR level. Statistical significance was set at p<0.05.
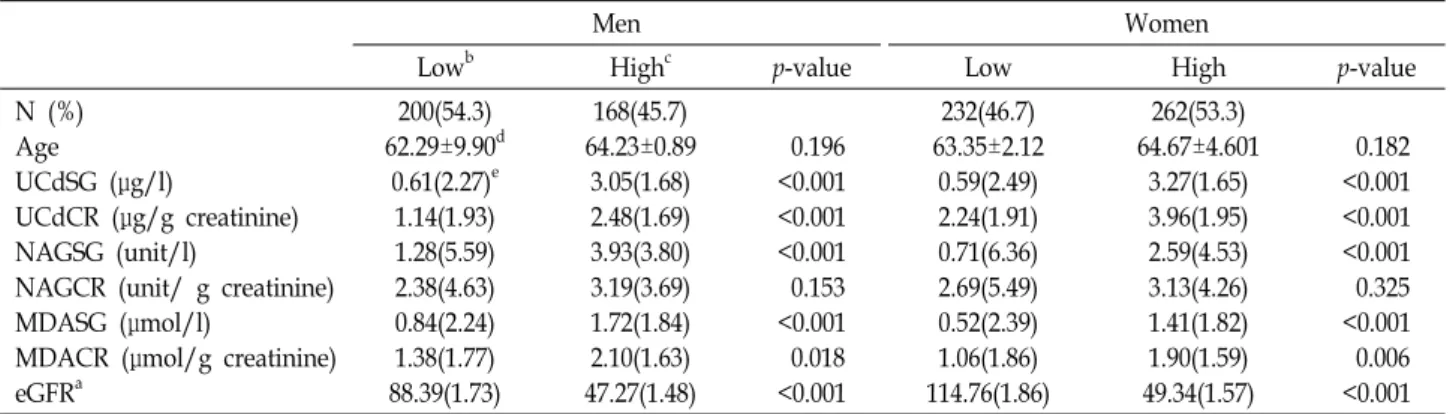
Table 1. Characteristics of subjects and their biological parameters according to the gender and urinary cadmium level
Men Women
Lowb Highc p-value Low High p-value
N (%) Age
UCdSG (μg/l)
UCdCR (μg/g creatinine) NAGSG (unit/l)
NAGCR (unit/ g creatinine) MDASG (μmol/l)
MDACR (μmol/g creatinine) eGFRa
200(54.3) 62.29±9.90d
0.61(2.27)e 1.14(1.93) 1.28(5.59) 2.38(4.63) 0.84(2.24) 1.38(1.77) 88.39(1.73)
168(45.7) 64.23±0.89
3.05(1.68) 2.48(1.69) 3.93(3.80) 3.19(3.69) 1.72(1.84) 2.10(1.63) 47.27(1.48)
0.196
<0.001
<0.001
<0.001 0.153
<0.001 0.018
<0.001
232(46.7) 63.35±2.12
0.59(2.49) 2.24(1.91) 0.71(6.36) 2.69(5.49) 0.52(2.39) 1.06(1.86) 114.76(1.86)
262(53.3) 64.67±4.601
3.27(1.65) 3.96(1.95) 2.59(4.53) 3.13(4.26) 1.41(1.82) 1.90(1.59) 49.34(1.57)
0.182
<0.001
<0.001
<0.001 0.325
<0.001 0.006
<0.001 UCdSG; Specific gravity adjusted urinary cadmium level, UCdCR; creatinine adjusted urinary cadmium level, NAGSG; Specific gravity adjusted urinary N-acetyl-β-D-glucosaminidase level, NAGCR; Creatinine adjusted urinary N-acetyl-β-D-glucosaminidase level, MDASG; Specific gravity adjusted urinary malondialdehyde level, MDACR; creatinine adjusted urinary malondialdehyde level, eGFR; estimated glomerular filtration rate
aeGFR = [175× serum creatinine -1.154 × age-0.203 ×0.742 (if female)], bLess than median urinary cadmium level (1.59 μg/l), cMore than median urinary cadmium level, dArithmetic mean±standard deviation, eGeometric mean (geometric standard deviation)
Table 2. Pearson correlation coefficients between logarithmic urinary cadmium (Cd) level and urinary malondialdehyde (MDA), N-acetyl-β-D-glucosaminidase (NAG), and estimated glomerular filtration rate (eGFR)
Log (UCdSG) Log (UCdCR) Log (MDASG) Log (MDACR) Log (NAGSG) Log (NAGCR) Log (eGFR) Log (UCdSG)
Log (UCdCR) Log (MDASG) Log (MDACR) Log (NAGSG) Log (NAGCR) Log (eGFR)
1 0.608a
1
0.678a -0.006 1
0.572a 0.030 0.945a
1
0.485a 0.132a 0.440a 0.361a
1
0.133a 0.198a 0.014 0.011 0.866a
1
-0.752a -0.041 -0.775a -0.689a -0.469a -0.015
1 UCdSG; Specific gravity adjusted urinary cadmium level, UCdCR; creatinine adjusted urinary cadmium level, NAGSG; Specific gravity adjusted urinary N-acetyl-β-D-glucosaminidase level, NAGCR; Creatinine adjusted urinary N-acetyl-β-D-glucosaminidase level, MDASG; Specific gravity adjusted urinary malondialdehyde level, MDACR; creatinine adjusted urinary malondialdehyde level, eGFR; estimated glomerular filtration rate
aRepresents p<0.001 in Pearson correlation analysis
Results and Discussion
The subjects were divided into two groups according to the median of urinary Cd concentration (<1.59 μg/l, low group or >1.59 μg/l, high group). The demographic charac- teristics and biomarker levels of the subjects were compared between two groups according to gender (Table 1). The age was slightly higher in the high group than in the low group although there was no statistical significance. The urinary SG adjusted NAG concentration was significantly higher in the high group than in the low group in both genders.
However, there was no statistically significant difference of urinary CR adjusted NAG concentration between the groups in both genders. Urinary SG adjusted MDA concentration in the low group was significantly lower than in the high
group. MDA concentration adjusted with urinary CR showed the same trend as SG. The eGFR values were almost half in the high group than in the low group for both sexes.
Table 2 shows the relationships between urinary Cd, MDA concentration, NAG activity, and eGFR with SG or CR adjustment. The urinary SG adjusted Cd concentration showed a high correlation with urinary SG adjusted MDA level (R=0.678, p<0.001) and urinary SG adjusted NAG activ- ity (R=0.485, p<0.001). In addition, it showed a very high negative correlation with eGFR (R=-0.752, p<0.001). Howev- er, urinary Cd concentration with CR adjustment did not show correlation with urinary MDA and showed very little or no correlation with urinary NAG and eGFR. The eGFR values had a significant correlation with urinary SG adjusted MDA and SG adjusted NAG level of R = -0.775(p<0.001) and
A B
C D
E F
Fig. 1. Association between logarithmic urinary cadmium level and urinary malondialdehyde (MDA), N-acetyl-β-D-glucosaminidase (NAG), and estimated glomerular filtration rate (eGFR) according to the gender. A, C, E in men; B, D, F in women R = 0.440 (p<0.001), respectively, suggesting that eGFR can
be a good indicator of renal tubular injury and oxidative stress induced by Cd exposure. These results also suggest a possibility that chronic Cd exposure may induce decreased GFR by generating oxidative stress in the body. Fig. 1 is a scatter plot showing the relationship between log-trans-
formed urinary SG adjusted Cd, MDA levels and eGFR, stratified according to gender. The relationships among uri- nary Cd, MDA, and eGFR were significant in both men and women, but they were relatively stronger in women than in men. The Pearson correlation coefficients between urinary Cd and eGFR were -0.744 in men and -0.789 in women, and
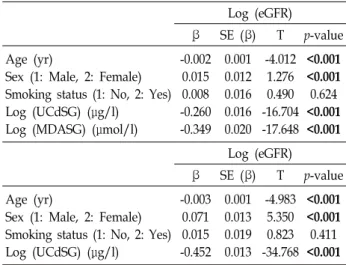
Table 3. General linear model for changes in logarithmic eGFR Log (eGFR)
β SE (β) T p-value
Age (yr)
Sex (1: Male, 2: Female) Smoking status (1: No, 2: Yes) Log (UCdSG) (μg/l)
Log (MDASG) (μmol/l)
-0.002 0.015 0.008 -0.260 -0.349
0.001 0.012 0.016 0.016 0.020
-4.012 1.276 0.490 -16.704 -17.648
<0.001
<0.001 0.624
<0.001
<0.001 Log (eGFR)
β SE (β) T p-value
Age (yr)
Sex (1: Male, 2: Female) Smoking status (1: No, 2: Yes) Log (UCdSG) (μg/l)
-0.003 0.071 0.015 -0.452
0.001 0.013 0.019 0.013
-4.983 5.350 0.823 -34.768
<0.001
<0.001 0.411
<0.001 UCdSG; Specific gravity adjusted urinary cadmium level, UCdCR; creatinine adjusted urinary cadmium level, MDASG;
Specific gravity adjusted urinary malondialdehyde level, eGFR;
estimated glomerular filtration rate
those between urinary Cd and urinary MDA were 0.653 in men and 0.739 in women. The coefficients between urinary MDA and eGFR was -0.760 in men and -0.811 in women.
In most studies, urinary Cd levels were reported to be higher in women than in men [5, 6, 13]. The present study also showed a similar result.
In general, because urine dilution or concentration creates corresponding changes in urine solute concentrations, when evaluating the concentration of urinary metabolites or heavy metals, many researchers have used the urinary CR adjusted urine solute as the final concentration. To do that, we should assume that the rate of CR clearance is constant for each person after CR is produced from muscle, which is then re- leased into the bloodstream and finally excreted into the urine. However, some researchers insist that because the fi- nal metabolism of the muscle metabolite is influenced not only by individual muscle mass but also by age, gender, meat intake, and exercise among other factors, the way to reduce additional error is to use SG rather than urinary CR [12, 17]. In this study, almost all urinary markers showed a high correlation with SG rather than CR adjustment. These results raise questions about the usefulness of urinary CR adjustment for evaluation of urinary solute.
Some previous studies on the relationship between Cd exposure and GFR showed significant relevance [4, 5], but some showed no relevance [6, 19]. One possible explanation for this discrepancy between studies may be due to the pres- ence or absence of CR adjusted urinary Cd concentrations.
In studies that showed a significant negative correlation be- tween these, Cd in the blood or SG adjusted urinary Cd con- centration were used instead of CR adjusted urinary Cd, whereas in studies that showed no association between them, CR adjusted urinary Cd concentrations were used. In the present study, lower eGFR levels were associated with CR adjusted Cd than with SG adjusted Cd level. In other words, these results suggest that it may not be appropriate to use CR adjustment in studies for urinary Cd. As urinary CR level is closely related to the GFR and correlates with serum creatinine concentration, the adjustment of urinary Cd concentration with urinary CR may be a factor that alters the relationship between urinary Cd concentration and se- rum CR-based eGFR. These results are consistent with the several studies that have suggested the inadequacy of correc- tion of creatinine in the assessment of urinary metabolites [8, 9, 12, 17].
The mechanism by which Cd exposure reduces the GFR is unclear. In the present study, urinary Cd concentration was significantly associated with urinary MDA concen- tration, and urinary MDA concentration and eGFR had a negative correlation, suggesting that MDA may be involved in urinary Cd-induced glomerular damage. To investigate the effect of urinary MDA concentration as a confounding factor on urinary Cd concentration and eGFR, multiple line- ar regression analyses with or without MDA concentration were performed. In both regression models with and with- out urinary MDA concentrations, urinary Cd concentration was found to be a significant determinant of eGFR, which suggests that urinary MDA concentration was not a con- founding factor but an intermediator.
In conclusion, this study showed that urinary Cd level is associated with decreased GFR in the general population, and oxidative stress is likely to act as an intermediator in this process. These results suggest that eGFR can be a very good indicator of kidney damage caused by Cd exposure in general population. Furthermore, this study suggests that the use of urinary Cd concentrationadjusted with SG rather than the CR adjusted value may be appropriate in studies evaluating renal function based on Cd exposure.
Acknowledgement
This study was supported by grants from Seocheon County and from the National Institute of Environmental Research, Republic of Korea.
References
1. Agarwal, R. and Chase, S. D. 2002. Rapid, fluorimetric-liquid chromatographic determination of malondialdehyde in bio- logical samples. J. Chromatogr. B Analyt. Technol. Biomed. Life Sci. 775, 121-126.
2. Bernard, A. 2004. Renal dysfunction induced by cadmium:
biomarkers of critical effects. Biometals 17, 519-523.
3. Bernard, A. 2008. Cadmium & its adverse effects on human health. Indian J. Med. Res. 128, 557-564.
4. Buser, M. C., Ingber, S. Z., Raines, N. and Fowler, D. A., Scinicariello, F. 2016. Urinary and blood cadmium and lead and kidney function: NHANES 2007-2012. Int. J. Hyg.
Environ. Health 219, 261-267.
5. Chung, S., Chung, J. H., Kim, S. J., Koh, E. S., Yoon, H.
E., Park, C. W., Chang, Y. S. and Shin, S. J. 2014. Blood lead and cadmium levels and renal function in Korean adults. J. Clin. Exp. Nephrol. 18, 726-734.
6. Eom, S. Y., Seo, M. N., Lee, Y. S., Park, K. S., Hong, Y. S., Sohn, S. J., Kim, Y. D., Choi, B. S., Lim, J. A., Kwon, H.
J., Kim, H. and Park, J. D. 2017. Low-level environmental cadmium exposure induces kidney tubule damage in the general population of Korean adults. Arch. Environ. Contam.
Toxicol. 73, 401-409.
7. Godt, J., Scheidig, F., Grosse-Siestrup, C., Esche, V., Bran- denburg, P., Reich, A. and Groneberg, D. A. 2006. The tox- icity of cadmium and resulting hazards for human health.
J. Occup. Med. Toxicol. 1, 22.
8. Haddam, N., Samira, S., Dumont, X., Taleb, A., Lison, D., Haufroid, V. and Bernard, A. 2011. Confounders in the as- sessment of the renal effects associated with low-level uri- nary cadmium: an analysis in industrial workers. Environ.
Health 10, 37.
9. Ikeda, M., Ezaki, T., Tsukahara, T., Moriguchi, J., Furuki, K., Fukui, Y., Okamoto, S., Ukai, H. and Sakurai, H. 2003.
Bias induced by the use of creatinine-corrected values in evaluation of beta2-microgloblin levels. Toxicol. Lett. 145, 197-207.
10. Jarup, L. and Akesson, A. 2009. Current status of cadmium as an environmental health problem. Toxicol. Appl. Pharmacol.
238, 201-208.
11. Jarup, L., Berglund, M., Elinder, C. G., Nordberg, G. and Vahter, M. 1998. Health effects of cadmium exposure--a re- view of the literature and a risk estimate. Scand. J. Work Environ. Health 24, 1-51.
12. Jatlow, P., McKee, S. and O'Malley, S. S. 2003. Correction of urine cotinine concentrations for creatinine excretion: is it useful? Clin. Chem. 49, 1932-1934.
13. Kim, Y. D., Yim, D. H., Eom, S. Y., Moon, S. I., Park, C.
H., Kim, G. B., Yu, S. D., Choi, B. S., Park, J. D. and Kim, H. 2015. Temporal changes in urinary levels of cadmium, N-acetyl-β-d-glucosaminidase and β2-microglobulin in in- dividuals in a cadmium-contaminated area. Environ. Toxicol.
Pharmacol. 39, 35-41.
14. Klaassen, C. D., Liu, J. and Diwan, B. A. 2009. Metallothionein protection of cadmium toxicity. Toxicol. Appl. Pharmacol. 238, 215-220.
15. Levey, A. S., Coresh, J., Greene, T., Marsh, J., Stevens, L.
A., Kusek, J. W. and Van Lente, F. 2007. Expressing the modification of diet in renal disease study equation for esti- mating glomerular filtration rate with standardized serum creatinine values. Clin. Chem. 53, 766-772.
16. Nordberg, G., Jin, T., Wu, X., Lu, J., Chen, L., Liang, Y., Lei, L., Hong, F., Bergdahl, I. A. and Nordberg, M. 2012.
Kidney dysfunction and cadmium exposure--factors influ- encing dose-response relationships. J. Trace Elem. Med. Biol.
26, 197-200.
17. Schisterman, E. F., Cole, S. R. and Platt, R. W. 2009. Overad- justment bias and unnecessary adjustment in epidemiologic studies. Epidemiology 20, 488-495.
18. Subramanian, K. S., Meranger, J. C. and MacKeen, J. E. 1983.
Graphite furnace atomic absorption spectrometry with ma- trix modification for determination of cadmium and lead in human urine. Anal. Chem. 55, 1064-1067.
19. Weaver, V. M., Vargas, G. G., Silbergeld, E. K., Rothenberg, S. J., Fadrowski, J. J., Rubio-Andrade, M., Parsons, P. J., Steuerwald, A. J., Navas-Acien, A. and Guallar, E. 2014.
Impact of urine concentration adjustment method on associ- ations between urine metals and estimated glomerular filtra- tion rates (eGFR) in adolescents. Environ. Res. 132, 226-232.
초록:요비중 또는 크레아티닌 보정에 따른 요중 카드뮴과 신장손상지표와의 관련성 비교 김용대1*․엄상용1․임동혁1․권순길2․박충희3․김근배3․유승도3․최병선4․박정덕4․김헌1
(1충북대학교 예방의학교실, 2충북대학교 내과학교실, 3국립환경과학원 환경건강연구부 환경보건연구과, 4중
앙대학교 예방의학교실)
일반적으로 요중 카드뮴 농도는 요비중 또는 요중 크레아티닌 농도로 보정한 값을 사용해왔다. 그러나 어떤 보정방법이 더 타당한지에 대한 논란은 계속되고 있다. 본 연구에서는 비교적 큰 규모의 일반인구집단을 대상으 로 요중 카드뮴농도와 각종 신장손상지표들과의 관련성을 평가함에 있어 요비중 보정 방법과 요중 크레아티닌 보정 방법 중 어느 방법이 더 타당한지 비교 평가하였다. 1,086명의 자원자 중 신장질환의 질병력이 있는 사람을 제외한 862명이 최종적으로 연구대상에 포함되었다. 대상자들로부터 측정한 요중 카드뮴 농도 및 malondialde- hyde (MDA), N-acetyl-β-D-glucosaminidase 농도, 혈중 크레아티닌을 이용하여 산출한 사구체여과율 등의 신장 손상지표들간의 관련성을 평가하였다. 연구 결과, 요중 크레아티닌 농도보다는 요비중으로 보정한 카드뮴 농도가 각종 신장손상지표와 높은 상관성이 있음을 보여주었다. 특히, 요비중 보정 카드뮴 농도는 요중 MDA 농도와 양 의 상관관계를, 사구체여과율과는 음의 상관관계를 보여주었다. 이러한 결과는 일반인구집단에서 카드뮴 노출이 많아질수록 사구체여과율이 감소함을 의미하며 이러한 기전에서 산화적스트레스가 관여하고 있음을 보여준다.
또한, 사구체여과율이 카드뮴 노출에 의한 유용한 신장손상지표 중 하나로 사용될 수 있음을 의미한다.