Kor. J. Hort. Sci. Technol. 30(4):409-416, 2012 DOI http://dx.doi.org/10.7235/hort.2012.11141
Changes in Nutrient Levels of Aqueous Extracts from Radish (Raphanus sativus L.) Root during Liquefaction by Heat
and Non-heat Processing
Rona Bae
1*, Young-Kyu Lee
2, and Seung-Koo Lee
3,41
Agency for Korea National Food Cluster, Ministry for Food, Agriculture, Forestry, and Fisheries, Gwacheon 427-806, Korea
2
National Instrumentation Center for Environmental Management, Seoul National University, Seoul 151-921, Korea
3
Department of Plant Science, Seoul National University, Seoul 151-921, Korea
4
Research Institute for Agriculture and Life Science, Seoul National University, Seoul 151-921, Korea
Abstract. The amount of cellular components including soluble sugars, amino acids, organic acids and glucosinolates (GLS) was investigated during radish root processing to develop a radish beverage. The radish root was divided into two parts, white and green tissue, and processed separately by extracting the juice from the fresh tissue and from the boiled tissue to compare differences in the components content among the preparations. The overall palatability of both the fresh and boiled extracts from the green part of the radish was higher than that of the same extracts from the white part. The sweetness of extract by boiling increased and its pungency decreased, thereby the palatability increased by being compared to the fresh radish extract. The sweetness was affected by sucrose not by glucose or fructose of monosaccharides by showing different sucrose contents according to treatment comparing palatability. Malic acid was identified as primary organic acid, and the content was higher in both the fresh and boiled extracts from the white part than in the extracts from the green part of the radish. The fresh extract from the green part of the radish contained more essential amino acids, such as threonine and valine, and more hydrophilic amino acids including glutamic acid, aspartic acid, and arginine than those of the fresh extract from the white part, suggesting the green fresh part is more palatable than the white fresh part. The main sulfur compound was ethylthiocyanate in radish, and others were butyl isothiocyanate, dimethyl-disulfide, and 4-methylthio-3-butylisothiocyanate. The four GLS were detected much more in the fresh green and fresh white parts of the radish because they evaporated during boiling. The contents of the four sulfur compounds were higher in the white fresh part than in the green fresh part, which is likely the reason the pungency was higher and the palatability was lower in the white fresh part than in the green fresh part of the radish. The ascorbic acid content was higher in the fresh extract compared to the boiled extracts from both the green and white parts. Taken together, these findings indicate that fresh radish extract is superior to obtain in terms of retaining desirable nutritional and functional components for health.
Additional key words: amino acids, ascorbic acid, glucosinolates, organic acids, palatability, saccharides
*Corresponding author: [email protected]
※ Received 4 December 2011; Revised 18 July 2012; Accepted 25 July 2012.
Introduction
There are several radish varieties of different colors including white, purple, and green. Among them, the white radish is common in northeast Asia. The Asian white radish, or daikon, is a cruciferous crop, cultivated from 400 BC in China, Korea, Japan, Europe and USA. Radishes domestigated in Korea, China and Japan contain 80% more glucosinolate (GLS), which have a pungent taste, than the European-American radishes (Diana et al., 1985). Radish is a good source of sulfur
derivatives because GLS chemical structure contains sulfur.
The pungent and bitter flavor of the radish is also due in part to
high levels of dehydroerucin, which also belongs to GLS
(Visentin et al., 1992). The taste of radish cultivated during
summer is strongly bitter or pungent because it contains large
quantities of GLS and their function is dependent on the
chemical like isothiocyanates, which are types of GLS
hydrolyzed by myrosinase (Mithen et al., 2000). There are
almost 120 known GLS, and they are grouped into aliphatic,
aromatic and indole GLS. Many aliphatic and aromatic GLS are
known to have anticancer activity (Fahey et al., 2001).
Sulforaphane, the most well known isothiocyanate, is found in broccoli and makes phase II enzymes increase the activity causing decrease in cancer incidence (Fahey et al., 1997;
Kaaber et al., 2007). It has also been shown to inhibit the cell cycle in human colon cancer cells and activates apoptosis (Gamet et al., 2000). Because of sulfur compounds, radish is known as having folk remedy function to reduce coughing symptom in Korea. However, because of the pungent taste, it can be unpalatable to eat as a raw and is thus typically eaten after preservation in honey. Boiling to generate an extract that may be an easier method to increase palatability, but several components may be altered by this process. Cruciferous plants, such as radishes, cabbage, Chinese cabbage, and broccoli also have important sources of anticancer “nutraceutical” compounds such as β-carotene, vitamin C, fiber (pectin and cellulose), calcium, lutein, and zeaxanthin (Divisi et al., 2006; Hayes et al., 2008), and phenolics (Harbaum et al., 2007) like sulfur compounds. There are also sugars in cruciferous plants, thus providing sweet taste.
Meanwhile, even though radish is one of the most popular vegetable in Korea, the yields fluctuate year by year. If it is overproduced, the price is decreased by the law of supply and demand, thus the products are sometimes discarded in the field.
If a processing method for radishes can be developed as a high value product, such as a retort pouch or juice commodity, they could become a very useful raw material for bulk consumption because there are many valuable nutritional components in the radish as mentioned above. Therefore, the purpose of this study was to investigate the change of components after boiling method of processing to eat radish easily. The results will serve as the basis for developing a processing method for a drink commodity as a new, easy, and nutritional means of radish consumption that can minimizes waste when radishes are overproduced.
Materials and Methods
Materials
Radish (‘Daehyung Bommu’) seeds were planted in August, 2008 and harvested in February, 2009 on Jeju Island. Radishes were separated into green and white parts and prepared as different treatment. Fresh 10 g of each was chopped and put into a 100 mL beaker as fresh sample, and the other fresh 10 g sample was put into into a 100 mL beaker for boiling sample. The chopped radish was homogenized and boiled in 20 mL of distilled water for 2 min in the beaker with a glass cover using a laboratory alcohol lamp. Before boiling, the sample and beaker were weighed and the weight loss by boiling was compensated by adding distilled water because most of the
weight loss was due to water evaporation. The boiled sample was then cooled and used for component analysis. A fresh slurried sample was also prepared by adding 20 mL of distilled water to 10 g of ground radish.
Sensory Evaluations
A panel assessed the taste of each treatment of the green and white parts of the radish. The ten panel members, who were not blinded as to the taste, were asked about measures of sweetness, pungency, and palatability. All the items were scored on a scale of one to five with the smaller value indicating a weaker taste and the larger value indicating a stronger taste. The fresh green sample was used as the standard and given 2.5 points; if the taste was weaker than that of the green fresh sample, it scored less than 2.5 points, and if the taste was stronger, it scored more than 2.5 points. Samples were prepared as the same method for components analysis and given to panel members in triplicate.
Analysis of Sugars and Organic Acids
Five grams of each fresh and boiled sample from the green and white parts of the radishes were homogenized with 20 mL of distilled water and then brought to a final volume of 50 mL.
The mixture was filtered using Whatman No. 2 filter paper and then filtered again through a 0.45 µL syringe filter. The filtrate was diluted and injected into a chromatography system (Dionex 2500, Dionex Co., New York, USA).
For carbohydrate analysis, the mobile phase was 18 mM sodium hydroxide solvent, the column was a CarboPac PA10 (4 × 250 mm: Dionex Co., NY, USA), and the detector was a pulsed amperometry detector with an Au electrode. The flow rate was 1 mL・min
-1. The organic acids were analyzed with an eluent of 0.4 mM heptafluorobutyric acid and 5 mN tetrabutylammonium hydroxide was used as a regenerate solution with an Anion-ICE micromembrane suppressor. The column was IonPac ICE-AS6 (9 × 250 mm, Dionex Co., NY, USA), the flow rate was 1 mL・min
-1and suppressed conductivity was used as the detection technique.
Analysis of Sulfur Compounds
A thermal extractor (TE; Tube Condition, Linthicum, MD, USA) was used to extract the sulfur compounds at different temperatures. The TE was consisted of an adjustable oven (temperature range: room temperature -350°C) and a glass tube (length: 178 mm, diameter: 13.6 mm) with the sample inside.
The sample size was limited to a maximum 70 mm both by diameter of the tube and by the heatable length of oven. Pure nitrogen was flowed through the glass tube.
Each 20 mg sample of the four types of radish (green fresh,
green boiled, white fresh, and white boiled) was placed a
separate glass extraction tube. The sulfur compounds were
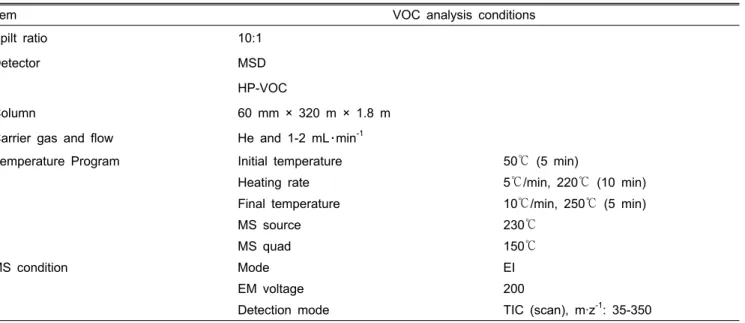
Table 1. VOC conditions used for the analysis of sulfur compounds in processed radishes.
Item VOC analysis conditions
Spilt ratio 10:1
Detector MSD
HP-VOC
Column 60 mm × 320 m × 1.8 m
Carrier gas and flow He and 1-2 mL・min
-1Temperature Program Initial temperature 50℃ (5 min)
Heating rate 5℃/min, 220℃ (10 min)
Final temperature 10℃/min, 250℃ (5 min)
MS source 230℃
MS quad 150℃
MS condition Mode EI
EM voltage 200
Detection mode TIC (scan), m·z
-1: 35-350
purged under a pure nitrogen gas stream at a constant flow in a Tenax TA tube, and the sampling volume was 1 L. Air sampling was performed at a flow rate of 39 mL・min
-1for approximately 30 min. Due to the low volume of the glass tube and high nitrogen gas flow, the air exchange rate was 90 h (Table 1). The test was carried out at 25 ± 1℃ and 55 ± 5% R.H.
The sulfur compounds concentrations were analyzed by TD-GC/MSD (TDS2-TDS, 6890N-GC, 5975-MSD, Gerstel, Linthicum, MD, USA).
The sulfur compounds were absorbed into the Tenax TA tube (60/80 mesh, Chrompack, Gerstel, Linthicum, MD, USA), the tube was inserted into the TDS, and the sample was injected in splitless mode. The TDS temperature was programmed to increase from 50°C to 260°C at a rate of 60°C/min, where the sample was held for 5 min. The TDS allowed the volatiles to be transferred into a cooled injection system (CIS 4, Gerstel, Linthicum, MD, USA) with a transfer temperature of 300°C and a 0.10 min vent time. The CIS initial temperature was -50°C, achieved through liquid nitrogen. The temperature was increased to 260°C at a rate of 12°C/s, and after the temperature reached 260°C it was maintained for 10 min to allow for the release of the extracted compounds into the system. The GC was equipped with a mass spectrometry detector (MSD) and a HP-VOC column (60 m length, 0.32 mm id, 1.8 μm film thickness). Helium was used as the carrier gas at a flow of 2.2 mL・min
-1. The oven temperature was programmed to increase from 30°C to 240°C at a rate of 10°C・min
-1with initial and final hold times of 3 min and 20 min, respectively. Identification was based on a ‘Wiley7 Nist’ library search program. All investigation parameters are summarized in Table 1.
Analysis of Ascorbic Acid
Each fruit sample (10 g) was homogenized with 50 mL of
buffer solution (0.1 M citric acid, 0.05% EDTA, and 5%
MeOH) and filtered using Whatman No. 2 filter paper. The mixture pH was adjusted with 1 M HCl, before being flushed through a Sep-pak C18 cartridge that was preconditioned with 7 mL methanol and then rinsed with 10 mL of purified water.
Before use, the residual water in the cartridge was expelled with air. One milliliter of the injected sample was discarded, and the next 3 mL were added to 1 mL of freshly prepared 1, 2-o- phenylenediamine dihydrochloride (OPDA) solution the pH was adjusted to between 2.20-2.45 after adding the OPDA.
L-ascorbic acid and dehydroascorbic acid were analyzed by HPLC (Spectra System P2000, Thermo Separation Products Co., Herts, UK) with a 5% MeOH and 50 mM potassium dihydrogen phosphate mobile phase at a flow rate of 1.0 mL・min
-1. The ascorbic acid and dehydroascorbic acid were detected at 254 and 320 nm, respectively, and a C18 reverse phase column was used (4.6 × 250 mm, 5 µm; Zorbax, Agilent Co., NY, USA).
The ascorbic acid content was measured as the sum of L-ascorbic acid and dehydroascorbic acid (Zapata and Dupour, 1992).
Analysis of Free Amino Acids
Five grams of each fresh sample was mixed with 20 mL of
distilled water and homogenized with a Polytron® homogenizer
(PT-MR 2100, Kinematica AG, Switzerland). One volume of
the mixture was mixed with four volumes of trichloroacetic
acid (5%, v/v). After centrifugation at 9,800 g for 15 min, 0.5
mL of the supernatant was mixed with 2 mL of 20 mM HCl
(Kim, 2000). The samples were analyzed using an amino acid
analyzer (L-8900, Hitachi, Tokyo, Japan) with an ion exchange
column (4.6 × 60 mm, 5 µm; Hitachi, Tokyo, Japan).
Table 2. Sensory preference scores according the type of extract from the green and white parts of the radish.
Treatment
Sensory properties
Sweetness Pungency Palatability
Green
zfresh 2.5
yc
x2.5 b 2.5 c
Green boiled 3.2 a 1.5 c 3.9 a
White
wfresh 1.9 d 3.1 a 1.7 d
White boiled 2.9 b 1.4 c 3.4 b
z
Green part of the radish.
y
Mean value.
x
White part of the radish.
x
Duncan’s multiple range test among treatments; significance at p ≤ 0.05.
w
White part of the radish.
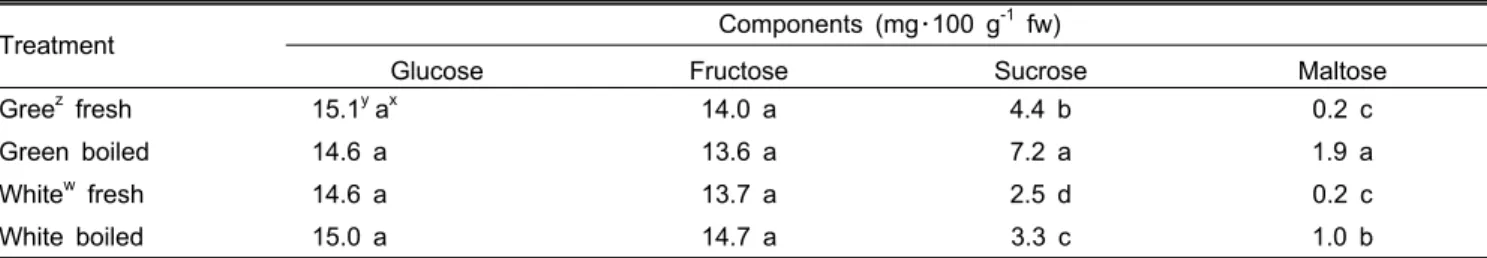
Table 3. Change in sugar content influenced by extraction method and source.
Treatment Components (mg・100 g
-1fw)
Glucose Fructose Sucrose Maltose
Gree
zfresh 15.1
ya
x14.0 a 4.4 b 0.2 c
Green boiled 14.6 a 13.6 a 7.2 a 1.9 a
White
wfresh 14.6 a 13.7 a 2.5 d 0.2 c
White boiled 15.0 a 14.7 a 3.3 c 1.0 b
z
Green part of the radish.
y
Mean value.
x
Duncan’s multiple range test among treatments; significance at p ≤ 0.05
w
White part of the radish.
Statistical Analysis
Three replicates of all treatments were used in the experiments. Data are presented as averages and the signifi- cance of the difference between treatments was determined using Duncan’s multiple range tests with p-values (p ≤ 0.05).
Results and Discussion
Sensory Evaluations
The palatability of radish juice was investigated (Table 2) by a sensory test. The green fresh radish was given a score of 2.5 as a standard, and the other radish treatments were compared to it. The sweetness score for the green boiled radish was higher than that for the green fresh radish, and the pungency score was lower for the green boiled radish than for the green fresh radish.
Therefore, the palatability was better in the green boiled radish than in the green fresh radish, indicating that boiling increased the sweetness and reduced the pungency of this portion of the radish. The sweetness of the white fresh radish was less than that of the white boiled radish, and the pungency score of the white fresh part was higher than that of the white boiled radish.
Thus, the palatability of the white boiled radish was also better than that of the white fresh radish. The sweetness of the green part of the radish was higher compared to the white radish for
both the fresh and boiled treatments, and the pungency was somewhat higher in the white fresh part than in the green fresh part, while the values were similar between the boiled treatments. The total palatability of the green part of the radish was higher than that of the white part for both the fresh and boiled treatments. Boiling increased the sweetness and decreased the pungency, thereby making the boiled extract more palatable than the fresh radish extract.
There are many complex factors that affect food taste. The taste of radishes is influenced not only by the presence of saccharides, but also by that of other compounds including sulfur compounds, which confer a pungent flavor, and free amino acids, which are known palatable components. The amounts of these compounds, besides the sugar and organic acid contents, were investigated and compared among the different extracts.
Sugars and Organic Acids
The amount of sugar in each part and each treatment of the
radish was measured (Table 3). There was no significant
difference in the glucose and fructose monosaccharide content
among treatments. However, the amount of disaccharides such
as sucrose and maltose differed among the extracts. The sucrose
content was highest in the green boiled radish, and the contents
Table 4. Change in organic acid content influenced by extraction method and source.
Treatment Components (mg・100 g
-1fw)
Citric acid Malic acid Succinic acid Oxalic acid
Green
zfresh 28.0
ya
x275.1 b 27.6 b 77.4 b
Green boiled 30.5 a 274.5 b 27.7 b 94.1 a
White
wfresh 27.7 a 300.9 a 31.5 a 46.9 d
White boiled 27.3 a 295.8 a 29.1 a 63.0 c
z
Green part of the radish.
y
Mean value.
x
Duncan’s multiple range test among treatments; significance at p ≤ 0.05.
w
White part of the radish.
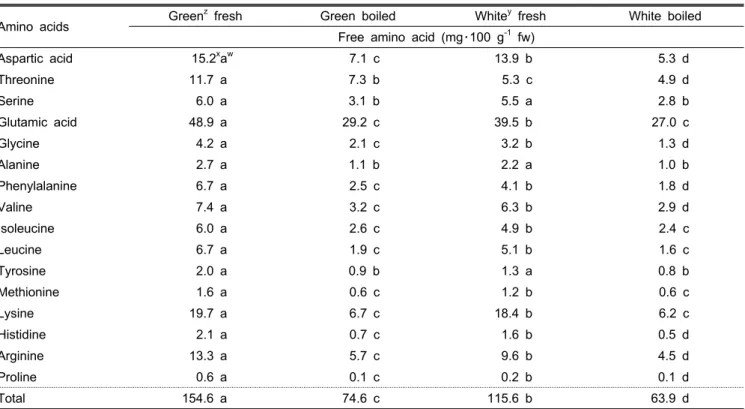
Table 5. Change in amino acid content influenced by extraction method and source.
Amino acids Green
zfresh Green boiled White
yfresh White boiled
Free amino acid (mg・100 g
-1fw)
Aspartic acid 15.2
xa
w7.1 c 13.9 b 5.3 d
Threonine 11.7 a 7.3 b 5.3 c 4.9 d
Serine 6.0 a 3.1 b 5.5 a 2.8 b
Glutamic acid 48.9 a 29.2 c 39.5 b 27.0 c
Glycine 4.2 a 2.1 c 3.2 b 1.3 d
Alanine 2.7 a 1.1 b 2.2 a 1.0 b
Phenylalanine 6.7 a 2.5 c 4.1 b 1.8 d
Valine 7.4 a 3.2 c 6.3 b 2.9 d
Isoleucine 6.0 a 2.6 c 4.9 b 2.4 c
Leucine 6.7 a 1.9 c 5.1 b 1.6 c
Tyrosine 2.0 a 0.9 b 1.3 a 0.8 b
Methionine 1.6 a 0.6 c 1.2 b 0.6 c
Lysine 19.7 a 6.7 c 18.4 b 6.2 c
Histidine 2.1 a 0.7 c 1.6 b 0.5 d
Arginine 13.3 a 5.7 c 9.6 b 4.5 d
Proline 0.6 a 0.1 c 0.2 b 0.1 d
Total 154.6 a 74.6 c 115.6 b 63.9 d
z
Green part of the radish.
y
White part of the radish.
x
Mean value.
w
Duncan’s multiple range test among treatments; significance at p ≤ 0.05.
were high in the green fresh radish, in the white boiled radish, in the white fresh radish in the order of values. These findings indicate that sweetness was affected by sucrose more than by glucose or fructose monosaccharides, which is consistent with the sensory preference data (Table 2). The maltose content differed according to treatment, but the overall level was very low, thus it had less effect on the taste of the radish.
The predominant organic acid in the radish was malic acid and the content was higher in the white part than in the green part for both the fresh and boiled treatments (Table 4). Citric acid content did not differ among the treatments, and malic acid and succinic acid contents in both the green and white part of the radish were unchanged after boiling. The oxalic acid
content was different among treatments, but the amount was small compared to malic acid. When comparing the white and green parts of the radish, the malic acid content was found to be slightly higher in the white part of the radish than in the green part. This result was consistent with that of the sensory test in that sweetness and palatability were higher in the green part than in the white part because of reduced organic acid content and increased sucrose content (Tables 3 and 4).
Free Amino Acids
The total free amino acid content in the green fresh part of the radish was higher than that in the white fresh part (Table 5).
The green fresh part contained more essential amino acids, such
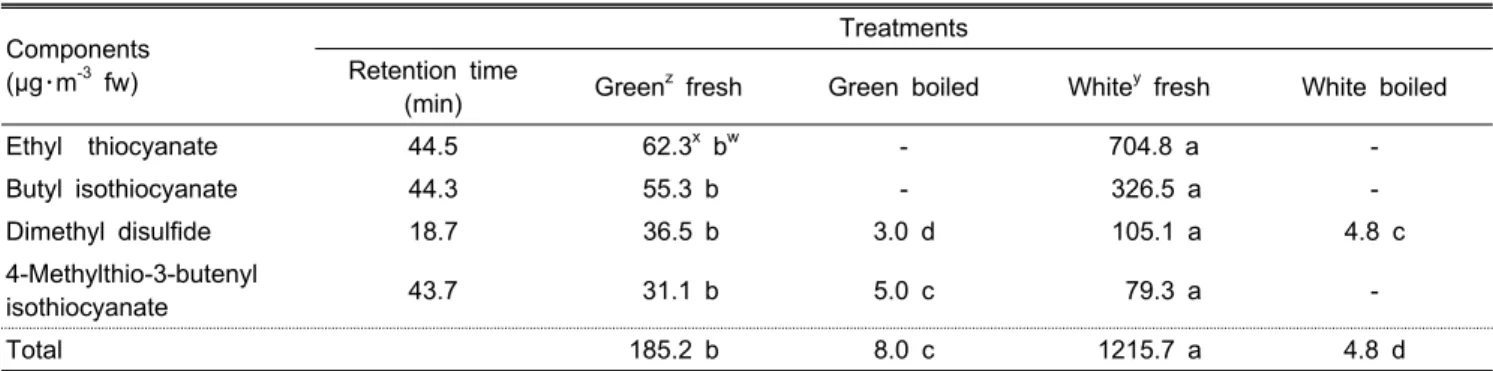
Table 6. Change in the main sulfur compounds influenced by extraction method from different parts of the radish.
Components (µg・m
-3fw)
Treatments Retention time
(min) Green
zfresh Green boiled White
yfresh White boiled
Ethyl thiocyanate 44.5 62.3
xb
w- 704.8 a -
Butyl isothiocyanate 44.3 55.3 b - 326.5 a -
Dimethyl disulfide 18.7 36.5 b 3.0 d 105.1 a 4.8 c
4-Methylthio-3-butenyl
isothiocyanate 43.7 31.1 b 5.0 c 79.3 a -
Total 185.2 b 8.0 c 1215.7 a 4.8 d
z
Green part of the radish.
y
White part of the radish.
x
Mean value.
w
Duncan’s multiple range test among treatments; significance at p ≤ 0.05.
as threonine and valine, indicating that the green fresh part of the radish is nutritionally superior to the white fresh part in terms of amino acids. Moreover, the green fresh part of the radish contained more hydrophilic amino acids, including glutamic acid, aspartic acid and arginine, than did the white fresh part, supporting the finding of better palatability in the green fresh part than in the white fresh part of the radish (Tables 2 and 5). In particular, glutamic acid is one of the amino acids that produce the umami taste in agricultural foods (Ana et al., 2009), thus there is somewhat umami taste in radish because of high glutamic acid contents relatively. It was reported that GLS are produced from amino acids including tryptophan, tyrosine, phenylalanine, isoleucine, leucine, valine, alanine, and methionine (Grubb and Abel, 2006). In this study, although the green fresh part of the radish contained more amino acids than did the white fresh part, the green fresh part contained less GLS (Tables 5 and 6). The amino acids in the green part of the radish might remain as free amino acids rather than being converted to other compounds. When the radish was boiled, the content of most of the free amino acids decreased in both the green and white parts. Likewise, when tomatoes are boiled to make puree and paste, the free amino acid content also decreases (Okitani et al., 1983). Thus, if maintaining amino acid content is the goal, then boiling is not a good method for processing radishes to remove the pungent taste and improve palatability.
Sulfur Compounds
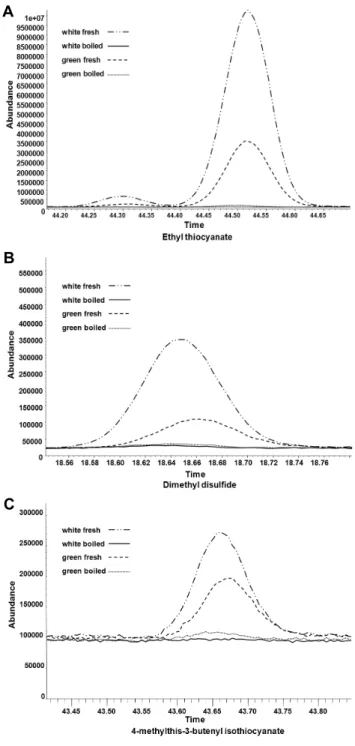
Since GLS are important functional compounds in Brassica plants (Hayes et al., 2008), GLS in the radish were simul- taneously identified and quantified. Some GLS reportedly have a pungent aroma, and ethylthiocyanate was found to be the primary sulfur component responsible for a pungent and bitter taste (Adam and Garmen, 2000; Mithen et al., 2000; Visentin et al., 1992). In this study, ethylthiocyanate comprised more than 88% of the total GLS in the radish (Table 6 and Fig. 1).
Other GLS that were found in the radish were butyl isothiocyanate, dimethyl-disulfide, and 4-methylthio-3-butylisothio- cyanate (Table 6 and Fig. 1). These four GLS were identified only in the fresh green and white radish extracts, thus they might have been converted to other components or could have evaporated during boiling because they have very low molecular weights and volatile characteristics (Iori et al., 1999). The fact that these compounds were not detected in the boiled extracts explains why the pungent taste was absent in the boiled radish leading to an increase in palatability compared to the fresh samples (Tables 2, 6, and Fig. 1).
The contents of these four sulfur compounds were higher in the white fresh part of the radish than in the green fresh part, explaining why the pungency was higher and the palatability was lower in the white fresh part than in the green fresh part of the radish (Tables 2 and 6). The four main GLS were either captured as trace amounts only or not detected in the boiled extracts from both the green and white parts. 4-Methylthio- 3-butylisothiocyanate is produced via the hydrolysis of 4-methylthio-3-butyl glucosinolate catalyzed by the enzyme myrosinase, and this reaction occurs when cells in the radish are disrupted, allowing the enzyme and substrate to mix (Palmieri et al., 1992). The sulfurous components contribute to the pungent taste (Friis and Kjaer, 1996), which is why the fresh green and white parts of the radish was more pungent compared to their boiled counterparts in the sensory test of this study (Tables 2 and 6).
According to the results, the palatability of the radish was
affected more by sulfur compounds than by amino acids
because the sulfur compound taste is pungent and this taste is
stronger than the umami taste produced by amino acids. Thus,
even though the amino acid content was higher in the fresh part
of the radish than in the boiled part, the palatability was better
in both boiled radish extracts (green and white). Additionally,
the palatability was better in the green fresh part than in the
A
B
C
Fig. 1. GC/MS chromatograms of sulfur compound profiles in radishes. A, Ethyl thiocyanate; B, Dimethyl disulfide; C, 4-methylthis-3-butenyl isothiocyanate; white, white part of the radish; green, green part of the radish.
Table 7. Change in ascorbic acid content in the radish influenced by boiling and extraction.
Treatment Components (mg・100 g
-1fw) Ascorbic acid Green
zfresh 18.1
ya
xGreen boiled 8.1 c
White
wfresh 13.4 b
White boiled 5.3 d
z
Green part of the radish.
y
White part of the radish.
x
Mean value.
w