• 검색 결과가 없습니다.

Deriving rules for identifying diabetic among individuals with metabolic syndrome

N/A
N/A
Protected

Academic year: 2021

Share "Deriving rules for identifying diabetic among individuals with metabolic syndrome"

Copied!
10
0
0

로드 중.... (전체 텍스트 보기)

전체 글

(1)

1. Introduction

Metabolic Syndrome (MS) can be defined roughly as the cluster of risk factors for cardiovascular diseases such as stroke and diabetes [1]. Many researchers have attempted to identify characteristics of MS and

relationships to other diseases such as chronic kidney disease and fatty liver disease [2-4]. The main reason of their interest in MS is that it has been known as the cause of the incidence of diabetes [5]. Diabetes is not only the fatal disease which can lead to coronary heart disease, stroke and microvascular damage [6-8] but

Deriving rules for identifying diabetic among individuals with metabolic syndrome

Jinwook Choi

1

, Yongmoo Suh

2*

1

Business School, Korea University, Ph.D. candidate

2

Business School, Korea University, Professor

대사증후군 환자 가운데 당뇨환자를 찾기 위한 규칙 도출

최진욱1, 서용무2*

1고려대학교 경영학과 석박사과정, 2고려대학교 경영학과 교수

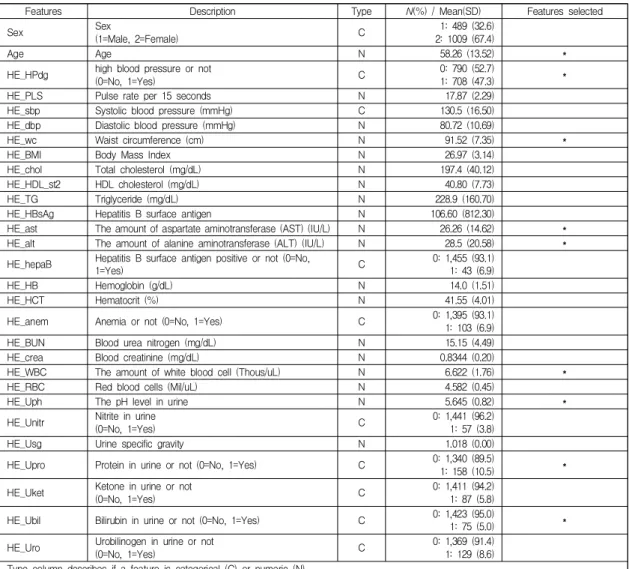
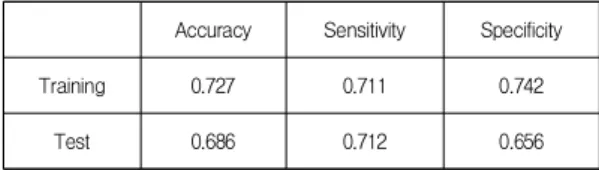
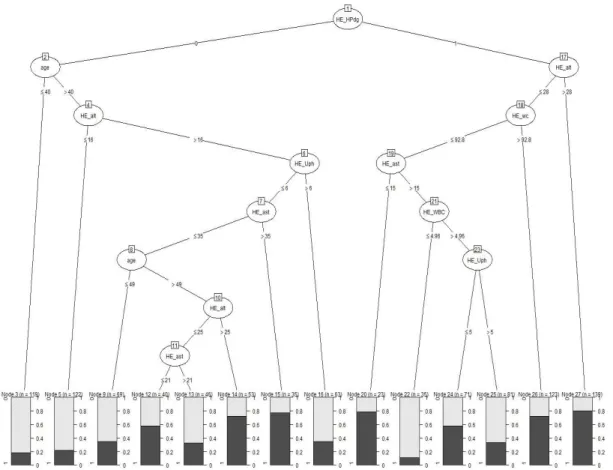
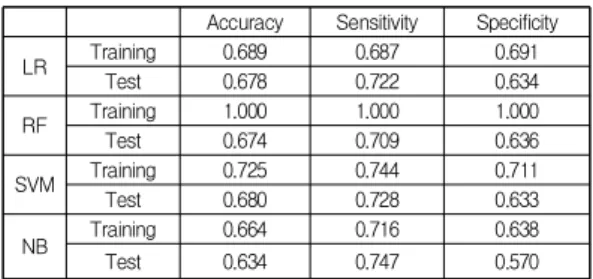
Abstract The objective of this study is to derive specific classification rules that could be used to prevent individuals with Metabolic Syndrome (MS) from developing diabetes. Specifically, we aim to identify rules which classify individuals with MS into those without diabetes (class 0) and those with diabetes (class 1). In this study we collected data from Korean National Health and Nutrition Examination Survey and built a decision tree after data pre-processing. The decision tree brings about five useful rules and their average classification accuracy is quite high (75.8%). In addition, the decision tree showed that high blood pressure and waist circumference are the most influential factors on the classification of the two groups. Our research results will serve as good guidelines for clinicians to provide better treatment for patients with MS, such that they do not develop diabetes.

Key Words : Data mining, Decision tree, Diabetes, Metabolic syndrome, KHANES

요 약 본 연구의 목적은 대사증후군이 당뇨병으로 확대되는 것을 방지하는데 이용할 수 있는 구체적인 분류 규칙을 도출 하는 것이다. 좀 더 구체적으로 말하면, 대사증후군을 앓고 있는 사람들을 당뇨병이 없는 사람 (class 0)과 당뇨병이 있는 사람(class 1)으로 구별해 내는 분류하는 규칙을 찾는 것이다. 본 연구는 국민건강영양조사 데이터를 수집하여 데이터 전처 리 과정들을 거친 후 의사결정나무를 구축하였다. 생성된 의사결정나무로부터 유용한 5개의 분류 규칙을 도출하였는데, 이들의 평균 분류 정확도는 75.8%이었다. 또한, 생성된 의사결정나무로부터 고혈압 여부와 허리둘레가 class 0 그룹과 class 1 그룹으로 분류하는데 있어서 중요한 요인임을 알 수 있었다. 이번 연구 결과는 의사들이 향후 대사증후군 환자가 당뇨 환자가 되지 않도록 치료하는데 좋은 지침이 될 것으로 기대된다.

주제어 : 데이터 마이닝, 의사결정나무, 당뇨병, 대사증후군, 국민건강영양조사

*This study is partially supported by Korea University Business School Research Grant.

*Corresponding Author : Yongmoo Suh(ymsuh@korea.ac.kr) Received August 16, 2018

Accepted November 20, 2018

Revised October 16, 2018 Published November 28, 2018

(2)

also common across countries [9]. Therefore, examining the relationship between MS and diabetes is important in order to prevent patients with MS from developing diabetes.

Many studies attempted to figure out the contribution of MS to diabetes. For example, Sattar et al. revealed from two prospective studies that MS is associated with the incidence of diabetes [10]. Waters et al. also stated some elements of MS strongly induce diabetes [11]. Kurotani et al. found that the more the number of MS components increases, the more the risk of diabetes increases markedly [12]. In contrast, Stern et al. showed the limited power of MS in predicting diabetes [13].

However, the studies mentioned above simply examined the distribution of MS components among people with diabetes compared to those without it. The results of such studies are limited to be used for preventing those with MS from developing diabetes.

Thus, it is worthwhile to identify specific rules as answers to our research question, “Who becomes diabetic among those with MS?”. To that end, we applied a data mining technique, decision tree, to the dataset of Korean National Health and Nutrition Examination Survey, conducted from 2007 to 2015 every third year by Korea Center for Disease Control and Prevention (KCDC). Although a study tried to classify MS using data mining techniques [14], to our knowledge, there is no prior research which examines the diabetes worsened from MS using data mining techniques to examine the relationship between MS and diabetes. In this study, we built C4.5 decision tree in order to derive rules which can be used to classify individuals with MS into those without diabetes and those with diabetes. From the decision tree, we identified five useful classification rules which provide answers to our research question. Their average classification accuracy is 75.8%. In addition, the decision tree showed that high blood pressure and waist circumference are the most influential factors on the classification of the two groups (class 0 and class

1). We expect that the five classification rules will serve as good guidelines for clinicians to provide better treatment for patients with MS, such that they do not develop diabetes.

2. Materials and methods

2.1 Dataset

Datasets were obtained from the fourth, fifth, and sixth Korean National Health and Nutrition Examination Survey (KNHANES Ⅳ, Ⅴ and Ⅵ), conducted every third year by KCDC from 2007 to 2015. This survey was planned to identify current status and trends in health and nutritional conditions of Koreans. The target population of this survey was Korean living in South Korea. A household was used as a sampling unit and was selected by a stratified, multi-stage sampling method considering region, sex and age [15]. The KNHANES has been reviewed and approved by the Research Ethics Review Committee of KCDC which complies with the Declaration of Helsinki.

The total number of participants were 73,353 in the KNHANES Ⅳ, Ⅴ and Ⅵ (24,871, 25,534, and 22,948, respectively). Since there were slightly different survey items in the KNHANES Ⅳ, Ⅴ and Ⅵ, we joined the datasets using survey items common to them. This survey consists of three categories: health interview, health examination and nutrition. We focused on the data belonging to the health examination, since it consists of medical indicators of an individual’s health status, most reliable information among the three categories. More specifically, the dataset we used for experiment includes items such as a history of diseases, blood pressure measurement, anthropometry investigation, blood test, urine test, pulmonary function test, and chest X-ray test. In addition, age and sex were also added to the items. The resulting dataset includes 55 features of 73,535 instances.

2.2 Pre-processing

(3)

Among 73,535 instances, we limited to 55,384 instances, corresponding to the respondents over 20 years old for our study, because MS and diabetes are rarely diagnosed among patients under age 20. We removed two features irrelevant to our study, fasting time before health examination and arm used for blood pressure measurement. We also deleted ten duplicated features: weight, height, the degree of obesity (duplicated with Body Max Index - BMI), the first, second, third systolic and diastolic blood pressure (duplicated with the second and third average systolic and diastolic blood pressure), low HDL cholesterol level without a conversion formula (duplicated with low HDL cholesterol level with a conversion formula). In addition, we discarded seven features each of which has missing values in more than 20% of instances, and then instances with at least one missing value were eliminated. In this step, the dataset was reduced to 36 features of 34,630 instances.

Our objective is to find rules which classify instances of MS into those without diabetes and those with it so that we can discern the conditions on which individuals having MS without diabetes develop diabetes. Regarding the various definitions of MS, we decided to follow the definition of MS by International Diabetes Federation (IDF). IDF definition is one of the well-established definitions of MS together with American Heart Association/National Heart, Lung, and Blood Institute (AHA/NHLBI) definition and Adult Treatment Panel III (ATP III) definition. It provides not only a stricter cutoff value for waist circumference than the other definitions but also country- and ethnic-specific values for other MS components that we had better take into account (In this study, we applied cutoff values for East Asian such as Chinese, Korean and Japanese). Thus, research conducted following the definition of MS by IDF would generate more appropriate results for our data.

IDF defines a person to have MS if he or she satisfies the following conditions 1 and 2.

Central obesity (waist circumference ≥ 90 cm for

East Asian male and ≥ 80 cm for East Asian female) Any two of the following four factors:

A. raised triglycerides (≥ 150 mg/dL)

B. reduced HDL cholesterol (< 40 mg/dL in males and <50 mg/dL in females)

C. raised blood pressure (systolic blood pressure ≥ 130 mm Hg or diastolic blood pressure ≥ 85 mm Hg)

D. fasting plasma glucose (≥ 100 mg/dL) In our dataset, 5,708 instances are identified as satisfying conditions 1 and two of 2.A, 2.B and 2.C.

Among them, 749 instances are identified as a person with diabetes (a person whose fasting plasma glucose is greater than or equal to 126) and 2,903 instances as not satisfying the condition 2.D. We labeled the former instances as class 1 and the latter as class 0. Note that instances of class 1 are having MS with diabetes and instances of class 0 are having MS without diabetes, and our goal in this study is to build a model which classify instances of MS into two groups.

After defining the two classes, we removed five features which are directly related to diabetes such as diagnosis of diabetes and fasting plasma glucose, etc., in order to prevent a distorted high classification performance. Additionally, pulse regularity of which all instances had the same value and a feature indicating whether or not taking hypertension drugs on the day of medical examination were deleted. Consequently, as is shown in Table 1, our dataset consists of 29 features of 3,652 instances.

2.3 Data balancing, Training dataset, and Test dataset

The pre-processed dataset showed class imbalance

problem, which occurs when the number of each class

is significantly different. Severe class imbalance results

in a biased model because the model with class

imbalance focuses on learning the majority class than

the minority class. In our datasets, there were 2,903

instances in class 0 and 749 instances in class 1. We

applied under-sampling to our seriously imbalanced

(4)

dataset, to get a final dataset of 1,498 instances (749 instances for each class).

We divided the final balanced dataset into training dataset and test dataset. The data collected from 2007 to 2012 was treated as training dataset which was employed to construct a decision tree model. The remaining recent data (2013~2015) was used as test dataset to validate the trained model. Consequently, our training dataset consists of 1,019 instances, among which 531 instances belong to class 0 and 488 class 1.

It means there was no serious imbalance problem in the

training dataset thus obtained.

2.4 Decision tree algorithm

Decision tree (DT) is one of the most popular classification algorithms that has been used in various fields [16-18]. The most outstanding advantage of DT is that the resulting decision tree is interpretable as if-then rules. DT is built as follows. The decision tree algorithm recursively splits a parent node into children nodes based on the value of an attribute selected by a criterion such as information gain or gain ratio until

Features Description Type

N(%) / Mean(SD)

Features selected

Sex Sex

(1=Male, 2=Female) C 1: 489 (32.6)

2: 1009 (67.4)

Age Age N 58.26 (13.52) *

HE_HPdg high blood pressure or not

(0=No, 1=Yes) C 0: 790 (52.7)

1: 708 (47.3) *

HE_PLS Pulse rate per 15 seconds N 17.87 (2.29)

HE_sbp Systolic blood pressure (mmHg) C 130.5 (16.50)

HE_dbp Diastolic blood pressure (mmHg) N 80.72 (10.69)

HE_wc Waist circumference (cm) N 91.52 (7.35) *

HE_BMI Body Mass Index N 26.97 (3.14)

HE_chol Total cholesterol (mg/dL) N 197.4 (40.12)

HE_HDL_st2 HDL cholesterol (mg/dL) N 40.80 (7.73)

HE_TG Triglyceride (mg/dL) N 228.9 (160.70)

HE_HBsAg Hepatitis B surface antigen N 106.60 (812.30)

HE_ast The amount of aspartate aminotransferase (AST) (IU/L) N 26.26 (14.62) *

HE_alt The amount of alanine aminotransferase (ALT) (IU/L) N 28.5 (20.58) *

HE_hepaB Hepatitis B surface antigen positive or not (0=No,

1=Yes) C 0: 1,455 (93.1)

1: 43 (6.9)

HE_HB Hemoglobin (g/dL) N 14.0 (1.51)

HE_HCT Hematocrit (%) N 41.55 (4.01)

HE_anem Anemia or not (0=No, 1=Yes) C 0: 1,395 (93.1)

1: 103 (6.9)

HE_BUN Blood urea nitrogen (mg/dL) N 15.15 (4.49)

HE_crea Blood creatinine (mg/dL) N 0.8344 (0.20)

HE_WBC The amount of white blood cell (Thous/uL) N 6.622 (1.76) *

HE_RBC Red blood cells (Mil/uL) N 4.582 (0.45)

HE_Uph The pH level in urine N 5.645 (0.82) *

HE_Unitr Nitrite in urine

(0=No, 1=Yes) C 0: 1,441 (96.2)

1: 57 (3.8)

HE_Usg Urine specific gravity N 1.018 (0.00)

HE_Upro Protein in urine or not (0=No, 1=Yes) C 0: 1,340 (89.5)

1: 158 (10.5) *

HE_Uket Ketone in urine or not

(0=No, 1=Yes) C 0: 1,411 (94.2)

1: 87 (5.8)

HE_Ubil Bilirubin in urine or not (0=No, 1=Yes) C 0: 1,423 (95.0)

1: 75 (5.0) *

HE_Uro Urobilinogen in urine or not

(0=No, 1=Yes) C 0: 1,369 (91.4)

1: 129 (8.6) Type column describes if a feature is categorical (C) or numeric (N).

Statistic column shows the number of samples and proportions for each category of categorical features and mean (standard deviation) for numeric features

Table 1. Details of the features remained after pre-processing.

(5)

leaf nodes contain instances majority of which have the same class [19]. The attribute which is selected to split the root node is the most important predictor for a classification and the attributes which are used to split a node at lower levels of the tree are less important predictors. The path from the root node to each leaf node in the resulting decision tree represents a classification rule. So, building a decision tree corresponds to identifying classification rules, one for each leaf node.

We decided to use C4.5 algorithm implemented in statistical software R to build a classification model from our dataset. It is one of the popular decision tree algorithms such as ID3 and CART. This algorithm utilizes gain ratio as a criterion to select the optimal attribute for splitting. The attribute bearing the higher value of gain ratio is located in the higher position of a tree. In addition, C4.5 allows multiple split to be made and conducts the post-pruning to prevent overfitting problem.

2.5 Feature selection

Feature selection which finds an optimal subset of features for classifying instances is the crucial process in data mining approach. We used the wrapper method to find an optimal subset of features and to build a classification model at the same time, using backward elimination method for feature selection and C4.5 as a classification model. We employed the gain ratio to calculate the importance of each feature because C4.5 uses gain ratio to build a decision tree. Since our dataset is not big, we adopted 10-fold cross validation.

A total of 9 features were selected as the optimal subset of features for classifying. The selected 9 features listed in the order of importance based on gain ratio are HE_HPdg, Age, HE_ast, HE_alt, HE_Upro, HE_Ubil, HE_wc, HE_WBC, and HE_Uph.

2.6 Evaluation metrics

In order to measure the performance of a trained model, we employed accuracy, sensitivity, and specificity,

as has been done usually [20]. Since sensitivity and specificity can evaluate the classification performance for each class, they compensate the distorted performance which could appear when only accuracy is considered. We considered class 1 (individuals having both diabetes and MS) as a positive class and class 0 (individuals having MS only) as a negative class when calculating the sensitivity and the specificity.

3. Results

After a decision tree was constructed with 9 selected variables using the training dataset, the performance of the trained model was evaluated with a test dataset. As is shown in Fig. 1, the trained decision tree consists of 14 leaves (Note that each leaf represents a classification rule). Since variables that were located in a higher position of the tree are more important, variables HE_HPdg, age, HE_alt,and HE_wc are more influential than the other variables for the classification.

Table 2 explains the classification results on both training dataset and test dataset. The accuracy on training dataset was 72.7%, whereas that on the test dataset was 68.6%, indicating that the trained decision tree did not experience a serious overfitting problem.

While sensitivity on the two datasets was reported above 71%, specificity showed 8.6% difference. Overall, all three measures showing similar performance on both datasets prove the effectiveness of the trained model for both classes. Table 3 displays 14 classification rules in If-then style along with the classification accuracy.

Accuracy Sensitivity Specificity

Training 0.727 0.711 0.742

Test 0.686 0.712 0.656

Table 2. The classification results of the decision

tree

(6)

Fig. 1. The decision tree built from the training dataset. The bar at the bottom of the figure indicates the proportion of each class in the leaf node.

No. Rules Accuracy

1 If HE_HPdg = 1 and HE_alt <= 28 and HE_wc <= 92.8 and HE_ast > 15 and HE_WBC <= 4.96 then class 0 88.5% (31/35)

2 If HE_HPdg = 0 and age <= 40 then class 0 81.5% (97/119)

3 If HE_HPdg = 1 and HE_alt > 28 then class 1 79.8% (111/139)

4 If HE_HPdg = 1 and HE_alt <= 28 and HE_wc <= 92.8 and HE_ast <= 15 then class 1 78.2% (18/23)

5 If HE_HPdg = 0 and age > 40 and HE_alt <= 16 then class 0 77.8% (95/122)

6 If HE_HPdg = 0 and age > 40 and HE_alt > 16 and HE_Uph <= 6 and HE_ast > 35 then class 1 77.1% (27/35)

7 If HE_HPdg = 1 and HE_alt <= 28 and HE_wc > 92.8 then class 1 72.3% (89/123)

8 If HE_HPdg = 0 and HE_Uph <= 6 and HE_ast <= 35 and age > 49 and HE_alt > 25 then class 1 71.6% (38/53) 9 If HE_HPdg = 0 and HE_Uph <= 6 and HE_ast <= 35 and age > 49 and 16 < HE_alt <=25 and HE_ast > 21

then class 0 67.3% (31/46)

10 If HE_HPdg = 1 and HE_alt <= 28 and HE_wc <= 92.8 and HE_ast > 15 and HE_WBC > 4.96 and HE_Uph >

5 then class 0 66.6% (54/81)

11 If HE_HPdg = 0 and HE_alt > 16 and HE_Uph <= 6 and HE_ast <= 35 and 40 < age <= 49 then class 0 65.2% (45/69) 12 If HE_HPdg = 0 and age > 40 and HE_alt > 16 and HE_Uph > 6 then class 0 65.0% (41/63) 13 If HE_HPdg = 1 and HE_alt <= 28 and HE_wc <= 92.8 and HE_ast > 15 and HE_WBC > 4.96 and HE_Uph <=

5 then class 1 57.7% (41/71)

14 If HE_HPdg = 0 and HE_Uph <= 6 and HE_ast <= 35 and age > 49 and 16 < HE_alt <=25 and HE_ast <= 21

then class 1 57.5% (23/40)

Accuracy = the number of correctly classified instances by a rule in the training dataset / the number of instances corresponding to a rule in the training dataset

Table 3. 14 rules generated from the decision tree.

(7)

Accuracy Sensitivity Specificity

LR Training 0.689 0.687 0.691

Test 0.678 0.722 0.634

RF Training 1.000 1.000 1.000

Test 0.674 0.709 0.636

SVM Training 0.725 0.744 0.711

Test 0.680 0.728 0.633

NB Training 0.664 0.716 0.638

Test 0.634 0.747 0.570

LR(Logistic Regression), RF(Random Forest), SVM(Support Vector Machine), NB(Naive Bayesian classifier)

Table 4. Comparison of the four algorithms

In order to compare the classification ability of C4.5 decision tree algorithm, we conducted experiments with other algorithms which were widely used in data mining field such as Logistic Regression (LR), Random Forest (RF), Support Vector Machine (SVM), Naive Bayesian classifier (NB). Table 4 showed the performances of the algorithms. The performance of the decision tree on the test dataset is a little bit better than those of others. The classification rules obtained from the decision tree can be used to explain the classification results.

4. Discussion

In order to derive specific classification rules that could be used to prevent individuals with MS from developing diabetes, we trained and evaluated the decision tree model as explained in section 3. Each rule of the decision tree can be expressed in terms of variables, showing their collective influence on the classification. Somewhat unsatisfactory prediction performance (68.6% accuracy for the testing dataset in Table 2) indicates that the characteristics of the two groups (i.e., class 0 and class 1) are very similar, because the conditions of individuals with MS, when deteriorated, can cause diabetes. But it should be noted that 8 out of the 14 rules in table 3 showed a prediction accuracy of greater than 70%. (However, the other 6 rules in the Table 3 may also be referenced by clinicians to make an advice for their patients.) 3 rules out of the 8 are defining the characteristics of class 0

and the rest 5 rules of class 1. Since our research question was “Who becomes diabetic among those with MS?”, our concern is more about the latter 5 rules, whose average classification accuracy is 75.8% (rules 3, 4, 6, 7 and 8). Consequently, an individual with MS is likely to develop diabetes if one of the followings satisfies:

1. blood pressure is high and ALT > 28 (rule 3, 79.8% accuracy).

2. blood pressure is high and ALT <= 28 and waist circumference <= 92.8 and GOT <= 15, (rule 4, 78.2% accuracy)

3. blood pressure is high and ALT <= 28 and waist circumference > 92.8 (rue 7, 72.3% accuracy) 4. blood pressure is not high and age > 40 and ALT

> 16 and pH level in urine <= 6 and AST > 35 (rule 6, 77.1% accuracy)

5. blood pressure is not high and age > 49 and ALT<= 35 and pH level in urine <= 6 and AST

> 25 (rule 8, 71.6% accuracy)

The above 5 rules imply that clinicians need to pay attention to the values of different features depending on whether patients have high blood pressure or not.

That is, if a patient has high blood pressure, they need to examine the values of such features as ALT, waist circumference and AST. Otherwise they need to trace the values of such features as age, ALT, pH level in urine, and AST. Note that the other two risk factors of MS,raised triglycerides and reduced HDL cholesterol, were even excluded when features were selected in Section 2.5.

In literature, we can find other researches whose

results are related to ours. In a research conducted on

4,240 Korean type 2 diabetes mellitus patients, high

blood pressure was the most prevalent component

among the four risk factors of MS except raised fasting

plasma glucose [21]. The main result of this research

is similar to the fact that high blood pressure is the

most influential factor in the decision tree. Other

researches showed that diabetes is closely linked to

(8)

central obesity as well as MS [22, 23]. Another interesting point was that liver functions, ALT and AST, were the key variables to classify the two groups.

13 rules except rule 2 in Table 3 included ALT and/or AST. It means that ALT and AST played a critical role in classifying the two groups together with other variables. This is consistent with the previous finding that ALT or AST were significantly correlated to fasting blood glucose as well as BMI and blood pressure levels [24]. It is also noteworthy that although the values of ALT and AST do not exceed the normal range, they still played a critical role in classifying the two groups. Overall, the results of our experiment are more specific and thus more useful than those of the above researches.

5. Conclusion

In contrast with the attention to MS as a cause of diabetes, enough studies have not been conducted to explore the relationship between MS and diabetes accompanied by MS. To fill this research gap, we attempted to discover the hidden patterns between the two groups using data mining techniques. For this purpose, decision tree algorithm was employed because it generates interpretable rules as an output. In addition, we applied random under-sampling for unbiased results and feature selection to search for an optimal subset. The constructed model was evaluated using an independent test dataset.

As a results, 14 rules were identified and they provided insight for understanding the relationship between MS without diabetes and MS with diabetes.

We found that high blood pressure and waist circumference were more important factors among the risk factors of MS. ALT and AST were also influential for the classification of the two groups. Although the classification for the two similar groups was challenging, several rules showed a high accuracy with specific decision criteria. They can be employed for a diagnosis and the prevention of diabetes among

individuals with MS.

This research has a few limitations. One is the small number of instances to be used for building a decision tree model. After pre-processing and under-sampling, the number of instances is reduced to 1,498. Even though we were able to derive quite reliable classification rules for identifying diabetes from MS, their reliability will be increased if more number of instances are used to build the model. Another is the associated with our assumption. If we were able to collect data both when each respondent was diagnosed as having MS as well as when he or she developed diabetes, more reliable results might be expected. We, however, assumed that our original dataset was big enough so that the resulting rules are as reliable as those obtained from such data without loss of generality.

REFERENCES

[1] S. M. Grundy, H. B. Brewer, J. I. Cleeman, S. C. Smith

& C. Lenfant. (2004). Definition of metabolic syndrome.

Circulation, 109(3), 433-438.

DOI : 10.1161/01.CIR.0000111245.75752.C6

[2] J. Chen et al. (2004). The metabolic syndrome and chronic kidney disease in us adults. Annals of Internal Medicine, 140(3), 167-174.

DOI : 10.7326/0003-4819-140-3-200402030-00007 [3] M. Hamaguchi et al. (2005). The metabolic syndrome as

a predictor of nonalcoholic fatty liver disease. Annals of Internal Medicine, 143(10), 722-728.

DOI : 10.7326/0003-4819-143-10-200511150-00009 [4] N. Sattar et al. (2003). Metabolic syndrome with and

without c-reactive protein as a predictor of coronary heart disease and diabetes in the west of scotland coronary prevention study. Circulation, 108(4), 414-419.

DOI : 10.1016/j.accreview.2003.09.016

[5] K. G. M. Alberti, P. Zimmet & J. Shaw. (2005). The metabolic syndrome-a new worldwide definition. The Lancet, 366(9491), 1059-1062.

DOI : 10.1016/S0140-6736(05)67402-8

[6] S. M. Haffner, S. Lehto, T. Rönnemaa, K. Pyörälä & M.

Laakso. (1998). Mortality from coronary heart disease in

subjects with type 2 diabetes and in nondiabetic subjects

(9)

with and without prior myocardial infarction. New England Journal of Medicine, 339(4), 229-234.

DOI : 10.1056/NEJM199807233390404

[7] R. Klein. (1995). Hyperglycemia and microvascular and macrovascular disease in diabetes. Diabetes Care, 18(2), 258-268.

DOI : 10.2337/diacare.18.2.258

[8] S. Lehto, T. Rönnemaa, K. Pyörälä & M. Laakso. (1996).

Predictors of stroke in middle-aged patients with non–

insulin-dependent diabetes. Stroke, 27(1), 63-68.

DOI : 10.1161/01.STR.27.1.63

[9] D. R. Whiting, L. Guariguata, C. Weil & J. Shaw. (2011).

Idf diabetes atlas: global estimates of the prevalence of diabetes for 2011 and 2030. Diabetes Research and Clinical Practice, 94(3), 311-321.

DOI : 10.1016/j.diabres.2011.10.029

[10] N. Sattar et al. (2008). Can metabolic syndrome usefully predict cardiovascular disease and diabetes? outcome data from two prospective studies. The Lancet, 371(9628), 1927-1935.

DOI : 10.1016/S0140-6736(08)60602-9

[11] D. D. Waters et al. (2011). Predictors of new-onset diabetes in patients treated with atorvastatin: results from 3 large randomized clinical trials. Journal of the American College of Cardiology, 57(14), 1535-1545. 

DOI : 10.1016/j.jacc.2010.10.047

[12] K. Kurotani et al. (2017). Metabolic syndrome components and diabetes incidence according to the presence or absence of impaired fasting glucose: the japan epidemiology collaboration on occupational health study. Journal of Epidemiology, 27(9), 408-412.

DOI : 10.1016/j.je.2016.08.015

[13] M. P. Stern, K. Williams, C. González-Villalpando, K. J.

Hunt & S. M. Haffner. (2004). Does the metabolic syndrome improve identification of individuals at risk of type 2 diabetes and/or cardiovascular disease? Diabetes Care, 27(11), 2676-2681.

DOI : 10.2337/diacare.27.11.2676

[14] H. K. Kim, K. H. Choi, S. W. Lim & H. S. Rhee. (2016).

Development of prediction model for prevalence of metabolic syndrome using data mining : korea national health and nutrition examination study. Journal of Digital Convergence, 14(2), 325-332.

DOI : 10.14400/JDC.2016.14.2.325

[15] J. M. Park, J. Y. Lee, J. J. Dong, D. C. Lee & Y. J. Lee.

(2016). Association between the triglyceride to high-density lipoprotein cholesterol ratio and insulin resistance in korean adolescents: a nationwide

population-based study. Journal of Pediatric Endocrinology and Metabolism, 29(11), 1259-1265.

DOI : 10.1515/jpem-2016-0244

[16] J. Y. Oh & S. H. Choi. (2018). An analysis of the characteristics of companies introducing smart factory system using data mining technique. Journal of the Korea Convergence Society, 9(5), 179-189.

DOI : 10.15207/JKCS.2018.9.5.179

[17] J. C. Kim, H. I. Jung, H. Yoo & K. Y. Chung. (2018).

Sequence mining based manufacturing process using decision model in cognitive factory. Journal of the Korea Convergence Society, 9(3), 53-59.

DOI : 10.15207/JKCS.2018.9.3.05

[18] J. H. Ku. (2017). A study of the machine learning model for product faulty prediction in internet of things environment. Journal of Convergence for Information Technology, 7(1), 55-60.

DOI : 10.22156/CS4SMB.2017.7.1.055

[19] D. Lavanya & K. U. Rani. (2011). Performance evaluation of decision tree classifiers on medical datasets.

International Journal of Computer Applications, 26(4), 1-4.

[20] N. Lavrač. (1999). Selected Techniques for data mining in medicine. Artificial Intelligence in Medicine, 16(1), 3-23.

DOI : 10.1016/S0933-3657(98)00062-1

[21] T. H. Kim et al. (2009). Prevalence of the metabolic syndrome in type 2 diabetic patients. Korean Diabetes Journal, 33(1), 40-47.

DOI : 10.4093/kdj.2009.33.1.40

[22] Z. Lee et al. (1999). Plasma insulin, growth hormone, cortisol, and central obesity among young chinese type 2 diabetic patients. Diabetes Care, 22(9), 1450-1457.

DOI : 10.2337/diacare.22.9.1450

[23] T. Siddiquee et al. (2015). Association of general and central obesity with diabetes and prediabetes in rural bangladeshi population. Diabetes & Metabolic Syndrome: Clinical Research & Reviews, 9(4), 247-251.

DOI : 10.1016/j.dsx.2015.02.002

[24] G. M. Rao, L. O. Morghom, M. N. Kabur, B. M. B.

Mohmud & K. Ashibani. (1989). Serum glutamic

oxaloacetic transaminase (GOT) and glutamic pyruvic

transaminase (GPT) levels in diabetes mellitus. Indian

Journal of Medical Sciences, 43(5), 118-121.

(10)

최 진 욱(Choi, Jin Wook) [정회원]

․2013년 2월 : 가천대학교 경영학 (학사)

․2014년 3월 ~ 현재: 고려대학교 경영정보 석박사통합과정

․관심분야 : 데이터 마이닝, 텍스트 마이닝, 기계학습

․E-Mail : jwc87@korea.ac.kr

서 용 무(Suh, Yong Moo) [정회원]

․1978년 2월 : 서울대 수학교육(학 사)

․1980년 2월 : 한국과학기술원 전산 학(석사)

․1980년 3월 ~ 1983년 7월 : 한국 과학기술연구소 연구원

․1983년 9월 ~ 1992년 12월 : Univ. of Texas at Austin 전산학(석사), 경영정보학(박사)

․1993년 9월 ~ 현재 : 세종대학교->건국대학교->고려 대학교

․관심분야 : 비즈니스 인텔리전스, 데이터 마이닝, 텍스 트 마이닝, 비즈니스 데이터 분석

․E-Mail : ymsuh@korea.ac.kr

수치

Table  1.  Details  of  the  features  remained  after  pre-processing.
Table 2 explains the classification results on both training dataset and test dataset
Fig.  1.  The  decision  tree  built  from  the  training  dataset.  The  bar  at  the  bottom  of  the  figure  indicates  the  proportion  of  each  class  in  the  leaf  node.
Table  4.  Comparison  of  the  four  algorithms

참조

관련 문서

2) Model test in towing tank for check the performance of primary.. 100ton class high speed patrol boat.. 3) Using CFD code Shipflow, check the wavefattern, pressure

The index is calculated with the latest 5-year auction data of 400 selected Classic, Modern, and Contemporary Chinese painting artists from major auction houses..

When static keyword is used with the variables and the methods, it signifies that these members belongs to the class and these members are shared by all the objects of

1 John Owen, Justification by Faith Alone, in The Works of John Owen, ed. John Bolt, trans. Scott Clark, &#34;Do This and Live: Christ's Active Obedience as the

‘small and medium-sized enterprises’ human resources development project for characterization high schools’ and ‘customized employment class’ based on

In the analysis of soluble solids, the treatment group with material grains and the combined groups of glutinous millet and barley appeared high, and

In addition, measurements at 0 and 12 weeks (body composition, α-amylase, metabolic syndrome related factors) were performed twice. For 12 weeks, the

For class flow, autotelic experience of the first and second graders was higher than that of the third graders, and matching of behavior with consciousness