1. INTRODUCTION
The pulp mill-based industry can be utilized for the production of biofuels and chemical products through the pre-pulping extraction of hemicelluloses. Hemicellulosic sugars may also be used as building blocks for biodegradable
plastics (Keenan et al., 2004) or other products and chemicals that are currently made from pe- troleum (Liu et al., 2006). During the hemi- cellulose extraction process, extracts contain mostly water, hemicellulose, and acetic acid (AA) before they are fermented to create bioethanol. Some decomposed compounds
Original Article
Optimization of Acetic Acid Recovery Using Tri-n-alkylphosphine Oxide from Prepulping Extract of Hemicellulose by
Response Surface Methodology 1
Seong Ju Kim 2 ⋅Seong-Jik Park 3 ⋅Byung Hwan Um 2,†
ABSTRACT
A single process using hot water (0% green liquor) and green liquor (GL) was investigated for pre-pulping extraction on two types of raw material. The GL was applied at different alkali charges of 0-5% on a dry wood weight basis. The extractions were performed at an H-factor 900 at 180 ℃. The 0% and 3% GL extraction detected acetic acid (AA) at 10.02 and 9.94 g/ ℓ, extracts derived from hardwood, 2.46 and 3.76 g/ℓ, extracts derived from softwood, respectively. The single liquid-liquid extraction (LLE) was studied using tri-n-alkylphos- phine oxide (TAPO). Response surface methodology (RSM) was employed as an efficient approach for pre- dictive model building and optimization of AA recovery conditions. The extraction of AA was evaluated with a three-level factorial design. Three independent variables, pH (0.5-3.5), temperature (25-65 ℃), and residence time (24-48 min) were investigated. Applying the RSM models obtained, the optimal conditions selected of extracts derived from hard- and softwood with a 3% GL were approximately pH 1.4, 26.6 ℃, 43.8 min and approximately pH 0.7, 25.2 ℃, 24.6 min, respectively. The predicted and experimental values of AA recovery yield were similar whilst sugar retention was 100%.
Keywords : acetic acid, response surface methodology, tri-n-alkylphosphine oxide, prepulping
1 Date Received March 10, 2016, Date Accepted April 22, 2016
2 Department of Chemical Engineering and Interagency Convergence Energy on New Biomass Industry, Hankyong National University, 327, Jungang-ro, Anseong, Gyeonggi-do, 17579, Republic of Korea
3 Department of Bioresources and Rural Systems Engineering, Hankyong National University, 327, Jungang-ro, Anseong, Gyeonggi-do, 17579, Republic of Korea
†
Corresponding author: Byung Hwan Um (e-mail: [email protected])
(mainly AA), can hinder the subsequent bio- conversion of the solubilized sugars into desired products by reducing fermentation rates and conversion yield (Um et al., 2011). The re- sidual wood chips can be processed into pulp to make paper, burned for renewable energy, or converted to reconstituted wood products such as fiberboard or pellets (Amidon, 2006; Amidon and Liu, 2009), which wood-based biorefineries (Myerly et al., 1981). The biorefinery process is illustrated as a block flow diagram in Fig. 1.
There are several pre-pulping extraction technologies proposed for the removal of hemi- cellulose from biomass such as steam explosion, dissolution with organic solvents, alkali, treat-
ment with dilute acid or enzymes, and water ex- traction (via autohydrolysis). It has been shown that the pulp yield from the mill can be sus- tained while producing a byproduct stream of extracted hemicelluloses if pre-pulping ex- traction is carried out with dilute green liquor (GL) as the extraction solvent (van Heiningen, 2006). GL is a partially recovered form of kraft liquor. It is obtained after the combustion of black liquor in the recovery boiler by dissolving the smelt in water. It contains several com- pounds including sodium carbonate, sodium sulfide and sodium hydroxide (Um et al., 2011).
AA is one of the major inhibitory compounds
released during pre-pulping extraction. If
Fig. 1. The block flow diagram representing the hemicellulose extraction and liquid-to-liquid extraction (LLE)
process in a biorefinery plant producing wood pulp.
separated and purified, it can also be sold as a chemical feedstock. AA is ubiquitous in hemi- cellulose hydrolyzates where the hemicellulose and to some extent lignin are acetylated (Fengel and Wegener, 1989; Klinke et al., 2004). The inhibitory effect of AA (pKa = 4.75 at 25 ℃) is strongly affected by pH. When the pH of a hy- drolyzate is lower than 4.75, the protonated form of AA is dominant in the solution. As this form of the acid is lipophilic, it can diffuse through the cytoplasmic membrane and detrimentally affect cell metabolism (Lohmeier-Vogel et al., 1998). Although the effect of AA can be re- duced by conducting the bioconversion at a high pH (above or around 6.0), fermentation at this neutral pH can be suboptimal. Because AA can also fetch value in the chemical market, it is beneficial to recover this compound prior to fermentation. AA is an important component in the synthesis of many chemicals, such as cellu- lose acetate, vinyl acetate, AA esters, and ter- ephthalic acid. The demand for AA has in- creased recently (Kirschner, 2003) due to in- creased demands for derivatives such as vinyl acetate monomer (VAM). Currently, AA is mainly produced from non-renewable feedstocks such as methanol carbonylation (Kirschner, 2003). Market prices of AA ($1.2 /kg, 2010 level) are considerably higher than price pre- dictions for ethanol ($0.05-0.15 /kg, 2011 level).
The extraction of AA from an ethanol fer- mentation broth needs to be cost effective to compete with synthetic processes. Current ex- traction methods of AA from ethanol fermenta- tion broths are time consuming and costly.
Various technologies have been reported for the separation of organic acids from complex mixtures. Examples include: (catalytic) dis- tillation (Xu et al., 1999), adsorption using ion-exchange resins (Anasthas and Gaikar, 2001), a and microemulsion liquid membrane separation (Wiencek and Qutubuddin, 1992).
Studies have shown that the use of a solvents have been successful in the extraction of AA from an aqueous solution to an organic phase using liquid-liquid extraction (LLE) (Um et al., 2011). The use of organophosphorus compounds and alkylamines with a high molecular weight dissolved in various diluents has been explored for liquid-liquid extraction (LLE) of AA from dilute aqueous solutions.
Tri-n-alkylphosphine oxide (TAPO) is a liq- uid phosphine oxide extractant that has potential applications in solvent extraction of both organ- ic and inorganic solutes from aqueous solutions (e.g. carboxylic acids from effluent streams and the removal of arsenic impurities from copper electrolytes). The TAPO was developed by Watson et al. and consists of a mixture of four trialkylphoshine oxides with n-hexyl-and n-octyl substituents. The major benefit of TAPO is its high solubility that allows the preparation of concentrated, stable solvents. This allows the recovery of solutes (e.g. AA) that are normally only weakly extracted by this type of reagent.
Processes in petrochemical plants, wood pulping
mills, and other chemical facilities often
generate aqueous effluent streams containing
carboxylic acids such as AA (Madane and
Namdev, 2013).
The objective of this study was to investigate the effect of different pre-pulping extraction techniques on two types of raw material, oak (Quercus) and pine chips (Pinus rigida Mill) in a single reactor. The hemicellulose extraction conditions investigated in this study were GL charge (0-5% on dry wood chips) and total ti- trated alkali (TTA as Na 2 O) in reactor. The ex- tractions were performed at a temperature of 180 ℃ for target H-factors of 900 at each chemical loading. Furthermore, response surface methodology (RSM) was applied to optimize the AA recovery yield of LLE using TAPO whilst retaining sugar components for fermentation. RSM is a statistical tool used for designing experiments, building empirical mod- els, and evaluating the effects of factors (Ma et al., 2009; Yue et al., 2008). RSM can reduce the number of experimental trials needed to evaluate multiple parameters and their inter- actions (Chen et al., 2005; Karacan et al., 2007; Sanchez et al., 1998). Several variables of the LLE, including reaction temperature of the water bath, pH, and residence time, were selected as factors of experimental design by preliminary tests. The optimal reaction con- ditions of these three factors for maximal AA recovery yield were determined by a central composite design (CCD).
2. MATERIALS and METHODS 2.1. Raw wood chips
Mixed hard- and softwood chips were used throughout this study. The most prevalent hard-
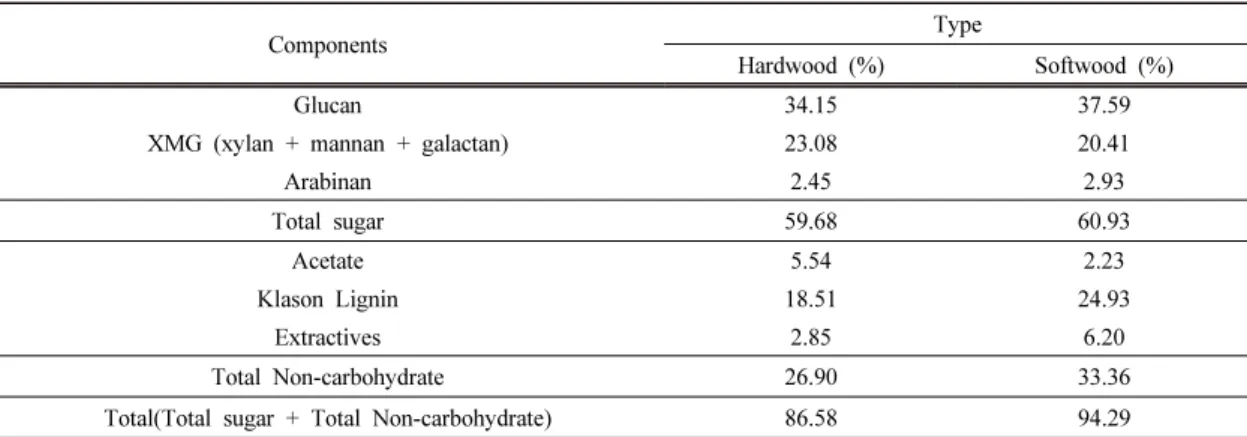
wood species in the wood chip sample was oak (Quercus), while softwood specie was pine (Pinus rigida Mill), and were supplied by the Daedong Industrial Co., Ltd. in Gyeongsang-do, Korea. The hard- and softwood chips were screened to an average of 35.2 × 20.8 × 4.4 mm and 32.1 × 18.5 × 5.4 mm, respectively, using a mechanically vibrated horizontal screen. The screened wood chips were used directly in GL chemical extraction studies. The screened chips were then ground to 30-40 mesh sized chip (0.595-0.420 mm) using a laboratory knife (System POLYMIX ® PX-MFX 90D, KINEMATICA AG, Luzern, Switzerland) prior to use. The milled wood chips were used for determination of total solids/moisture and carbohydrate content in biomass and the chem- ical composition of wood chips on dry basis is listed in Table 1.
2.2. Green liquor
Green liquor is the partially recovered form
of kraft pulping liquor. It is obtained after com-
bustion of the black liquor in the recovery boil-
er by dissolving the resulting smelt (containing
sodium sulfide, sodium carbonate, and any im-
purities) in water. In this study, a defined green
liquor was prepared using pure chemicals
(sodium sulfide, 90% extra pure; sodium carbo-
nate monohydrate, 99.5% extra pure; sodium
sulfate anhydrous, 99.7% extra pure; sodium
hydroxide, 97.0% extra pure; Fisher, Pittsburgh,
PA, USA). The Green Liquor was used in the
study under composition previously reported
(Um et al., 2011).
2.3. Prepulping extraction
The prepulping extraction were performed in a 1 ℓ rocking digester (General Purpose Vessel 4600, Parr Instrument Company, Moline, IL, USA). The digester was loaded with 80 g of dry wood chips and cooked with 0-5% TTA of GL. After extraction or cooking, the liquor is cooled below 100 ℃, then the liquor is drained vial. In the reactor, wood (on an oven-dry basis) was added to the digester at liquor to wood ratio of 4 : 1 g/g. The liquor to wood ratio is defined as the mass of extraction liquor (M L ) added to the extraction vessel plus the water in the wood (M w ) divided by the dry mass of wood, (M DryWood ) in expression Equation (1):
r L/W = [(M L + M W ) / M Drywood ] ··· (1) The hard- and softwood chips contained 11.5%
and 9.3% moisture (wet basis), respectively.
The alkali cooks also contained GL. As an example of digester loading, for 3% GL the required chemical addition was 2.4 TTA. The extraction was performed at a top temperature
of 180 ℃ for target H-factors of 900 at each chemical loading. The H-factor is a kinetic model applicable to alkaline pulping that expresses cooking time and temperature as a single variable. The H-factor is given by the expression Equation (2):
H-factor = ∫ t t0 e [43.19-(16,113/T)]
dt ··· (2) where time t is given in hours and the temper- ature T is given in degrees Kelvin. The nu- merical constants in the expression are related to the activation energy of 134 kJ/mol for delignification during kraft cooking. The digester heat-up period lasted 70 min before steady state was reached, and cool down after desired reaction time. Reactor pressure reached 1,000 kPa during extraction.
2.4. Secondary acid hydrolysis of prepulping extraction liquor
After the primary prepulping extraction, a secondary acid hydrolysis step was performed to hydrolyze oligomeric sugars into monomeric sugars before fermentation. Samples were hy-
Components Type
Hardwood (%) Softwood (%)
Glucan 34.15 37.59
XMG (xylan + mannan + galactan) 23.08 20.41
Arabinan 2.45 2.93
Total sugar 59.68 60.93
Acetate 5.54 2.23
Klason Lignin 18.51 24.93
Extractives 2.85 6.20
Total Non-carbohydrate 26.90 33.36
Total(Total sugar + Total Non-carbohydrate) 86.58 94.29
Table 1. Chemical Composition of Hard- and Softwood chips on Dry Basis
drolyzed at pH 0.5 with sulfuric acid, extra pure 96%, in an autoclave (Hemoss, Korea) at 121 ℃ for 60 min.
2.5. Liquid to liquid extraction experiments For a typical extraction procedure, equal volumes (5 m ℓ ) of the organic phase, Tri-n- alkylphosphine Oxide (TAPO, Cyanex 923, CYTEC, Inc., 93% purity, Woodland Park, NJ), and aqueous phase were charged in 15 m ℓ cen- trifuge tubes. A batch extraction was performed by vigorously shaking the vessels for 6 s, followed by 24-48 min in a thermostated water bath at 25-65 ℃, during which the shaking was repeated every 6 min. The samples were centri- fuged at 4000 rpm for 4 min to assist separa- tion of the two phases. Samples of both phases were analyzed immediately after the phase separation.
2.6. High performance liquid chromatography
The composition of reaction products was quantitatively analyzed by high performance liquid chromatography equipped with refractive index and UV detection. The Shimadzu high performance liquid chromatography system (Shimadzu Co., Nakagyo, Kyoto, Japan) used for carbohydrate measurement contained a Bio-Rad Aminex HPX-87H column (300 mm × 7.8 mm; Bio-Rad Laboratories Inc., Hercules, CA, USA). The column was maintained at 60 ℃, with a 5 mM sulfuric acid eluent at a flow rate of 0.6 m ℓ /min. All of the sugar peaks were
detected by refractive index and UV absorption (280 nm) and were identified and quantified by comparison to retention times of authentic standards. The Bio-Rad Aminex HPX-87H analytical column allows concurrent analysis of liquid samples for the presence of sugars and organic acids, as well as sugar degradation products such as furans.
2.7. Response surface methodology experimental design
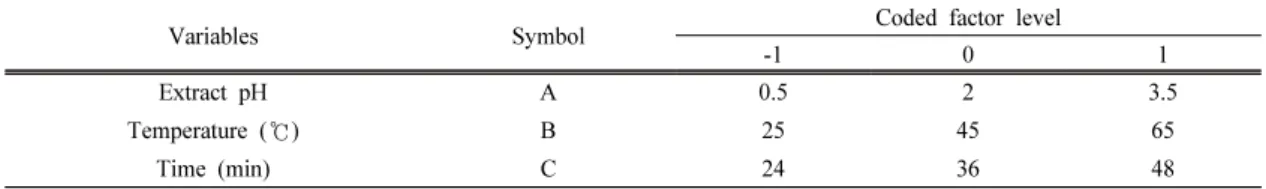
The optimal conditions were determined and the interaction of the environmental variables evaluated using a three-level factorial design model in a RSM study. Three independent variables, namely, pH, residence time, and tem- perature, were selected. The 17 sets of treat- ment combinations were analyzed using design expert statistical software (version 7.0.0, STAT-EASE Inc., Minneapolis, MN, USA).
The validity of the model was expressed as a regression coefficient (R 2 ) and the significance of the regression coefficients was evaluated by analysis of variance (ANOVA). A quadratic model was generated from the data according to the following equation (3):
Y = a 0 + a 1 A + a 2 B + a 3 C + a 11 AB + a 32 AC
+ a 33 BC + a 12 A 2 + a 13 B 2 + a 23 C 2 ···· (3)
where Y is the predicted response, A, B, C are
independent variables in code values, a 0 is a
constant, a 1 and a 2 are a linear effect. The pH
value (A), reaction temperature (B), and resi-
dence time (C) for the LLE were optimized by
using central composite design experiment to enhance the organic acid extraction yield. The design of this experiment including dependent variables or responses are shown in Table 2.
2.8. Extraction yield
A means of expressing extraction efficiency is percent extraction. Percent extraction is de- fined as the fraction of acetic acid (AA) re- moved from the aqueous phase into the organic phase in one extraction step, as shown in equa- tion (4) below:
% Extraction = [1-([HAc] remaining aq /
[HAc] initial aq )] × 100 ··· (4) where [HAc] is AA concentration; subscript
“org” is the designation of the acid concen- tration extracted from the aqueous phase in the organic phase; and subscript “aq” is the desig- nation of the acid concentration remaining in the aqueous phase.
3. RESULTS and DISCUSSION 3.1. Substrate extracted by various HW
(0% GL) and GL
The yield of extracted hemicelluloses was rel- atively low in the pre-pulping extraction process
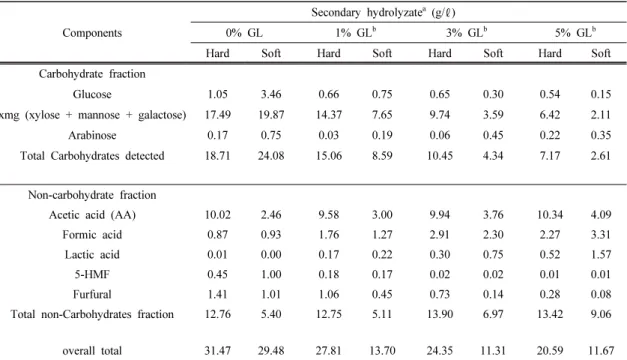
when carried out with GL than dilute acid pre-treatment. The low extraction yield was maintained because of concerns over loss of pulp yield and quality. The hemicellulose pre-extraction experiments with GL resulted in liquid extracts containing dilute oligo- saccharides, acetic acid (AA) liberated from the hemicellulose polymers, lignin, organic acid degradation products, and residual salts from the alkaline chemicals used. The concentration of monomer sugars, organic acids, and decom- posed chemicals (i.e. formic acid, 5-HMF, and furfural) released in the different wood chip ex- tracts after secondary acid hydrolysis with hot water (HW) (0% GL) and GL are listed in Table 3. In the Table 3, extract derived from hard- and softwood with GL was obtained by Kim et al., 2015. As the GL charge increases, the extracts released a large amount of organic acids, whilst the monomer sugar content decreased. The AA concentration of extracts derived from hard- and softwood reached a maximum of 10.34, 4.09 g/ ℓ at 5% GL, respectively. This was potentially high enough to have significant inhibitory effects on ethanol fermentation. However, the maximum concen- tration of xmg (= xylose + mannose + galactose) was 17.49 and 19.87 g/ ℓ for extracts derived from hard- and softwood, respectively, and was
Variables Symbol Coded factor level
-1 0 1
Extract pH A 0.5 2 3.5
Temperature ( ℃) B 25 45 65
Time (min) C 24 36 48
Table 2. Factors and their Levels for the Box-Behnken Design
generated in the extracts with 0% GL. The ex- traction using 0% GL generates acidic extracts due to the un-buffered release of acetyl groups from wood. This may have then resulted in the degradation of hemicellulose fibers by acid hydrolysis.
3.2. LLE performance: effect of pH and temperature with TAPO
The concentration of GL used in this study (0% and 3% Na 2 O equivalent on a dry wood basis) were selected on the basis of a previous study. At 0% the highest XMG concentration was detected and at 3% GL the quantity and quality of the Kraft pulp that could be produced
with the wood solids remaining after extraction was preserved (Mao et al., 2008).
In this study, the pH of pre-pulping extracts was increased from 0.5 to 3.5 with calcium carbonate to counteract the decrease in pH associated with secondary acid hydrolysis. The phase ratio was 1 : 1 (v/v). Extraction at a low pH is reasonable in the biorefinery process as the LLE extraction can follow acid hydrolysis.
The choice of a suitable extraction solvent for LLE mainly depends on its extractive capacity and equilibrium characteristics. Other factors include stability, a favorable density, viscosity, interfacial tension properties and a sufficient difference in boiling point between the solute and the solvent (Um et al., 2011).
Components
Secondary hydrolyzate
a(g/ ℓ)
0% GL 1% GL
b3% GL
b5% GL
bHard Soft Hard Soft Hard Soft Hard Soft
Carbohydrate fraction
Glucose 1.05 3.46 0.66 0.75 0.65 0.30 0.54 0.15
xmg (xylose + mannose + galactose) 17.49 19.87 14.37 7.65 9.74 3.59 6.42 2.11
Arabinose 0.17 0.75 0.03 0.19 0.06 0.45 0.22 0.35
Total Carbohydrates detected 18.71 24.08 15.06 8.59 10.45 4.34 7.17 2.61
Non-carbohydrate fraction
Acetic acid (AA) 10.02 2.46 9.58 3.00 9.94 3.76 10.34 4.09
Formic acid 0.87 0.93 1.76 1.27 2.91 2.30 2.27 3.31
Lactic acid 0.01 0.00 0.17 0.22 0.30 0.75 0.52 1.57
5-HMF 0.45 1.00 0.18 0.17 0.02 0.02 0.01 0.01
Furfural 1.41 1.01 1.06 0.45 0.73 0.14 0.28 0.08
Total non-Carbohydrates fraction 12.76 5.40 12.75 5.11 13.90 6.97 13.42 9.06
overall total 31.47 29.48 27.81 13.70 24.35 11.31 20.59 11.67
a
Determination of initial sugar and acetyl concentrations were performed by acid hydrolysis, using NREL standard methods No 002, under conditions of 121℃, pH = 0.5, and 60-min residence time.
b
Extract derived from hard and softwood were obtained by Kim et al., 2015.
Table 3. Composition Analysis of Extracts derived from Wood Chips after Secondary Hydrolysis
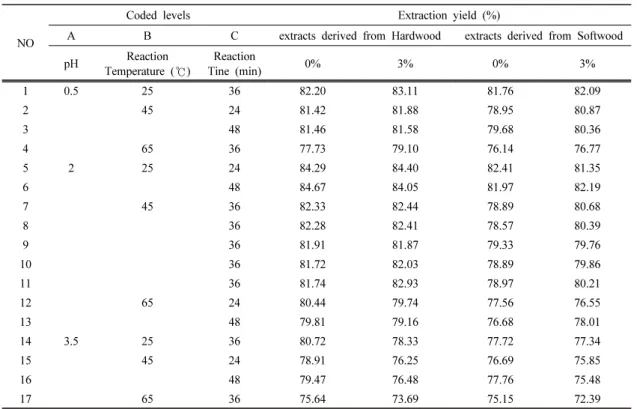
To evaluate the effect of three parameters (pH, temperature and residence time) on LLE with TAPO, the experiments were performed on the extraction yield of AA. The AA LLE of both 0% and 3% GL with TAPO were carried out on two different wood chips to compare their subsequent extraction yields. Table 4 shows comparative results for 0% and 3% GL extraction yield of AA with the three parameters. There is an increase in extraction yield with a moderate pH and low temperature, which could indicate a saturation effect for association with AA. On average, pH 2 and a low temperature lead to a high extraction yield.
Accordingly, AA had the lowest concentration in the aqueous phase at pH 2 and 25 ℃.
For 0% and 3% GL extracts derived from hardwood, the initial concentrations of AA in the aqueous phase were 10.02 and 9.94 g/ ℓ , respectively. The AA concentration in the 0%
GL organic phase increased to 84.67% ex- traction yield at pH 2, 25 ℃ and a residence time of 48 min. Furthermore, the 3% GL had an extraction yield of 84.40% at pH 2, 25 ℃ and a residence time of 24 min. At high tem- peratures, the extraction yield decreased, whilst the residence time did not significantly affect the extraction yield of AA. In 0% and 3% GL extracts derived from softwood, the initial con- centration of AA in the aqueous phase was 2.46 and 3.76 g/ ℓ , respectively. The AA con- centration in the 0% GL organic phase in-
NO
Coded levels Extraction yield (%)
A B C extracts derived from Hardwood extracts derived from Softwood
pH Reaction
Temperature ( ℃)
Reaction
Tine (min) 0% 3% 0% 3%
1 0.5 25 36 82.20 83.11 81.76 82.09
2 45 24 81.42 81.88 78.95 80.87
3 48 81.46 81.58 79.68 80.36
4 65 36 77.73 79.10 76.14 76.77
5 2 25 24 84.29 84.40 82.41 81.35
6 48 84.67 84.05 81.97 82.19
7 45 36 82.33 82.44 78.89 80.68
8 36 82.28 82.41 78.57 80.39
9 36 81.91 81.87 79.33 79.76
10 36 81.72 82.03 78.89 79.86
11 36 81.74 82.93 78.97 80.21
12 65 24 80.44 79.74 77.56 76.55
13 48 79.81 79.16 76.68 78.01
14 3.5 25 36 80.72 78.33 77.72 77.34
15 45 24 78.91 76.25 76.69 75.85
16 48 79.47 76.48 77.76 75.48
17 65 36 75.64 73.69 75.15 72.39
Table 4. The Extraction Yield of Acetic Acid (AA) after LLE Process using TAPO
creased to 82.41% extraction yield at pH 2, 25 ℃ and a residence time of 24 min.
Additionally, the 3% GL had an extraction yield of 82.19% at pH 2, 25 ℃ and a residence time of 48 min. Similar to hardwood, the ex- traction yield decreased at high temperatures, while residence time did not significantly affect the extraction yield of AA.
3.3. Optimization studies by statistical experimental design
Statistical analysis on the relationship be- tween responses and input variables with a se- lected range of the operating level was carried out using RSM. The three-dimensional surface plots were fitted to give a function relationship.
The range and levels of three independent variables, pH, temperature, and residence time were chosen (Table 2). According to the Box-Behnken experimental design, the co- efficients of the response surface model have been computed by means of a multiple linear regression method (Morgenthaler and Schumacher, 1999; Hsieh and Liou, 2001). An analysis of variance (ANOVA) can be con- ducted that sheds light on the quality of the regression equation. By applying an ANOVA to the regression model, the predicted response Y was obtained as
AA recovery yield of extracts derived from hard- wood with 0% GL (Y
AA) = 81.99 -1.01A -2.28B + 0.04C -0.15AB + 0.13AC-0.25BC-2.46A
2- 0.46B
2+ 0.77C
2AA recovery yield of extracts derived from hard- wood with 3% GL (Y
AA) = 82.33 -2.61A-2.27B-
0.13C -0.16AB + 0.13AC-0.06BC-3.28A
2- 0.49B
2-0.001C
2AA recovery yield of extracts derived from soft- wood with 0% GL (Y
AA) = 78.93 -1.15A-2.29B + 0.06C + 0.76AB + 0.08AC -0.11BC-1.31A
2+ 0.08B
2+ 0.65C
2AA recovery yield of extracts derived from soft- wood with 3% GL (Y
AA) = 80.18 -2.38A-2.41B + 0.18C + 0.09AB + 0.03AC + 0.15BC -2.21A
2- 0.82B
2+ 0.17C
2Where Y AA is the predicated AA recovery yield obtained from the different experimental con- ditions, and A, B, C are the coded values for the three variables, pH, temperature ( ℃), and residence time (min), respectively.
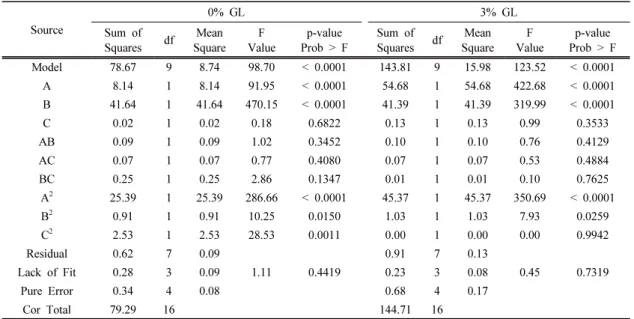
The significance of the model is studied by ANOVA. The significance of the model equa- tions was checked by the F test and shown in Table 5 and 6. The model F-values for extracts derived from hardwood with 0% GL, 3% GL and softwood with 0% GL, 3% GL were 98.70, 123.52, 23.85, and 42.59, respectively. The values are high enough to imply that all of the models obtained from the four different ex- perimental conditions were significant. The model probability values of extracts derived from hardwood with 0% GL, 3% GL, and soft- wood with 3% GL were less than < 0.0001 and that of softwood with 0% GL was 0.0002.
These values were low enough to show that the
model terms for all experimental conditions
were significant. The goodness of fit for the
models was also checked by the determination
coefficient R 2 . The R 2 values for extracts de-
rived from hardwood with 0% GL, 3% GL and
softwood with 0% GL, 3% GL were 0.992,
0.994, 0.968, and 0.982, respectively. This in- dicates that the models fitted well with the ob- served data. However, for extracts derived from softwood with 0% GL, the lack-of-fit values
were insignificant and showed that the con- structed models were suitable to describe the observed data. Fig. 2 and 3 show that the pre- dicted points versus actual plots for AA yield
Source
0% GL 3% GL
Sum of
Squares df Mean Square
F Value
p-value Prob > F
Sum of
Squares df Mean Square
F Value
p-value Prob > F Model 78.67 9 8.74 98.70 < 0.0001 143.81 9 15.98 123.52 < 0.0001 A 8.14 1 8.14 91.95 < 0.0001 54.68 1 54.68 422.68 < 0.0001 B 41.64 1 41.64 470.15 < 0.0001 41.39 1 41.39 319.99 < 0.0001
C 0.02 1 0.02 0.18 0.6822 0.13 1 0.13 0.99 0.3533
AB 0.09 1 0.09 1.02 0.3452 0.10 1 0.10 0.76 0.4129
AC 0.07 1 0.07 0.77 0.4080 0.07 1 0.07 0.53 0.4884
BC 0.25 1 0.25 2.86 0.1347 0.01 1 0.01 0.10 0.7625
A
225.39 1 25.39 286.66 < 0.0001 45.37 1 45.37 350.69 < 0.0001
B
20.91 1 0.91 10.25 0.0150 1.03 1 1.03 7.93 0.0259
C
22.53 1 2.53 28.53 0.0011 0.00 1 0.00 0.00 0.9942
Residual 0.62 7 0.09 0.91 7 0.13
Lack of Fit 0.28 3 0.09 1.11 0.4419 0.23 3 0.08 0.45 0.7319
Pure Error 0.34 4 0.08 0.68 4 0.17
Cor Total 79.29 16 144.71 16
Table 5. ANOVA for a Response Surface Quadratic Model using Extracts derived from Hardwood
Source
0% GL 3% GL
Sum of
Squares df Mean Square
F Value
p-value Prob > F
Sum of
Squares df Mean Square
F Value
p-value Prob > F Model 63.73 9 7.08 23.85 0.0002 116.13 9 12.90 42.59 < 0.0001
A 10.63 1 10.63 35.80 0.0006 45.20 1 45.20 149.20 < 0.0001
B 41.97 1 41.97 141.36 < 0.0001 46.31 1 46.31 152.85 < 0.0001
C 0.03 1 0.03 0.10 0.7657 0.26 1 0.26 0.85 0.3877
AB 2.33 1 2.33 7.84 0.0265 0.03 1 0.03 0.11 0.7501
AC 0.03 1 0.03 0.09 0.7682 0.00 1 0.00 0.02 0.9036
BC 0.05 1 0.05 0.16 0.6980 0.09 1 0.09 0.31 0.5971
A
27.25 1 7.25 24.41 0.0017 20.50 1 20.50 67.68 < 0.0001
B
20.02 1 0.02 0.08 0.7818 2.85 1 2.85 9.42 0.0181
C
21.81 1 1.81 6.08 0.0431 0.12 1 0.12 0.39 0.5523
Residual 2.08 7 0.30 2.12 7 0.30
Lack of Fit 1.78 3 0.59 8.05 0.0360 1.54 3 0.51 3.54 0.1267
Pure Error 0.30 4 0.07 0.58 4 0.14
Cor Total 65.81 16 118.25 16
Table 6. ANOVA for a Response Surface Quadratic Model using Extracts derived from Softwood
clustered along the diagonal line. This indicates that the predicted values match well with the observed values.
To examine the significance of the main effects and interacting effects of parameters on the AA yield, the data of ANOVA were used as shown in Table 5 and 6. In all experiments, statistical analysis of the experimental range studied identified pH and temperature as the most important factors in AA yield (since a value of Prob > F less than 0.05 indicates the
significance of the model term). However, the third factor, residence time, was statistically insignificant under all experimental conditions.
The quadratic terms of pH were significant in all cases but that of temperature for extracts derived from softwood with 0% GL was not.
The first-order effect of temperature in extracts derived from softwood with 0% GL was sig- nificant but the second-order effect was not.
This indicates that the AA yield is not im- proved by increasing time at high temperatures.
Fig. 2. The plot of predicted values versus actual values for (a) 0% GL, (b) 3% GL in the presence of extracts derived from hardwood.
Fig. 3. The plot of predicted values versus actual
values for (a) 0% GL, (b) 3% GL in the presence of
extracts derived from softwood.
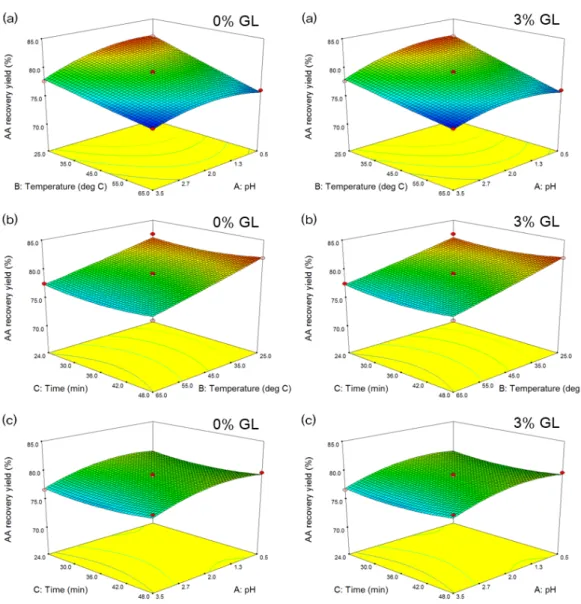
Response surface plots show the AA yield for a pair of interactive variables amongst pH, temperature, and residence time (Fig. 4 and 5).
The optimum values for the variables that maximize the response (AA recovery yield), were tracked using RSM. The maximized AA recovery yield with extracts derived from hard-
wood using 0% GL and 3% GL were 84.74%
at pH 1.47, 26.2 ℃, and 48.0 min and 84.41%
at pH 1.42, 27.0 ℃, and 39.5 min, respectively.
The AA recovery yield for extracts derived from softwood with 0% GL and 3% GL under optimized conditions were 82.43% (obtained at pH 0.61, 25.2 ℃, and 24.4 min) and 82.42%
Fig. 4. Estimated response surface for extraction yield showing the effects of (a) pH and temperature, (b) tem-
perature and time, and (c) pH and time in the presence of extracts derived from hardwood with 0, 3% GL.
(obtained at pH 0.90, 25.2 ℃, and 24.8 min), respectively.
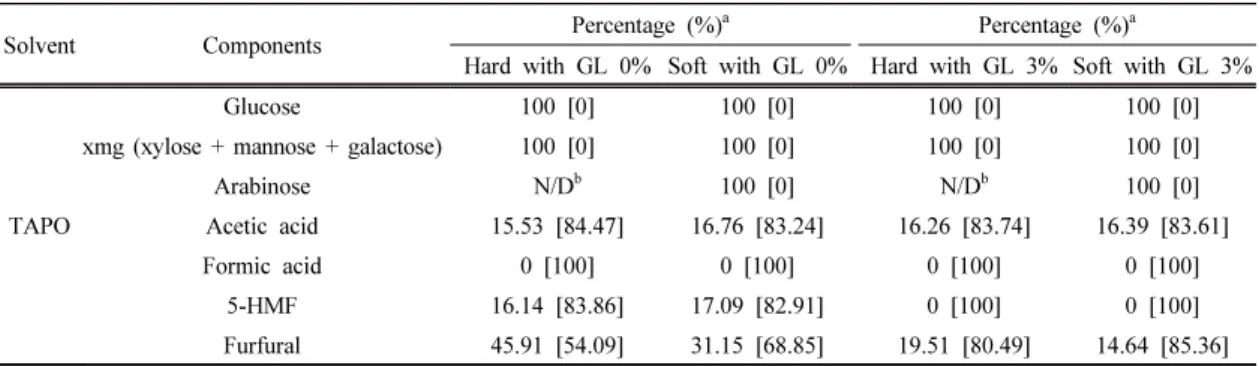
3.4. Effect of LLE process sugar reduction Sugar retention is important after LLE for fermentation in downstream processes. There
was concern that the extractant might remove sugar along with acetic acid during the con- ditioning of wood extracts for fermentation. The percentage of each sugar remaining in the aqueous phase after the LLE (at optimized con- ditions by RSM) and the experimental values for AA recovery yield are listed in Table 7.
Fig. 5. Estimated response surface for extraction yield showing the effects of (a) pH and temperature, (b) tem-
perature and time, and (c) pH and time in the presence of extracts derived from softwood with 0, 3% GL.
After the extraction, 100% of the sugar was retained in the aqueous phase in all wood extracts. The AA recovery yields of the wood extracts were similar with the predicted recovery yield values by RSM. Subsequently, the maximized AA recovery yield for extracts derived from hardwood with 0% GL and 3%
GL were 84.47% and 83.74%, respectively. The AA recovery yield for extracts derived from softwood with 0% GL and 3% GL under optimized conditions were 83.24% and 83.61%, respectively. Additionally, the recovery results for decomposed chemicals (i.e. formic acid, 5-HMF, and furfural) in extract at the optimum conditions are shown in Table 7. Here we see that at the maximum, 100% of the formic acid, 100% of the 5-HMF, and 85.36% of the furfural was recovered for LLE condition at pH 0.90, 25.2 ℃, and 24.8 min, which implies that most of the inhibitor chemicals has been removed prior to alcohol fermentation.
4. CONCLUSION
Hot water extraction (0% GL) achieved the highest xmg content in extracts derived from hard- and softwood chips (in a pressurized reactor under alkali solutions) after secondary acid hydrolysis. Additionally, 3% GL has been previously demonstrated to preserve the quantity and quality of the Kraft pulp produced from the wood solids remaining after extraction. To pro- duce a high-value-added final product such as bioethanol, AA recovery was performed prior to fermentation using LLE. For extracts derived from hard- and softwood with 0% and 3% GL, respectively, the extraction of AA recovery was optimized by RSM. The maximum experimental recovery yields of extracts derived from hard- and softwood with 0% and 3% GL were ob- tained at over 82.00% in pH 2 extracts. These optimal recovery conditions were predicted by RSM. Applying the RSM models obtained, the optimal conditions selected were extracts
Solvent Components Percentage (%)
aPercentage (%)
aHard with GL 0% Soft with GL 0% Hard with GL 3% Soft with GL 3%
TAPO
Glucose 100 [0] 100 [0] 100 [0] 100 [0]
xmg (xylose + mannose + galactose) 100 [0] 100 [0] 100 [0] 100 [0]
Arabinose N/D
b100 [0] N/D
b100 [0]
Acetic acid 15.53 [84.47] 16.76 [83.24] 16.26 [83.74] 16.39 [83.61]
Formic acid 0 [100] 0 [100] 0 [100] 0 [100]
5-HMF 16.14 [83.86] 17.09 [82.91] 0 [100] 0 [100]
Furfural 45.91 [54.09] 31.15 [68.85] 19.51 [80.49] 14.64 [85.36]
a
Remaining Percent in aqueous phase after LLE (= (concentration of remaining aqueous/concentration of initial aqueous) × 100).
b
N/D: Not Detect
c