• 검색 결과가 없습니다.

Possibility of Wood Classification in Korean Softwood Species Using Near-infrared Spectroscopy Based on Their Chemical Compositions

N/A
N/A
Protected

Academic year: 2021

Share "Possibility of Wood Classification in Korean Softwood Species Using Near-infrared Spectroscopy Based on Their Chemical Compositions"

Copied!
11
0
0

로드 중.... (전체 텍스트 보기)

전체 글

(1)

Original Article

Possibility of Wood Classification in Korean Softwood Species Using Near-infrared Spectroscopy Based on Their Chemical Compositions 1

Se-Yeong Park

2

⋅Jong-Chan Kim

2

⋅Jong-Hwa Kim

2

⋅Sang-Yun Yang

2

⋅ Ohkyung Kwon

3

⋅Hwanmyeong Yeo

2,4

⋅Kyu-Chae Cho

5

⋅In-Gyu Choi

2,4,6†

ABSTRACT

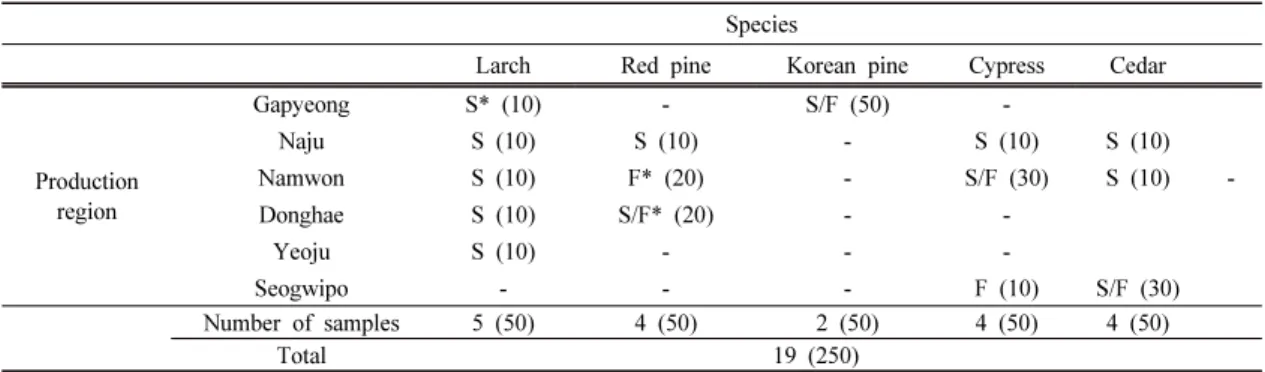
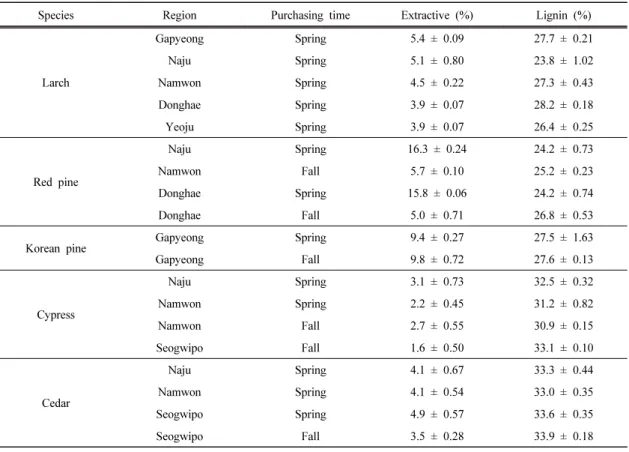
This study was to establish the interrelation between chemical compositions and near infrared (NIR) spectra for the classification on distinguishability of domestic gymnosperms. Traditional wet chemistry methods and infrared spectral analyses were performed. In chemical compositions of five softwood species including larch (Larix kaempferi), red pine (Pinus densiflora), Korean pine (Pinus koraiensis), cypress (Chamaecyparis obtu- sa), and cedar (Cryptomeria japonica), their extractives and lignin contents provided the major information for distinction between the wood species. However, depending on the production region and purchasing time of woods, chemical compositions were different even though in same species. Especially, red pine harvested from Naju showed the highest extractive content about 16.3%, whereas that from Donghae showed about 5.0%. These results were expected due to different environmental conditions such as sunshine amount, nutrients and moisture contents, and these phenomena were also observed in other species. As a result of the principal component analysis (PCA) using NIR between five species (total 19 samples), the samples were divided into three groups in the score plot based on principal component (PC) 1 and principal component (PC) 2; group 1) red pine and Korean pine, group 2) larch, and group 3) cypress and cedar. Based on the chemical composition results, it was concluded that extractive content was highly relevant to wood classi- fication by NIR analysis.

Keywords : Korean softwood species, gymnosperm, classification, chemical composition, extractives, near infrared spectroscopy, principal component analysis

1

Date Received February 14, 2017, Date Accepted March 6, 2017

2

Department of Forest Sciences, College of Agriculture and Life Sciences, Seoul National University, Seoul 08826, Republic of Korea

3

Nanobioimaging Center, National Instrumentation Center for Environmental Management, Seoul National University, Seoul 08826, Republic of Korea

4

Research Institute of Agriculture and Life Sciences, College of Agriculture and Life Sciences, Seoul National University, Seoul 08826, Republic of Korea

5

R&D, KC Tech In. Co. Ltd., Seongnam-si 13590, Republic of Korea

6

Institutes of Green-Bio Science and Technology, Seoul National University, Pyeongchang 25354, Republic of Korea

Corresponding author: In-Gyu Choi (e-mail : [email protected])

(2)

1. INTRODUCTION

Wood is the most abundant natural resource and is utilized in various fields such as building construction, furniture, bio-composites, and also fuels. Especially, it is being used in the lumber- ing industry because wood has external charac- teristics including unique colors, figures as well as odors. Wood is composed of major compo- nents, which are cellulose, hemicellulose, lignin and extractives, by the complex linkages with hydrogen bonding and ester/ether linkage (Park et al., 2016). These chemical structures have ef- fect on chemical/physical properties of the wood, and also those properties vary depending on their growth environments (McLean et al., 2014). Therefore, marks-of-origin must be re- quired when the woods are traded in the market. However, it is not easy to identify the wood species due to the difficulty of the instant analysis on their properties and it sometimes causes the serious argues between suppliers and consumers in the field.

The traditional wet chemical methods are a time-consuming and labor-intensive job though these provide reliable information for the classi- fication of wood determination through the chemical composition data. Alternatively, infra- red (IR) spectroscopic analysis has been consid- ered as an attractive technique for the qual- itative and quantitative classification of wood species to solve the problems due to its quick and non-destructive process (Xu et al., 2013).

Recently, near-infrared (NIR) spectroscopy has been applied for identification of wood

chemical compositions, eg., lignin and cellulose contents in coniferous decayed wood (Ishizuka et al., 2014), extractives, and Klason lignin in wood chips (Axrup et al., 2000), hemicellulose, cellulose and lignin in moso bamboo (Li et al., 2015). NIR spectroscopy measures the spectral absorbance in NIR region. In the region, the specific absorbance bands of target chemicals can be observed, and thus it can be possible to estimate the concentration or balance of chemicals.

The purpose of this study was to establish the interrelation between chemical compositions and the infrared spectra of the five Korean gymnosperms (Larix kaempferi, Pinus densi- flora, Pinus koraiensis, Chamaecyparis obtusa, and Cryptomeria japonica) grown in the Republic of Korea by the repetitive wet chem- ical composition, and infrared spectroscopic analysis. Additionally, principal component analysis (PCA) using NIR spectroscopy, which is one of the most effective methods to improve the data quality using two dimensional correla- tion plot between chemical compositions, was applied. Based on the PCA results, distinguish- ability of the five gymnosperm species was identified.

2. MATERIALS and METHODS 2.1. Sample preparation

For this study, larch (Larix kaempferi), red

pine (Pinus densiflora), Korean pine (Pinus

koraiensis), cypress (Chamaecyparis obtuse),

(3)

and cedar (Cryptomeria japonica) woods were purchased from the National Forestry Cooperative Federations in Republic of Korea.

Production regions of the five species were shown in Table 1. As presented in Table 1, S*

means the purchasing time in spring, whereas F* means in fall. To reduce the variations be- tween same wood species depending on pro- duction region, each wood lumber having sizes of 50 × 100 × 600 mm (thickness × width × length) was prepared at least 10 pieces. Each woody lumber including sapwood and heart- wood was shaved, and ground using wood crusher (PRCS-3300ED, Poongrim EMG, Hwaseong, Republic of Korea) and grinder (Cutting Mill Pulverisette 15, FRITSCH GmbH, Idar-Oberstein, Germany), respectively (particle size < 0.5 mm, or 40 mesh). For the analysis of chemical composition and infrared spectro- scopy, the ground powder were mixed thor- oughly, and stored at room temperature for fur- ther experiments. The total number of the sam- ples was classified into 19.

2.2. Chemical analysis

For the analysis of chemical composition of wood samples, 40 mesh powders were used.

The extractives, lignin and sugar contents of five species were analyzed according to National Renewable Energy Laboratory (NREL, USA) analytical procedures (Sluiter et al., 2005; Sluiter et al., 2008). The relative mono- saccharide proportions were calculated after an- alyzing holocellulose contents in different wood samples using Bio-LC (ICS-2500, Dionex, USA) (Jang et al., 2015). These analytical re- sults can provide the characteristic information depending on species and production region.

2.3. Infrared spectroscopic analysis 2.3.1. Fourier transform Infrared spectroscopy

(FT-IR)

The 80 mesh samples were prepared to ob- tain the mid-IR spectrum of 19 samples. 32 scans were recorded in 4,000-650 cm

-1

at a spectral resolution of 8 cm

-1

using FT-IR spec-

Species

Larch Red pine Korean pine Cypress Cedar

Production region

Gapyeong S* (10) - S/F (50) -

Naju S (10) S (10) - S (10) S (10)

Namwon S (10) F* (20) - S/F (30) S (10) -

Donghae S (10) S/F* (20) - -

Yeoju S (10) - - -

Seogwipo - - - F (10) S/F (30)

Number of samples 5 (50) 4 (50) 2 (50) 4 (50) 4 (50)

Total 19 (250)

S* : Purchased in spring F* : Purchased in fall

S/F* : Purchased in both spring and fall ( ) : The total number of wood lumber

Table 1. Species and production region of woods used in this study

(4)

trometer (Nicolet 6700, Thermo Scientific, USA). As a reference, the background spectrum of air was collected, and the wood samples were measured directly on the ZnSe ATR crystal. To identify the spectral data, OMNIC 9.2 software (Thermo Scientific, USA) was used. All spectra in this study were measured in triplicate, and each spectrum was presented using an average value.

2.3.2. Near-Infrared spectroscopy (NIR) NIR spectra were obtained using a NIR in- strument (SpectraStar 2600 XT-R, Unity Scientific, USA). 40 mesh wood samples were put into a cup-holder in a diameter of 10 cm, and 12 scans to average were recorded in 680-2500 nm at intervals of 1 mm. To identify NIR spectrum, OMNIC 9.2 software (Thermo Scientific, USA) was used. Additionally, the overall spectra was performed with further data pretreatment, Savitsky-Golay 2

nd

derivative (polynomial order : 3, smoothing point : 21).

2.3.3. Principal component analysis (PCA) The score plot of the first principal compo- nent (PC1) and the second principal component (PC2) based on PCA to observe the clusters in wood species was used. If the score plot scat- tered separately by wood species, it would be better to classify them for each species.

Unscrambler software (CAMO, Norway) was used for multicomponent analysis by using the PCA. Data pretreatment was performed with the same procedure presented in 2.3.2.

3. RESULTS and DISCUSSION 3.1. Chemical characteristics

3.1.1. Chemical composition

The chemical composition of the wood sam- ples of five domestic softwoods depending on purchasing conditions were analyzed, and Table 2 showed the results of their extractive and lig- nin contents. The extractive contents were de- termined to be around 16% for red pine, 9%

for Korean pine, which were higher than other species including larch (average; 4.6%), cypress (average; 2.4%), and cedar (average; 4.2%).

However, red pine samples purchased in fall showed considerably different extractive con- tents about more than 5% compared to that in spring. In general, the heartwood part is known to have more plenty of extractive contents than the sapwood part (Grabner et al., 2005). It seems that red pine timber harvested in fall was mostly comprised of sapwood part, leading to lower extractive content. Meanwhile, the lignin content of cypress (30.9-33.1%) and cedar (33.0-33.9%) was greater than those of the oth- er species, respectively.

Fig. 1 indicated the relative portion of mono-sugars in cellulose and hemicellulose ana- lyzed by Bio-LC. In all wood species, their holocellulose were comprised of glucose, gal- actose, mannose, xylose, and arabinose. In case of rhamnose, which was one of the mono-sug- ars, it was also detected in several species.

However, the rhamnose was not marked be-

cause they were small in quantity. Glucose por-

(5)

Fig. 1. Mono-sugar proportion in holocellulose of 19 wood species.

Species Region Purchasing time Extractive (%) Lignin (%)

Larch

Gapyeong Spring 5.4 ± 0.09 27.7 ± 0.21

Naju Spring 5.1 ± 0.80 23.8 ± 1.02

Namwon Spring 4.5 ± 0.22 27.3 ± 0.43

Donghae Spring 3.9 ± 0.07 28.2 ± 0.18

Yeoju Spring 3.9 ± 0.07 26.4 ± 0.25

Red pine

Naju Spring 16.3 ± 0.24 24.2 ± 0.73

Namwon Fall 5.7 ± 0.10 25.2 ± 0.23

Donghae Spring 15.8 ± 0.06 24.2 ± 0.74

Donghae Fall 5.0 ± 0.71 26.8 ± 0.53

Korean pine Gapyeong Spring 9.4 ± 0.27 27.5 ± 1.63

Gapyeong Fall 9.8 ± 0.72 27.6 ± 0.13

Cypress

Naju Spring 3.1 ± 0.73 32.5 ± 0.32

Namwon Spring 2.2 ± 0.45 31.2 ± 0.82

Namwon Fall 2.7 ± 0.55 30.9 ± 0.15

Seogwipo Fall 1.6 ± 0.50 33.1 ± 0.10

Cedar

Naju Spring 4.1 ± 0.67 33.3 ± 0.44

Namwon Spring 4.1 ± 0.54 33.0 ± 0.35

Seogwipo Spring 4.9 ± 0.57 33.6 ± 0.35

Seogwipo Fall 3.5 ± 0.28 33.9 ± 0.18

Table 2. Extractive and lignin contents in five species depending on purchasing conditions

(6)

tion was ranged from 54.7 to 72.6%, and that was definitely identified as a main sugar in holocellulose. As presented in Fig. 1, larch wood distinctively showed higher galactose por- tion than others. It was why that larch wood is known for as distinct species having a plenty of certain polysaccharides comprised of arabinose and galactose in the form of arabinogalactan (Cho et al., 1982). Therefore, glucose portion of larch wood was relatively lower than that of others.

3.1.2. Functional groups of wood samples Typical absorptions of the wood components were observed in the FT-IR spectra at 1900-850 cm

-1

presented in Fig. 2. Wide bands from 875 to 1400 cm

-1

indicated the absorbance region of cellulose and hemicellulose. Absorbances re- lated to lignin originated from aromatic skeleton including C=C, and C-O groups, were observed from 1200 to 1700 cm

-1

(Sills and Gossett.

2012). Especially, the bands for aromatic skel- eton vibrations were assigned at 1595, 1500, 1465 and 1425 cm

-1

. The band around 1700 cm

-1

indicated C=O bonds in extractives as well as lignin components in the COH (aldehyde) or COOH (carboxyl) group. Particularly, red pine and Korean pine of five species showed in- tensive absorbance peaks on the spectra because they have higher extractive contents than other species. In addition, lignin absorbance region slightly appeared differently at each sample.

Apart from the regions related to extractives and lignin on FT-IR spectra data, however, there was no distinct difference between each species.

3.2. Classification of wood based on NIR spectroscopy

3.2.1. Absorbance bands of NIR spectra

Fig. 3 (A) showed the results of the raw

Fig. 2. FT-IR spectra of 19 wood samples used in study.

(7)

spectra of 19 samples without any data processing. Broad and overlapped spectral dis- tribution was observed between each sample.

The spectral region ranging from 1000-1200 nm is represented as lignin band assignment re- ported in previous study (Alves et al., 2012). In 1200-1600 nm region, bands related to cellulose component are mainly observed (Schwanninger et al., 2011). However, in overall absorption re-

gion, O-H, and C-H bands arose from all wood components were distributed. It caused diffi- culty of precise interpretation of the band as- signment in NIR spectra of wood components.

As shown in Fig. 3 (B), Savitsky-Golay 2

nd

de- rivative data pretreatment was applied to more precise comparison for wood classification.

Around 1000-1250 and 1600-1800 nm, shape

differences on the spectra were observed. The

Fig. 3. NIR spectra of 19 wood samples without data processing (A), and with 2

nd

derivative pretreatment (B).

(8)

1600-1800 nm region were particularly attrib- uted to 1

st

overtone of C-H bond originated from -CH

2

, -CH

3

, and = CH

2

in lignin and ex- tractives (Schwanninger et al., 2011). It seems that chemical compositions of 19 samples re- sulted in such spectral differences, and thus classification of the wood species will be possi- ble at further PCA analysis. Meanwhile, absorp- tion bands from 1830-1950 nm in Fig. 3 (B), are related to O-H stretching in moisture. It provides significant information for NIR analy- sis because moisture contents vary depending on wood state, leading to spectral changes.

Another distinct peak was observed from 1380 to 1480 nm, which were due to the measure- ment limit of the instrumentation in this study.

Therefore, the regions associated with moisture as well as measurement limit can be treated by excluding the range for the better data quality.

3.2.2. Classification of wood using PCA PCA for classification of 19 wood samples using NIR spectra were performed. As men- tioned above 3.2.1, absorbance of the measure- ment limit of the instrumentation and the mois- ture can provide inaccurate data on PCA result.

Therefore, the regions both 1380-1480 and

1830-1950 nm were excluded. Fig. 4 showed

the clusters of 19 samples, and the points were

marked differentially depending on wood

species. Based on 0 (zero) of PC1 value, larch

samples were independently divided around

-0.005~0.000, while cypress and cedar were

classified similarly as positive value. On the

other hand, red pine and Korean pine were

comparatively scattered than other species. We

categorized the wood species according to their

chemical compositions measured by wet chem-

istry methods. Fig. 5 (A) showed the score plot

Fig. 4. Score plot of the 19 samples by PCA analysis based on NIR spectra. (Spectral pretreatment with remov-

ing from both 1380-1480 nm and 1830-1950 nm due to the measurement limit of the instrumentation and the

moisture)

(9)

of larch, cypress and cedar species. They could be possible to observe the divided cluster, while red pine and Korean pine presented in Fig. 5 (B) were not easy to classify according to

species. Korean pines were positioned closely,

and presented as positive value. However, red

pines were divided into three groups on the

score plot. It was possible to explain why two

Fig. 5. Score plot of the larch, cypress and cedar species by PCA analysis based on NIR spectra (A), and that

of red pine and Korean pine (B). (Spectral pretreatment with removing from both 1380-1480 nm and 1830-1950

nm due to the measurement limit of the instrumentation and the moisture)

(10)

points of red pine as positive value based on PC1 have lower extractive contents than other two points marked as negative value.

Nevertheless, the two samples of red pine pre- sented as negative value, which have higher extractive contents about 16%, were also separated. As mentioned above 2.3.1, chemical components of woods affected the spectral differences. As a result of the both PCA and chemical composition, extractive content was highly relevant to wood classification.

4. CONCLUSIONS

In this study, NIR spectroscopy was used for the classification on distinguishability of five Korean domestic gymnosperms (larch, red pine, Korean pine, cypress, cedar). Based on the tra- ditional wet chemistry methods, chemical com- positions of all wood samples of 19 were meas- ured, and it was confirmed that production re- gion and purchasing time affected on wood chemical properties. As a result of PCA using all of NIR spectra, larch wood was clearly clas- sified, and also cypress and cedar were grouped in the similar category. However, it was not easy to classify the red pine and Korean pine.

Therefore, further study must be performed for more accurate classification of that wood species.

ACKNOWLEDGEMENT

This research was financially supported by the Forest Science & Technology Projects (Project No.

S111616L060120) funded by Korea Forest Service.

REFERENCES

Alves, A., Santos, A., Rozenberg, P., Pâques, L.E., Charpentier, J.-P., Schwanninger, M., Rodrigues, J. 2012. A common near infrared-based partial least squares regression model for the prediction of wood density of Pinus pinaster and Larix

× eurolepis . Wood Science and Technology 46(1-3): 157 ∼175.

Axrup, L., Markides, K., Nilsson, T. 2000. Using miniature diode array NIR spectrometers for ana- lysing wood chips and bark samples in motion.

Journal of Chemometrics 14(5-6): 561 ∼572.

Cho, N., Lee, J., Ahn, W. 1982. Studies on the char- acteristics of extractives in Japanese larch ( Larix leptolepis Gorden ) grown in Korea. Journal of Korean Wood Science and Technology 10(2): 12

∼21.

Grabner, M., Müller, U., Gierlinger, N., Wimmer, R.

2005. Effects of heartwood extractives on me- chanical properties of larch. IAWA Journal 26(2): 211 ∼220.

Ishizuka, S., Sakai, Y., Tanaka-Oda, A. 2014.

Quantifying lignin and holocellulose content in coniferous decayed wood using near-infrared re- flectance spectroscopy. Journal of Forest Research 19(1): 233 ∼237.

Jang, S.-K., Jeong, H.-S., Hong, C.-Y., Kim, H.-Y., Ryu, G.-H., Yeo, H., Choi, J. W., Choi, I.-G.

2015. Changes of furfural and levulinic acid yield from small-diameter Quercus mongolica depending on dilute acid pretreatment conditions.

Journal of the Korean Wood Science and Technology 43(6): 838 ∼850.

Li, X., Sun, C., Zhou, B., He, Y. 2015.

Determination of hemicellulose, cellulose and

lignin in moso bamboo by near infrared

spectroscopy. Scientific Report 5: 17210.

(11)

McLean, J.P., Jin, G., Brennan, M., Nieuwoudt, M.K., Harris, P.J. 2014. Using NIR and ATR-FTIR spectroscopy to rapidly detect com- pression wood in Pinus radiata . Canadian Journal of Forest Research 44(7): 820 ∼830.

Park, S.-Y., Hong, C.-Y., Jeong, H.-S., Lee, S.-Y., Choi, J.W., Choi, I.-G. 2016. Improvement of lignin oil properties by combination of organic solvents and formic acid during supercritical depolymerization. Journal of Analytical and Applied Pyrolysis 121: 113 ∼120.

Sills, D.L., Gossett, J.M. 2012. Using FTIR to pre- dict saccharification from enzymatic hydrolysis of alkali-pretreated biomasses. Biotechnology and Bioengineering 109(2): 353 ∼362.

Schwanninger, M., Rodrigues, J.C., Fackler, K. 2011.

A review of band assignments in near infrared spectra of wood and wood components. Journal

of Near Infrared Spectroscopy 19(5): 287 ∼308.

Sluiter, A., Ruiz, R., Scarlata, C., Sluiter, J., Templeton, D. 2005. Determination of ex- tractives in biomass. Laboratory Analytical Procedure. National Renewable Energy Laboratory, Golden, Co., USA.

Sluiter, A., Hames, B., Ruiz, R., Scarlata, C., Sluiter, J., Templeton, D., Crocker, D. 2008.

Determination of structural carbohydrates and lignin in biomass. Laboratory Analytical Procedure. National Renewable Energy Laboratory, Golden, Co., USA.

Xu, F., Yu, J., Tesso, T., Dowell, F., Wang, D.

2013. Qualitative and quantitative analysis of lignocellulosic biomass using infrared techni- ques: A mini-review. Applied Energy 104: 801

∼809.

수치

Table 1. Species and production region of woods used in this study
Fig. 1. Mono-sugar proportion in holocellulose of 19 wood species.

참조

관련 문서