한국컴퓨터정보학회 하계학술대회 논문집 제19권 제2호 (2011. 6)
49
컬러히스토그램의 장면 전환 검출을 이용한 수면의 질 향상
신성윤*, 신광성○, 이현창**, 이양원*
*○군산대학교 컴퓨터정보공학과
**원광대학교 정보전자상거래학부
e-mail: {s3397220, ywrhee}@kunsan.ac.kr, [email protected]
Enhancement of Sleep Quality Using Scene Change Detection of Color Histogram
Seong-Yoon Shin*, Kwang-Seong Shin○, Hyun-Chang Lee**, Yang-Won Rhee*
*○Dept. of Computer Information Science, Kunsan National University
**Division of Information and Electric Commerce, Wonkwang University
● 요 약 ●
In this paper we collect data concerning sleep environments in a bedroom and analyze the relationship between the collected condition data and sleep. In addition, this paper detects scene changes from the subjects in a sleeping state and presents the physical conditions, reactions during sleep, and physical sensations and stimuli. To detect scene changes in image sequences, we used color histogram for the difference between the preceding frame and the current frame. In addition, to extract the tossing and turning for different situations, the subjects were instructed to enter the level of fatigue, the level of drinking, and the level of stomach emptiness.
키워드: Sleep Enviwonments, Scene Change Detection, Tossing and turning, Color Histogram
I. Introduction
No one would doubt that sleep is a natural physiological phenomenon. People are said to spend about one-third of their life sleeping [1]. Ordinary people get about eight hours of sleep per day. Simply put, we spend one-third of our lifetime, a relatively long period of time, sleeping.
Creating a pleasant sleep environment is of utmost significance considering that sleep accounts for most of the time people these days spend at home, and that people while sleeping are exposed without protection to various environments, as a rule[2].
Sleep consists of two different states: non-rapid eye movement (NREM) and rapid eye movement (REM)[3]. NREM sleep accounts for 70 percent of the total sleep time in many young adults. During NREM, muscles are relaxed, all body tissue rests, and beta waves disappear while delta waves or slow waves increase. NREM sleep is divided into four stages: light sleep in the first and second stages, and deep sleep (or slow wave sleep) in the third and fourth stages.
II. Sleep State Recogintion
2.1 Tiny OS
The following are three features of TinyOS:
① Component-based architecture
② Task-based and event-driven concurrency
③ Classified motion
2.2 Sensors
The sensor H-MOTE2420 includes the microphone sensor(WM62A), the temperature/humidity sensor(SHT11), and the light sensor(GL5507). Since the microphone sensor is not needed here, we will dispense with it. Made by SENSIRION, the light sensor GL5537 has a proven history of reliability;
it has been thoroughly tested and passed the stability testing.
2.3 Scene Change Detection
When it comes to comparing the color histogram (dr,g,b(fi,fj)),each of the R·G·B color space for the two neighboring frames (fi,fj) is calculated. It is defined as in Ex(1).
한국컴퓨터정보학회 하계학술대회 논문집 제19권 제2호 (2011. 6)
50
(
)
) ( ) (
) ( ) (
) ( ) ( )
, (
1
0 ,
,
k H k H
k H k H
k H k H f
f d
b j b i
g j g i N
k
r j r i j
i b g r
− +
− +
−
=∑−
=
Ex (1)
) (k
Hir ,Hig(k) and Hib(k) represent the number(N) of the bin(k) in the ith frame(fi)for the respective color space (r,g,b).While the color histogram method is highly sensitive not only to the motion of a camera and an object, but also to light and shade, resulting in a loss of lots of data, we have found out that this method is a good trade-off between accuracy and speed.
III. Experiments
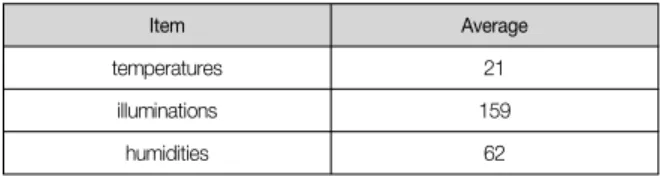
Our experiment was performed using Visual C++ 6.0 and MySQL running on Microsoft Windows XP. In addition, pictures were taken of the twenty people who were induced to have a deep sleep for one hour; these data were used for the sleep experiment. Table 1 shows the average values detected by the sensors.
Item Average
temperatures 21
illuminations 159
humidities 62
Table 1. Sensor-detected average values
Once all required information is entered by the user and sensors, scene change detection is executed wherein the sum of Ex (1) is multiplied by 1/3N. In a nutshell, the whole is divided by 3N in such a way that groups respective R·G·B graphs into a single one.
Figure 2 shows an example of the key frame which was obtained through setting the threshold at 400 for scene change detection.
Fig. 2 Extracted Key Frame.
IV. Conslusion
In this paper, we figured out the number of times the subjects tossed and turned in their sleep, by the use of color histogram, a scene change detection technique. Based on the data entered through the sensors as well as the user-entered data, we found out the relationship between the number of times the subjects tossed and turned while sleeping, and the levels of satisfaction they expressed after having a deep sleep. In this paper, those data and the scene changes detected were used to provide the best sleep environment for the users, thereby enhancing sleep quality.
References
[1] Parsons, H.M., “The Bedroom”, Human factors, 14(5), 1972.
[2] Kim Minhee, Kim Minjae, Chun Chungyoon, “The Research on Sleep Environment and Sleep Quality in Winter and Spring,” Proc. of KIAEBS, pp. 125-128, 2008. 10.
[3] Anil N. Rama, S. Charles Cho and Clete A. Kushida, “NREM –.REM sleep,” Handbook of Clinical Neurophysiology, Vol.
6, pp. 21-29, 2005.