Comparative Evaluation of Standardized Precipitation Index (SPI) and Effective Drought Index (EDI) for Meteorological Drought
Detection over Bangladesh
SPI와 EDI 가뭄지수의 방글라데시 기상가뭄 평가 적용성 비교
Kamruzzaman, M.
a⋅Cho, Jaepil
b⋅Jang, Min-Won
c⋅Hwang, Syewoon
d,✝모하마드 캄루자먼⋅조재필⋅장민원⋅황세운
Abstract
A good number of drought indices have been introduced and applied in different regions for monitoring drought conditions, but some of those are region-specific and have limitations for use under other climatic conditions because of the inherently complex characteristics of drought phenomenon.
Standardized Precipitation Index (SPI) indices are widely used all over the world, including Bangladesh. Although newly developed, studies have demonstrated The Effective Drought Index (EDI) to perform better compared to SPIs in some areas. This research examined the performance of EDI to the SPI for detecting drought events throughout 35 years (1981 to 2015) in Bangladesh. Rainfall data from 27 meteorological stations across Bangladesh were used to calculate the EDI and SPI values. Results suggest that the EDI can detect historical records of actual events better than SPIs.
Moreover, EDI is more efficient in assessing both short and long-term droughts than SPIs. Results also indicate that SPI3 and the EDI indices have a better capability of detecting drought events in Bangladesh compared to other SPIs; however, SPI1 produced erroneous estimates. Therefore, EDI is found to be more responsive to drought conditions and can capture the real essence of the drought situation in Bangladesh. Outcomes from this study bear policy implications on mitigation measures to minimize the loss of agricultural production in drought-prone areas. Information on severity level and persistence of drought conditions will be instrumental for resource managers to allocate scarce resources optimally.
Keywords: Effective drought Index (EDI), Standardized Precipitation Index (SPI), meteorological drought, Bangladesh
Ⅰ. Introduction
Drought is a short-lived, perhaps recurring chronic natural hazard, originating from a sustained period of water deficit, and usually occurring when a region does not receive a substantial amount of precipitation for a long time, typically several months (Chen et al., 2009) and can bring huge economic loss as well as human sufferings. The drought has been classified mainly meteorological, agricultural, hydrological, and socio-economical
from disciplinary perspectives. Meteorological drought is defined on the basis of the degree of dryness and the duration of the dry period (Wilhite, D.A. and M.H. Glantz, 1985).
Meteorological drought occurs when the reduction in rainfall for a specified period (day, month, season or year) is below a specified amount - usually defined as some proportion of the long-term average. It is typically an expression of precipitation’s departure from normal over a while (Selvaraju and Baas, 2007).
Bangladesh is one of the most natural disaster-prone countries;
drought is the most complex but least understood of all natural hazards in Bangladesh. There are many places in Bangladesh where every step of agriculture, from field preparation to harvesting of crops, depends on rainfall (Alamgir et al. 2015).
Consequently, drought affects 2.5 million ha in the wet season and 1.2 million ha in the dry season annually (Mondal 2010).
Therefore, drought-resilient agriculture is essential to attain sustainable agricultural development ensuring food security in Bangladesh. Appropriate information on drought characteristics concerning onset, extent, intensity, duration, and impacts can mitigate drought-related losses in agriculture, human suffering,
a Ph.D. Fellow, Dept. of Agricultural Engineering, Institute of Agriculture and Life Science, Gyeongsang National University
b Senior researcher, Research Department, APEC Climate Center, Busan, Rep. of Korea
c Associate Professor, Dept. of Agricultural Engineering, Institute of Agriculture and Life Science, Gyeongsang National University
d Associate Professor, Dept. of Agricultural Engineering, Institute of Agriculture and Life Science, Gyeongsang National University
† Corresponding author
Tel: +82-055-772-1934 Fax: +82-055-772-1939 E-mail: [email protected]
Received: September 27, 2018 Revised: January 8, 2019 Accepted: January 8, 2019
and the environment. However, the start and end of the drought are difficult to determine (Tannehill 1947) due to its slow development characteristics. The success of the drought prediction depends on how accurately it is identified. Precise information on drought characteristics can be obtained through monitoring and, usually using drought indices (Dogan et al., 2012).
Over the years, more than 150 different drought indices (DIs) forecasting has been developed and applied to quantify drought status (Zargar et al. 2011). Most of the available DIs are region-specific and of limited use under other climatic conditions because of the inherently complex characteristics of drought phenomenon (Jain et al., 2015). For instance, PDSI (Palmer, 1965), is extensively used in the United States, the RDDI (Gibbs and Maher, 1967) is operational in Australia, the china Z-index (CZI) is used by the national metrological center in China (Wu et al., 2001), EDI (Byun and Wilhite, 1999) is used by the East Asian Drought Monitoring System that has been operational since 2008 (Oh et al.,2010) and SPI (McKee, 1993) is being used widely, including by the Bangladesh Metrological Department (BMD) because of its adaptability to different time scales and climatic conditions.
In Bangladesh, several studies have been carried out on drought assessment and also its impacts (Mondal et al., 2017;
Miah, 2017; Islam et al.,2016; Rahman and lateh, 2016; Alamgir et al., 2015; Alam et al., 2013; Hasan et al., 2013; Dash et al., 2012; Rafiuddin et al., 2011; Shahid and Behrawn, 2008).
Most of the studies were used the Standardized Precipitation Index (SPI) except Miah, 2017 and Islam et al., 2016 using SPEI indices. However, SPI has some limitations. Compared to other drought indices, the EDI has several advantages (Byuan and Kim, 2010), but, no index is ideal and/or universally suitable. Several comparative studies have been carried out in the past to find suitable DIs for analyzing the drought characteristics in a particular region. Morid et al. (2006) compared seven rainfall based DIs for drought monitoring in the Tehran province, Iran. Percent of Normal (PN), Rainfall Deciles (RDs), Statistical Z Score (Z-Score), and Standardized Precipitation Index (SPI), China-Z index (CZI), Modified China Z Index (MCZI), and Effective Drought Index (EDI) were used in the study. Results showed that SPI and EDI performed better in detecting the onset of drought. They also noted that EDI was more responsive to the initiation of a drought. Pandey et al.
(2008) used a software package (Spatial and Time Series Information Modeling- SPATSIM) (Smakhtin and Hughes, 2007) to investigate historical drought severity in Orissa (India) and found that EDI performed better than any other DIs. Dogan et al. (2012) suggest that EDI is coherent with many time steps of other DIs. They indicated that EDI should be incorporated with any other DI to monitor droughts. Jain et al. (2015) compared DIs including SPI and EDI for their suitability in the Ken River Basin (India). The study revealed that 1-month time steps in all DIs produced erroneous drought duration, and drought duration varies too much with different time steps.
Multiple time steps of DIs make it hard to decide which time step is the best to show drought conditions. In this case, EDI is free from time step problems that have self-defined time steps in itself. Buyn and Kim, 2010 compared the performance evaluation of the Effective Drought Index (EDI) with 1-, 3-, 6-, 9-, 12-, and 24-month Standardized Precipitation Indices (SPIs) using drought monitoring data accumulated over the 200-year from 1807 to 2006 for Seoul, Korea to select a underlying drought index. The results confirmed that the EDI was more efficient than the SPIs in assessing both short and long-term droughts.
Therefore, it can be said that the choice of indices for drought monitoring in a specific area should eventually be based on the quantity of climate data available and on the ability of the index to consistently detect spatial and temporal variations during a drought event. So far, no initiative has been undertaken to evaluate drought over Bangladesh using the EDI. Therefore, this paper aims to compare the performance and assess the applicability of EDI and SPI indices over Bangladesh. The comparison is determined based on their ability to detect historical drought events over Bangladesh.
Ⅱ. Study Area and Data 1. Study Area
The study area covers Bangladesh, which is located in the
tropics between 20°34ˊ and 26°38ˊ north latitudes and 88°01ˊ
and 92°41ˊeast longitudes in South Asia and is bounded by India
on the west, the north and the northeast and Myanmear on the
south-east. The Bay of Bengal demarcates the southern border
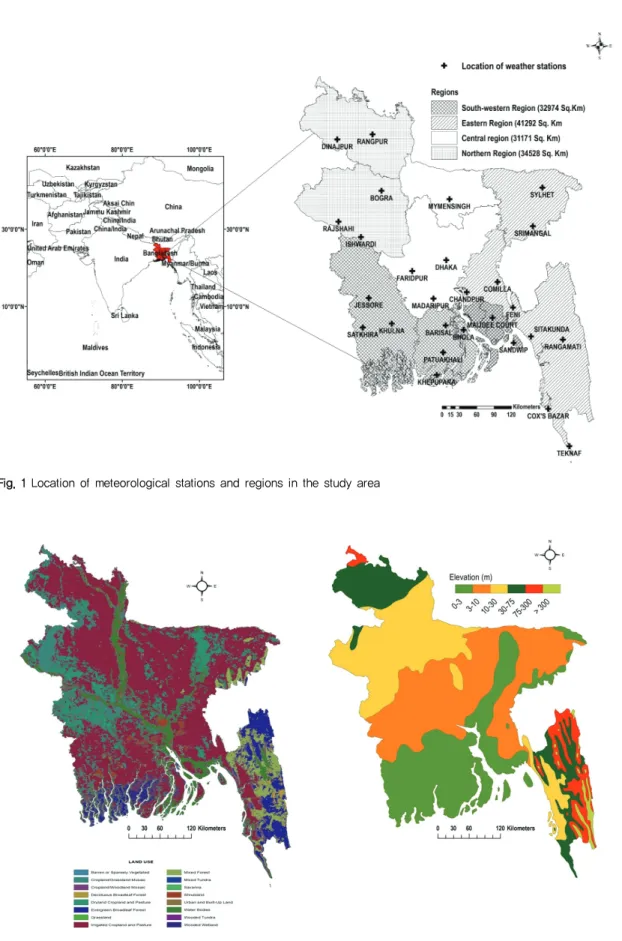
with a long coastline (Figure 1). Bangladesh has a tropical
Fig. 1 Location of meteorological stations and regions in the study area
Fig. 2 Land use map (left side) and elevation map (Right side) of Bangladesh (Data source: https://www.catalog.data.gov, https://www.geonode.wfp.org)
monsoon climate characterized by wide seasonal variations in rainfall, high temperatures, and high humidity. Altitudes of up to 105 meters above sea level occur in the northern part of the plain, but most elevations are less than 10 meters above sea level; heights decrease in the coastal south (Wikipedia, Geography of Bangladesh). There are three distinct seasons in Bangladesh: a hot, humid summer from March to June; a cool, rainy monsoon season from June to October; and a cool, dry winter from October to March. The mean annual temperature is about 25°C within the country. The mean monthly temperature ranges between 18°C in January and 30°C from April to May. In general, maximum summer temperatures range between 30℃ and 40℃. April is the warmest month in most parts of the country (BBS, 2015). In the present study, 27 metrological stations of the Bangladesh Meteorological Department (BMD) were selected on the basis of the data for the study period of 1981-2015. There are four different vegetation areas in Bangladesh. The eastern region which is consisted of Sylhet and Chittagong division with low hills covered by jungles. The central region which covers Dhaka division and supports swampy vegetation. The northern region which is consisted by Rangpur and Rajshahi division with mostly of cultivated plants and orchards whereas the southern zone which is included by Khulna and Barisal division along the Bay of Bengal contains wetlands with mangrove vegetation.
To analyses the drought condition of an entire country, BMD stations are divided into four sub-regions as shown in Figure1, based on the topography, land use and rainfall anomalies, named: (i) northern, (ii) south-western, (iii) central, and (iv) eastern region.
2. Data
Daily data of average rainfall over Bangladesh have been collected for a maximum period of 68 years, 1948-2015. Time series of 27 meteorological stations for the period of 1981 to 2015 were used to diagnose the droughts. The mean monthly and annual rainfall of all selected stations over Bangladesh are presented in Table 1. The average annual rainfall varies from 1491mm to 4187 mm in different stations whereas average annual national rainfall was 2427.6 mm from 1980 to 2015.
Approximately 60% of the annual rainfall is received during the monsoon months (July to October). The history of drought in Bangladesh is poorly documented. However, historical
drought records of Bangladesh obtained from different sources are also used for this study (Table 2). Fourteen drought drought-years were recorded during the study period. It is found that annual rainfall of the recorded drought-years were less than average yearly national rainfall during the study period (1980-2015) with a rage of 0.8 to 23% except for the drought-year of 1995, 2011 and 2015, where annual rainfall was found higher than average yearly national rainfall with a rage of 0.35 to 14.50 %; it may be happened due to the spatial and temporal distribution pattern of rainfall.
From 1949 and 1991, droughts occurred in Bangladesh 24 times, while very severe droughts have occurred in the years of 1951, 1957, 1958, 1961, 1972, 1975, 1981, 1982 and 1989.
Previous droughts have affected about 47% of the country and 53% of the population (WARPO, 2005, Banglapedia, 2012).
Bangladesh also experienced droughts of high magnitude in the years of 1973, 1978, 1979, 1981, 1982, 1989, 1992, 1994, and 1995 after independence (Banglapedia, 2012, Habiba, 2012).
The droughts of 1973, 1979, and 1994-1995 were the most awful in recent history (Rahman, 1995), leading to a net loss of 377,000 tons of Aman rice during the 1995 drought (Ahmed 2006). The average crop production reduced 25-30 % due to the effect of drought in the north-western part of Bangladesh during 2006 (Rahman et al., 2008). According to the BBS (2015), USD 22521.60 million equivalent of agricultural products and houses were damaged and losses by different types of natural disaster; among them 5.74 % damage and losses were caused by drought from 2009 to 2014 which is accounting USD 126.33 million.
Ⅲ. Methodology
The Effective Drought Index (EDI) and Standardized Precipitation Index (SPI) are used in this Study. Both indices were using only precipitation data for calculating drought.
However, EDI used daily precipitation data whereas SPI used average monthly time series. A brief description of both indices is given below:
1. Standardized Precipitation Index (SPI)
McKee et al. (1993) developed the Standardized Precipitation
Index (SPI) to identify and monitor drought events using
Name of
the Station Region Data period
Geographical
Location Mean monthly rainfall of various stations(mm) during 1980-2015 Annual Lon. Lat. Jan Feb Mar Apr May Jun Jul Aug Sep Oct Nov Dec (mm)
Rangpur
Northern Region
1954 to date 89.23 25.73 9 12 24 112 278 449 445 360 381 168 9 12 2259
Dinajpur 1948 to date 88.68 25.65 10 11 13 67 205 357 411 350 346 151 7 7 1935
Bogra 1948 to date 89.37 24.85 8 14 18 78 206 322 349 289 293 147 10 8 1742
Rajshahi 1964to date 88.7 24.37 8 14 24 59 142 242 301 253 261 113 13 8 1438
Ishwardi 1961 to date 89.05 24.13 6 19 31 73 174 247 296 231 277 113 16 8 1491
Jessore
South- Western
Region
1948 to date 89.17 23.18 13 26 42 68 182 307 341 273 269 130 27 10 1688
Khulna 1948 to date 89.53 22.78 14 32 49 72 183 330 343 321 287 147 34 5 1817
Shatkhira 1948 to date 89.08 22.72 14 32 41 81 157 291 339 299 290 139 30 6 1719
Barishal 1949 to date 90.37 22.75 10 23 49 101 213 394 424 348 288 181 42 5 2078
Patuakhali 1973 to date 90.33 22.33 8 21 39 102 230 514 577 447 366 209 42 4 2559
Khepupara 1974 to date 90.23 21.98 9 23 42 81 261 481 642 485 398 269 53 8 2752
Bhola 1966 to date 90.65 22.68 7 26 48 108 259 452 485 377 300 185 36 5 2288 Maizdi
Court 1951 to date 91.1 22.87 9 23 67 137 343 572 734 596 398 208 39 6 3132 Sandwip 1966 to date 91.43 22.48 9 21 61 129 362 668 883 625 447 265 44 7 3521
Dhaka
Central Region
1953 to date 90.38 23.77 7 20 57 140 281 340 381 306 318 169 27 11 2057
Mymensingh 1948 to date 90.43 24.72 7 19 36 138 326 393 447 360 317 196 16 8 2263
Faridpur 1948 to date 89.85 23.6 7 26 45 113 229 318 331 297 251 155 32 11 1815
Madaripur 1977 to date 90.18 23.17 7 22 49 112 241 358 387 321 266 154 31 4 1952
Chandpur
Eastern Region
1964 to date 90.7 23.27 5 20 56 138 274 373 417 354 280 160 34 6 2117
Comilla 1964 to date 91.18 23.43 7 19 60 135 319 357 404 310 255 154 31 9 2060
Feni 1973 to date 91.42 23.03 5 24 59 154 365 522 675 511 354 213 39 8 2929
Sylhet 1956 to date 91.88 24.9 6 33 129 380 591 767 755 628 541 207 27 11 4075
Srimangal 1948 to date 91.73 24.3 5 27 80 198 433 392 331 330 269 163 30 11 2269
Shitakunda 1977 to date 91.7 22.58 4 17 66 151 337 573 732 583 395 257 45 6 3166
Rangamati 1957 to date 92.2 22.53 5 21 62 129 337 484 552 431 302 178 47 11 2559 Cox’es
Bazar 1948 to date 91.97 21.45 5 18 31 93 326 860 942 698 393 220 78 14 3678 Teknaf 1977 to date 92.3 20.87 3 12 14 52 284 1009 1105 914 453 257 71 13 4187
Mean
± STDV
7.7
± 2.8
21.3
± 5.9
47.9
± 23.5
118.6
± 62.7
279.2
± 95.6
458.2
± 186.0
519.6
± 217.5
418.4
± 162.4
333.1
± 72.6
181.8
± 44.4
33.7
± 16.9
8.2
± 2.7
2427.6
± 764.2 Table 1 Mean monthly, annual rainfall of various stations in Bangladesh
monthly rainfall data for the desired period. The available long-term rainfall data is fitted to the gamma probability distribution, which is then transformed to a normal distribution so that the mean SPI for the location and the desired period is zero. It is intended to identify drought periods as well as the severity of droughts, at multiple time steps, such as at 1, 3, 6, 9, 12 or 24-months. However, the actual choice of the best time step may depend on the purpose of drought analysis.
Positive SPI values indicate greater than mean precipitation, and negative values indicate less than mean rainfall. The SPI may be used for monitoring both dry and wet conditions. A drought event starts when SPI value reaches −1.0 and ends when SPI becomes positive again. The positive sum of the SPI for all the months within a drought event is referred to as ‘drought magnitude’. The continuous long-term data of at least 30 years is required to compute SPI; it does not allow missing data. The complete procedure for estimation of SPI is available in Edwards and Mckee (1997).
SPI is calculated based on the following equation
(1)
Where Xi is monthly rainfall records of the station Xm is rainfall mean and is the standard deviation
2. Effective Drought Index (EDI)
The Effective Drought Index (EDI) was proposed by Byun and Wilhite (1999) to detect a drought: the exact start and end of the drought period and its duration as well as severity of droughts. They used a new concept of effective precipitation (EP). They defined effective precipitation (EP) as a function of current day’s rainfall and weighted rainfall over a defined preceding period (n) computed using a time depended reduction function.
(2)
(3)
(4)
Step 1: Water resources due to precipitation accumulated for more than a year in consideration of loss over time Eq. (2).
Effective precipitation (EP) implies the daily cumulative precipitation, and Pm indicates the precipitation prior to m days before a specific day; i denotes the duration in which the precipitation amount is summed, beginning with at least 365
Droughtyear
Average annual precipitation (mm)
Affected region References Long /Short
term
1981 2406.9 Throughout the country Banglapedia (2012) Short term
1982 2399.7 Throughout the country Banglapedia (2012) Short term
1989 2143.2 Northern, Southwestern, and Central Banglapedia (2012) Short term
1992 1846.0 Throughout the country Habiba et al (2012) Short term
1994 2027.0 Northern, Southwestern, and Central Banglapedia (2012) Long-term 1995 2436.3 Northern, Southwestern, and Central Banglapedia (2012) Long-term 2006 2166.5 Northern, Southwestern, and Central Climate Change Cell (2008) Short term
2009 2218.4 Northern, Southwestern, and Central BBS(2015) Short term
2010 2198.6 Northern, Southwestern, and Central BBS(2015) Short term
2011 2489.0 Northern, Southwestern, and Central BBS(2015) Short term
2012 2267.9 Northern, Southwestern, and Central BBS(2015) Short term
2013 2315.2 Northern, Southwestern, and Central BBS(2015) Short term
2014 2030.7 Northern, Southwestern, and Central BBS(2015) Short term
2015 2779.1 Northern, Southwestern, and Central Personal communication with BMD staff (2017)
Short term Table 2 Historical record of major drought year in Bangladesh during 1981-2015
days. Because of this, the actual drought index is calculated 365 days after the start date of precipitation observations.
Step 2: The deviation of EP (DEP) is calculated from the climatological mean of EP (MEP) by using Eq. (3). If the DEP is consecutively negative, i in Eq. (1) increases as much as to be consecutive days. For example, if two days are consecutive, i is 367, and the EP is calculated again from Step 1.
Step 3: The DEP is standardized Eq. (4). Std(DEP) denotes the standard deviation of each day’s EP. More details on the rather complicated calculation procedure of the EDI are available from Byun and Wilhite (1999).
Originally, EDI was developed to monitor drought conditions on daily time steps (Lee et al., 2012; Akhtari et al., 2009; Kim and Byun, 2009; Kim et al., 2009; Morid et al. 2006).
Subsequently, it was extended for monthly drought monitoring (Jain et al., 2015; Pandey et al., 2008; Morid et al., 2007).
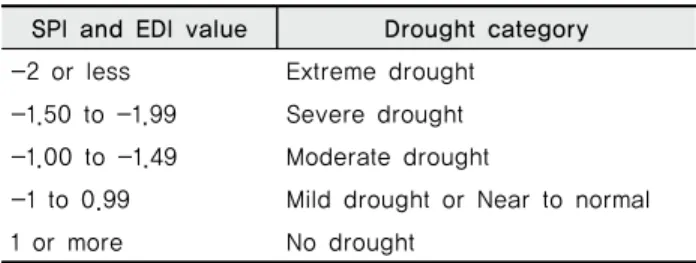
Monthly EDI is based on the concept of effective precipitation (EP) that is calculated by a time-dependent reduction function on monthly precipitation. For calculation of monthly EDI, the time step is defined by the unit of time (monthly), the rainfall for the current month is given more is given more weight and the weights are decreasing order are given to each preceding month’s rainfall values. In this study, daily EDI was used for all comparison study except to compare the spatial distribution of drought pattern, used monthly EDI. EDI always use time reduction function which helps to detect the actual onset and end of the drought. The EDI and SPI use similar classification of drought severity as shown in Table 3.
SPI and EDI value Drought category -2 or less Extreme drought
-1.50 to -1.99 Severe drought -1.00 to -1.49 Moderate drought
-1 to 0.99 Mild drought or Near to normal
1 or more No drought
Table 3 Classification value of EDI and SPI (Kim. 2009, McKee, 1993)
3. Comparison of SPI and EDI
In Bangladesh, most of the drought occurred in pre-monsoon (March-May) and post-monsoon (October to November) seasons, but in some extreme cases, the pre-monsoon droughts had extended into the monsoon season due to the delay of the monsoon rain. In Bangladesh, 14 historical drought years were
recorded during the study period of 1981-2015 as shown in Table 2. The historical drought years were used to verify the EDI and SPI (SPI1, SPI3, SPI6, SPI9, and SPI12) results.
Drought is a recurrent phenomenon in some parts of the country, but the north-west region, especially Rajshahi, Dinajpur and Ishwardi stations and its surrounding areas, are the most drought-prone because of high rainfall variability (Shahid and Behrawan, 2008). In recent times, the most persistent and long duration drought event was experienced between 1994 and 1995 in the north-western region of Bangladesh especially in the surrounding area of Rajshahi, Ishwardi and Dinajpur stations (Banglapedia, 2012). This drought events started in October 1994 and was broken in July 1995 with the onset of monsoon rain (Rahman 1995). Furthermore, short duration drought occurred in 2006 resulting in a reduction of T. Aman crop production (Cropping season: July-October) of about 25-30%
in the northwestern part of Bangladesh (Rahman et al.2008).
These two historical drought events in the particular regions of Ishwardi and Dinajpur stations were selected for critically analyzed in this study as an example.
The Geographic Information System (GIS) has been used for the mapping drought index. The Inverse Distance Weighted (IDW) method was considered in the study to interpolate the EDI and SPIs station based results across Bangladesh. The historical drought events in April 1995 and September 2006 were considered in this study to compare the spatial distribution of drought pattern of EDI and SPI values.
Ⅳ. Results and Discussions
1. EDI and SPI Results Confirmed by the Historical Recorded Drought Years
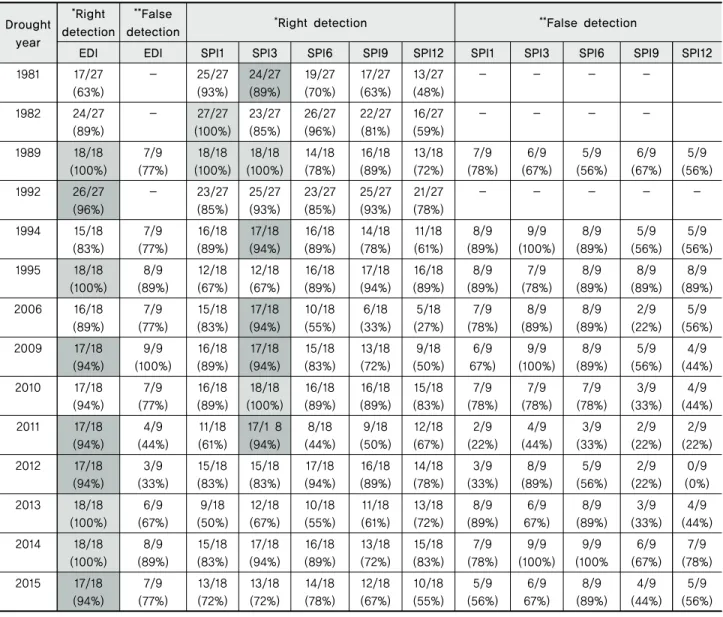
The meteorological drought was analyzed using the EDI and different time-steps of SPI during 1981-2015 over Bangladesh and compared with the historical drought record during the study period. The historical drought-affected years are detected by the EDI and SPIs in the different meteorological stations’
area in Bangladesh as shown in Table 4. It can be seen that historical drought-affected years are detected by EDI and SPIs results varied significantly. EDI values than SPIs better-detected maximum recorded drought years.
In particular, the EDI results identified historical drought
years by more stations than the SPI, excluding the specific
drought years of 1981, 1982, 1994, 2006 and 2010. EDI indices identified the drought years of 1989, 1995, 2013 and 2014 by 100% stations; however, the lowest number was found in the year 1981 (63%). Further, in 100% of stations the drought years of 1982 and 1989 were detected by SPI1, and 1989 and 2010 by SPI3, while only 27% of stations detected the drought year of 2006 by SPI12. Additionally, it also indicated that SPI3 indices results identified the historical drought years by more stations than other SPIs. Therefore, it can be said that the drought year obtained from EDI analysis matches better than the SPI results with the historical records of events.
2. Evaluation of the EDI & SPI3 Indices for Detecting Drought
In this study, EDI and SPI3 results were evaluated compared with the historical drought records. Drought events are categorized based on the EDI and SPI values as shown in Table 3. According to the document, Bangladesh faced severe to extreme drought situations in the historical drought years during the study period in the different regions as shown in Table 2.
Figure 2 shows that the EDI and SPI3 indices detect historically recorded drought. The comparison has been made based on the recorded drought detection by the number of stations. It was
Droughtyear
*Right detection
**False
detection *Right detection **False detection
EDI EDI SPI1 SPI3 SPI6 SPI9 SPI12 SPI1 SPI3 SPI6 SPI9 SPI12
1981 17/27 (63%)
- 25/27
(93%)
24/27 (89%)
19/27 (70%)
17/27 (63%)
13/27 (48%)
- - - -
1982 24/27 (89%)
- 27/27
(100%) 23/27 (85%)
26/27 (96%)
22/27 (81%)
16/27 (59%)
- - - -
1989 18/18 (100%)
7/9 (77%)
18/18 (100%)
18/18 (100%)
14/18 (78%)
16/18 (89%)
13/18 (72%)
7/9 (78%)
6/9 (67%)
5/9 (56%)
6/9 (67%)
5/9 (56%) 1992 26/27
(96%)
- 23/27
(85%)
25/27 (93%)
23/27 (85%)
25/27 (93%)
21/27 (78%)
- - - - -
1994 15/18 (83%)
7/9 (77%)
16/18 (89%)
17/18 (94%)
16/18 (89%)
14/18 (78%)
11/18 (61%)
8/9 (89%)
9/9 (100%)
8/9 (89%)
5/9 (56%)
5/9 (56%) 1995 18/18
(100%)
8/9 (89%)
12/18 (67%)
12/18 (67%)
16/18 (89%)
17/18 (94%)
16/18 (89%)
8/9 (89%)
7/9 (78%)
8/9 (89%)
8/9 (89%)
8/9 (89%) 2006 16/18
(89%)
7/9 (77%)
15/18 (83%)
17/18 (94%)
10/18 (55%)
6/18 (33%)
5/18 (27%)
7/9 (78%)
8/9 (89%)
8/9 (89%)
2/9 (22%)
5/9 (56%) 2009 17/18
(94%)
9/9 (100%)
16/18 (89%)
17/18 (94%)
15/18 (83%)
13/18 (72%)
9/18 (50%)
6/9 67%)
9/9 (100%)
8/9 (89%)
5/9 (56%)
4/9 (44%) 2010 17/18
(94%)
7/9 (77%)
16/18 (89%)
18/18 (100%)
16/18 (89%)
16/18 (89%)
15/18 (83%)
7/9 (78%)
7/9 (78%)
7/9 (78%)
3/9 (33%)
4/9 (44%) 2011 17/18
(94%)
4/9 (44%)
11/18 (61%)
17/1 8 (94%)
8/18 (44%)
9/18 (50%)
12/18 (67%)
2/9 (22%)
4/9 (44%)
3/9 (33%)
2/9 (22%)
2/9 (22%) 2012 17/18
(94%)
3/9 (33%)
15/18 (83%)
15/18 (83%)
17/18 (94%)
16/18 (89%)
14/18 (78%)
3/9 (33%)
8/9 (89%)
5/9 (56%)
2/9 (22%)
0/9 (0%) 2013 18/18
(100%)
6/9 (67%)
9/18 (50%)
12/18 (67%)
10/18 (55%)
11/18 (61%)
13/18 (72%)
8/9 (89%)
6/9 67%)
8/9 (89%)
3/9 (33%)
4/9 (44%) 2014 18/18
(100%)
8/9 (89%)
15/18 (83%)
17/18 (94%)
16/18 (89%)
13/18 (72%)
15/18 (83%)
7/9 (78%)
9/9 (100%)
9/9 (100%
6/9 (67%)
7/9 (78%) 2015 17/18
(94%)
7/9 (77%)
13/18 (72%)
13/18 (72%)
14/18 (78%)
12/18 (67%)
10/18 (55%)
5/9 (56%)
6/9 67%)
8/9 (89%)
4/9 (44%)
5/9 (56%) Percentage of stations number in parenthesis
* ‘Right detection’ designates the EDI or SPIs identified the documented drought-affected area
** ‘False detection’ designates the EDI or SPIs identified the documented drought-free area Table 4 Historical drought events detected by the EDI and SPI in Bangladesh (1981-2015)
found that the drought year recognized by EDI, and SPI3 results whose were confirmed by historical drought record varies significantly.
According to the Figures 2(a), it was found that EDI results identified the extreme drought by higher number of stations than SPI3 in the year of 1992, 1995, 2010, 2012-2015 in accounting 7, 13, 10,8,11 and 4 number of stations, respectively, whereas SPI3 identified the extreme drought by higher number of stations than EDI in the year of 1982, 1989, 2006 and 2011 in accounting 7, 6, 2, and 6 number of stations, respectively.
However, both EDI and SPI3 has detected the drought years of 1981, 1994 and 2009 by the same number of stations in extreme drought case.
In the same way, EDI results identified the severe drought by higher number of stations than SPI3 in the year of 1982, 1989, 1992, 2009, 2011, 2013 and 2015 in accounting 14, 13, 11, 11, 8, 4 and 6 number of stations, respectively whereas SPI3 identified the severe drought by higher number of stations than EDI in the year of 1981, 1994, 1995, 2006 and 2010 in accounting 1, 10, 4, 11, 9, and 6 number of stations, respectively. However, both EDI and SPI3 has detected the drought years of 2012 and 2014 by the same number of stations in severe drought case Figure 2(b). It is seen that EDI can detect the number recorded drought years by more number of stations in compare to SPI3 in both extreme and severe drought cases.
The above discussion illustrates that the drought-affected years obtained from EDI analysis is harmonized better than SPI3 results with the historical records of events.
3. Comparative Investigation of EDI with the SPI a. Long-term drought
The northern, south-western and central region experienced a long-lasting drought event during the consecutive year of 1994-1995 according to the record as shown in Table 2.
Notably, the northern region including Ishwardi station area was severely affected by the 1994-1995 drought. In this study, Ishwardi station was considered as a representative of the drought-prone area. Therefore, only the result obtained at Ishwardi station was shown in Figure 3 for further discussion in this section. The average annual rainfall in Ishwardi station was recorded as 1183 mm during 1994-1995, which was 51%
less than the mean value of yearly national rainfall during the study period 1981-2015.
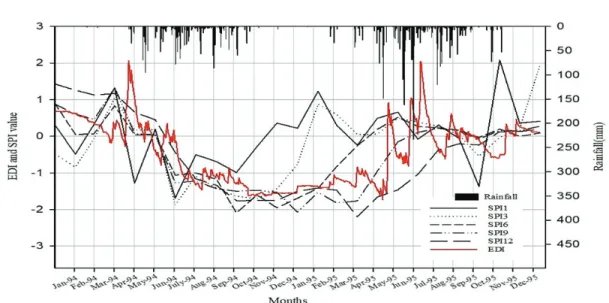
Figure 3 shows a comparison of the EDI with the SPIs (SPI-1, SPI-3, SPI-6, SPI-9, and SPI-12) over the same period.
According to Figure 3, it was found that EDI values went below -1 on 26 July 1994 and negative values continued for more than one year until 12 August 1995. While the drought continued, SPI1, SPI3, and SPI6 indicated several times that the drought was relieved. However, SPI9 and SPI12 identified the drought.
The drought durations identified by SPI9 and SPI12 were almost the same as the EDI, but magnitudes were different. The same situation has prevailed in other stations. This example clarifies that the short-term SPIs cannot detect the development of long-term droughts. Byun and Kim (2010) also proved that the EDI identifies long-term droughts that cannot be detected by the short-term SPIs, which ensures the validation of the present study.
Fig. 2 Historical recorded drought years detected by EDI and SPI3 indices in different stations area: (a) extreme drought, (b) severe drought
Fig. 3 Observed EDI and SPIs values for Ishwardi station in 1994-1995
Fig. 4 Spatial pattern of long-term drought detected by EDI and SPIs over Bangladesh in the month of April 1995: (a) EDI for April 1995, (b) SPI1, (c) SPI3, (d) SPI6, (e) SPI(9), and (f) SPI12 for the same month
Further, Figure 3 revealed that the SPI1 line frequently fluctuated. The rainfall was zero in January 1995, so theoretically, SPI1 should have produced drought in February, but it showed upward movement. So, it can be said that 1-month time steps produced erroneous drought durations. The statement agreed with the study result of Jain et al. (2015).
The performance of EDI and SPIs were evaluated for detecting long-term drought over Bangladesh during 1994-1995 through spatial analysis. The EDI and SPIs maps were drawn for the drought period of 1994-1995 to visualize the results better. Figure 4 shows the example drought maps for April 1995. It was found that overall historical droughts were well detected by the EDI and long-term SPIs (SPI9 and SPI 12).
But they were not detected by short-term SPIs (SPI1, SPI3, and SPI6). In particular, the significant portions of the drought-affected areas of north-western regions were not detected by SPI9 and SPI12 while the regions suffer from the severe drought.
b. Short-term drought
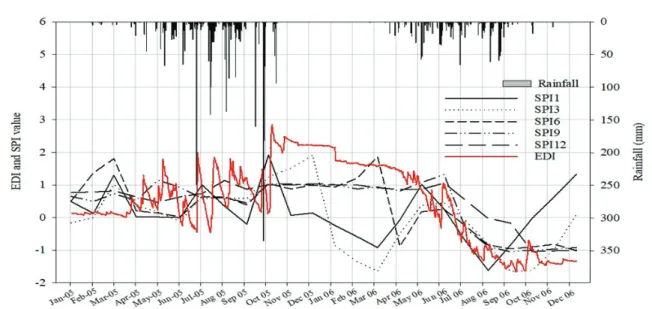
The northern, south-western and central region experienced a short-term drought event during 2006 according to the record as shown in Table 2. The North-western region, including the Dinajpur station area, experienced short-term drought during the T-Aman season (July-October) of 2006 (Rahman et al 2008).
In this study, Dinajpur station was considered as a representative
of the drought-prone area. Therefore, only the result obtained at Dinajpur station was shown in Figure 5 for further discussion in this section.
Figure 5 shows that the EDI values went below -1 on 9 July 2006 and negative values continued more than one month until 23 September 2006. Within the season EDI values again went below -1 on 2 October and continued into the next year. This short-term drought was detected by the EDI and short-term SPIs (SPI1 and SPI3), but was not detected by the long-term SPIs (SPI6, SPI9, and SPI12). The same situation prevailed in other stations. Byun and Kim (2010) also proved that the EDI detects short-term droughts that cannot be detected by the long-time step SPIs, which ensuring the confirmation of the present study.
In February 2006, SPI6 was greater than zero, indicating wetness, but early in March 2006, the SPI 6 value abruptly dropped to<-1, indicating drought. The reason for this phenomenon was that the 700 mm precipitation received in early October 2005 was only considered in calculations up to early March 2006 but not in early April 2006. Drought calculation in early April 2006 took into consideration the precipitation of November 2005 which was zero. It is the clear disadvantage of SPI calculation procedures in which the same weight was applied to long-past and recent-past precipitation.
However, the EDI value accurately reflects the fact that
droughts gradually become more severe as precipitation
shortages continue. It’s considered more effective where
Fig. 5 Observed EDI and SPIs values for Dinajpur Station in 2006precipitation is summed on a daily basis, applying a higher weight to recent-past and a lower weight to long-past precipitation.
The performance of EDI and SPIs were evaluated for detecting short-term drought over Bangladesh during 2006 through spatial analysis. To visualize the results better, the EDI and SPIs maps were drawn for the drought year of 2006. Figure 6 shows the example drought maps for September 2006. It was found that EDI and SPI3 well detected overall historical
drought. But it was not detected by long-term SPIs (SPI6, SPI9, and SPI12). Theoretically, SPI1 should have produced drought, but sometimes it delivered erroneous drought situation as we discussed before.
Ⅴ. Conclusion
This paper presents a study to examine the applicability and performance evaluation of the two DIs (SPI and EDI) for
Fig. 6 Spatial pattern of short-term drought detected by EDI and SPIs over Bangladesh in the month of September 2006: (a) EDIfor September 2006, (b) SPI1, (c) SPI3, (d) SPI6, (e) SPI(9), and (f) SPI12 for the same month