A Study on the Evaluation of EDZ in Underground Gangway using a Seismic
Exploration Method
Byung-Hee Choi, Joong-Ho Synn (Korea Institute of Geosciecnce & Mineral Resources) Ju-Hwan Jeong, Hyung-Sik Yang (Chonnam National University) Churl-Hyun Jo (Subsurface Information Tech., Inc.)
1. INTRODUCTION
Rock excavation using blasting is an excellent method in an economic aspect, but it has a feature to make more damages around gangway due to impact wave from blasting compared to other mechanical excavation methods. Since the excavation damaged zone (EDZ) may not only impose an additional cost for constructing underground structures such as gangways, tunnels, underground storages, and radioactive waste disposal sites, but also play a role of passage for stored materials or nuclear substances, it is important to develop a method that can correctly evaluate it in an underground structure.
Many research projects on the evaluation of EDZ at underground radioactive waste disposal sites have been conducted in those countries of Sweden (Malmgren et al., 2007), Canada (Carlson and Young, 1995), Japan (Sugihara et al., 1993; Sato et al., 2000), and so on. On the contrary, there are few studies on EDZ in Korea, and those that use a seismic exploration method are unusual.
In this study, the SHT (side-hole test) method that analyze the P and S wave velocities are developed for the evaluation of an EDZ, and are applied in an underground gangway in an iron mine located in Jeongseon. To compare with the SHT method, the cross-hole test was applied during the investigation.
2. Experiment Method
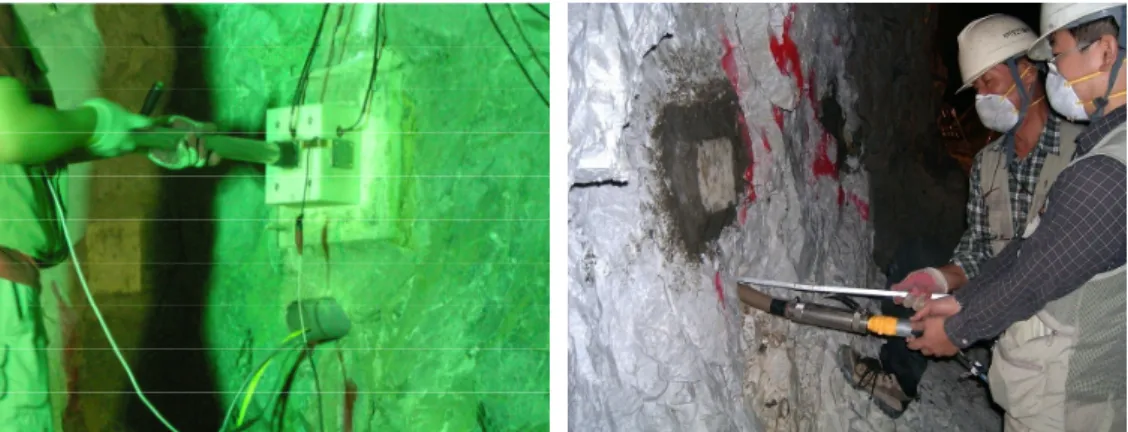
2.1 SHT MethodThe SHT method is a method to analyze the velocities of P and S waves by installing receivers inside a borehole drilled on the side wall of a gangway. The sources are made by hitting the plates fixed on the wall (see Figs. 1 and 2). Specifically, S waves are generated by hitting a plate in opposite directions, and their phase inversions are detected in receiver geophones.
한국암반공학회 국제학술회의
2008 / 2008.10.21 - 10.23
2.2 Cross-hole Method
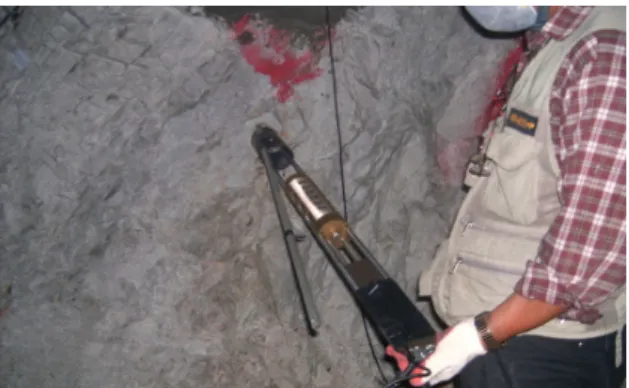
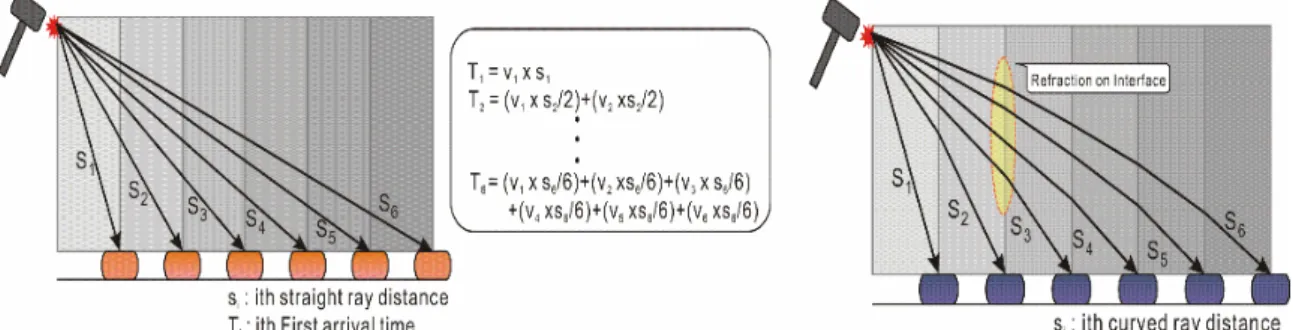
In the cross-hole test, two boreholes are used for each measurement (Fig. 3). By fixing the source and receiver at the same depth in each borehole, the wave propagation velocities through the rock between the holes are measured (Malmgren et al., 2007). In this case, S waves are generated by hitting the two opposite sides of the hammer (Fig. 4) in the borehole, and their phase inversions are detected in receivers on the side wall.
Fig. 1 Schematic diagram of SHT method.
Fig. 2 Source and geophone in SHT.
Fig. 3 Schematic diagram of Cross-Hole method.
Fig. 4 Source of Cross-Hole method.
3. First Arrival Picking and Velocity Analysis
3.1 First Arrival PickingSince seismic velocity is calculated by the travel-time and propagation distance of the wave, it is important to correctly measure the first arrival time. The first arrival time of P wave is numerically using the cross-correlation method in this study. Fig. 5 illustrates the Cross-Correlation method, where ΔT is the delay time of the wave and dt is the sampling interval. The first arrival time is determined at the time that shows the largest correlation value while the waveform of CH2 is continuously moved along the time axis by step of dt.
Additionally, the first arrival time of S wave is determined at the time that corresponds to the inverted phase point of the wave.
Fig. 5 Cross-Correlation method.
3.2 Calculation of P and S wave Velocities
The velocity of seismic wave should be calculated using the relation between the travel length and the first arrival time of the wave. The direction of the ray of the seismic wave is assumed to be a straight line from the source to the sensor, and the velocity of each layer through which the wave passed is calculated by equation (1).
∑
−=
−
=
11
/ ) / ( )
/
(
Nk
k N
N N
n
s N T s N v
v
(1)v
N : Velocity of the N th layers
N : Travel length of the wave to the Nth layerT
N : First arrival time of the ray to the Nth layerIn addition, since a seismic wave is accompanied with refraction at each boundary surface according to the Snell's law, actual ray may have a curved travel path. Consequently, it is required to get the travel time residual through regular modeling method after dividing velocity layer into N cells and draw the velocity model closest to the first arrival time with inverse modeling (Fig. 6).
Fig. 6 Ray path pattern (straight ray and curved ray)
4. Results of Data Analysis
4.1 SHT- Analysis of P wave velocity
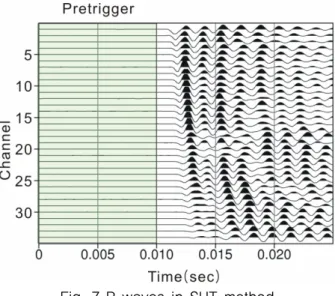
Fig. 7 illustrates P waves for SHT by depth, where the first arrival time of the waves are comparatively clear.
Fig. 7 P waves in SHT method
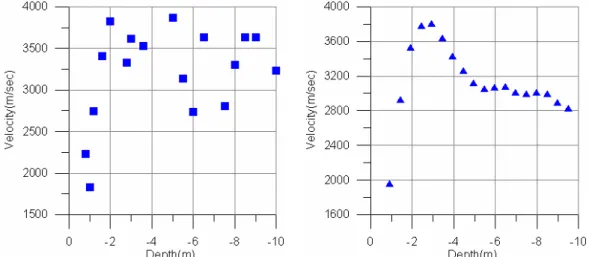
Fig. 8 shows the relation between the velocities and the depth assuming the straight ray path from source to receiver. On the contrary, Fig. 9 shows velocities through the inverse modeling by assuming the ray path according to the Snell's law. From the figures, the EDZ by the blasting is up to 2~3m. The velocity gradient becomes smaller beyond the EDZ.
Fig. 8 P wave velocity assuming straight ray path. Fig. 9 P wave velocity assuming curved ray path.
- Analysis of S wave velocity
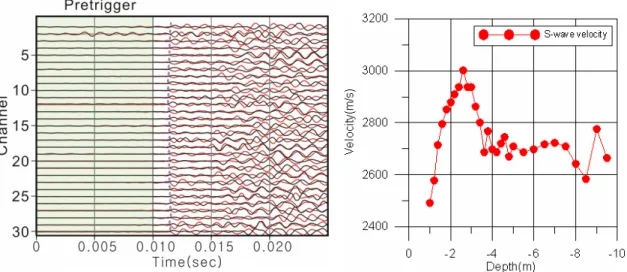
S wave velocity was calculated from the point with inversed phase of trace by shear wave from the transmitter (Fig. 10). Fig. 11 shows the velocity vs. depth plot by assuming that rays from the transmitter to the geophone are straight, while Fig. 12 indicates the velocity through the inverse modeling by assuming the ray path according to the Snell's law, where it is expected that EDZ from blasting is around 2~2.5 m in depth as there is an increase of velocity to the depth of around 2.5m and a decrease of velocity beyond the depth. We can see that it shows clearer change of velocity compared
to that of the inverse modeling of P wave.
Fig. 10 S wave received by SHT method.
Fig. 11 S wave velocity assumed straight ray. Fig. 12 S wave velocity assumed curved ray.
4.2 Cross-hole Method
The receiver using triaxial geophone was installed in the borehole and the seismic wave was generated by impact with hydraulic equipment attached in another bore-hole while moving the source down the hole. Fig. 13 shows the trace obtained for each depth, the point of phase inversion was used to calculate the S wave velocity. Fig. 14 shows shear wave velocity at each measuring point of borehole.
Increasing rate of the velocity in the region of up to 2.5 m is much higher. This result shows that there is a severe fractured zone beyond 2.5 m from the surface. This result is similar to that of S wave velocity in SHT.
Fig. 13 S wave received by Cross-Hole method. Fig. 14 S wave velocity (Cross-Hole method).
5. Conclusion
This study is intended to evaluate the EDZ due to blasting by using seismic wave velocity measurement methods on an iron mine in Jeongseon. Specifically, a method using S wave as well as the existing methods using P wave and the Cross-hole method was also used with the proposed SHT method for comparison.
Important results obtained from each method are summarized as follows:
- SHT Method
There is an increase of wave velocity as the depth increases. The results of the wave velocity measurement indicate that the extent of EDZ approximately equals to 2~3m. The change of S wave velocity is clearer compared to that of the inverse modeling of P wave.
This method may have a problem that the velocity of P wave is too large compared to the narrow region of less than 10 m. However, the method may be justified because it uses only the trend of the velocity change to evaluate the EDZ.
- Cross-hole Method
The results of the wave velocity measurement indicate that the extent of EDZ is approximately 2.5m.
The velocity pattern beyond the depth was appeared to be the same as that of the S wave velocity in SHT method.
ACKNOWLEDGEMENTS
This research was supported by a grant from the Basic Research Project of KIGAM funded by Ministry of Knowledge Economy of Korean government.
REFERENCE
1. Carlson S. R. and R. P. Young, 1993, Acoustic emission and ultrasonic velocity study of excavation- induced microcrack damage at the underground research laboratory, Int. J. of Rock Mechanics &
Mining Sciences, vol.30, p.901-907.
2. Malmgren, L., D. Saiang, J. Töyrä and A. Bodare, 2007, The excavation disturbed zone (EDZ) at Kiirunavaara mine, Sweden-by seismic measurements, J. of Applied Geophysics 61, p.1-15
3. Meglis, I. L., T. Chow, C. D. Martin and R. P. Young, 2005, Assessing in situ damage using ultrasonic velocity tomography, Int. J. of Rock Mechanics & Mining Sciences, vol.42, p.25-24.
4. Sato, T., T. Kikuchi and K. Sugihara, 2000, In-situ experiments on an excavation disturbed zone induced by mechanical excavation in Neogene sedimentary rock at Tono mine, central Japan, Eng.
Geol. 56, p.97-108
5. Sugihara, K., H. Yoshioka, H. Matsui and T. Sato, 1993, Preliminary results of a study on the responses of sedimentary rocks to shaft excavation. Eng. Geol. 35, p.223-228.