․교신저자: 우홍정 서울시 동대문구 회기동 1번지 경희의료원 한방병원 간계내과학교실 TEL: 02-958-9118 FAX: 02-958-9120 E-mail: [email protected]
茵蔯의 에탄올 추출물이 담도암 세포주 SNU-1196의 apoptosis에 미치는 효과에 관한 연구
이경욱, 우홍정
경희대학교 한의과대학 간계내과학교실
Study on the Pro-apoptotic Effect of Artemisiae Capillaris Herba Extracted with Ethanol on Biliary Tract Cancer Cell Line, SNU-1196
Kyung-wook Lee, Hong-jung Woo
Dept. of Internal Medicine, College of Korean Medicine, Kyung-Hee University ABSTRACT
Objectives :
This study was performed to elucidate the pro-apoptotic effect of Artemisiae capillaris herba extracted with ethanol on biliary tract cancer cells.
Materials and Methods :
The biliary tract cancer cell line SNU-1196 was used in this study. Cells were treated with different concentrations of Artemisiae capillaris herba for 24, 48 and 72 hours. After the treatment, cell viability, apoptosis, caspase activities and the mRNA expressions of the Bcl-2, Bax, P53, and P21 were measured by using MTT assay, cell cycle analysis, apoptosis assay, and RT-PCR. The cell cycle analysis was done by flow cytometry and apoptosis assay by cell death detection ELISA kit.
Results :
Artemisiae capillaris herba inhibited proliferation of SNU-1196 in long-time culture group with dose-dependent manner. All cells treated with Artemisiae capillaris herba showed increased apoptosis with dose- and time-dependent manner.
Exposure of SNU-1196 to Artemisiae capillaris herba induced caspase-3 activation. However, apeoptosis was blocked when SNU-1196 was treated together with the pan-caspase inhibitor Z-VAD-FMK and the caspase-3 inhibitor Z-DEVE-FMK.
After the treatment of Artemisiae capillaris herba, the mRNA expressions of caspase -3, -8, -9, p53, and p21 was increased in all cells. Artemisiae capillaris herba resulted in a significant decrease in Bcl-2 and an increase in Bax mRNA levels.
Conclusions :
These results suggest that Artemisiae capillaris herba would be beneficial in the treatment of biliary tract cancer.
Key words : Artemisiae capillaris herba, biliary tract cancer, apoptosis
Ⅰ. 緖 論
담도암은 담관의 상피를 닮은 세포로 구성된 종 양으로 그 위치에 따라 간내 담관암과 간외 담관
암으로 나눈다. 초기에는 암을 의심할 만한 특이적
증상이 없기 때문에 조기 진단이 어렵고, 발견 당
시에는 이미 진행이 된 경우가 많아서 예후가 불
량한 편이다
1. 2012년에 발표한 국내 암발생 통계
에 의하면, 2009년 우리나라 전체 암 중에서 담낭
및 기타 담도계암이 차지하는 비율은 남자 2.4%,
여자 2.6%이며, 발생빈도는 인구 10만명 당 9.6명
으로 최근까지 꾸준히 증가하는 추세이다
2.
담도암의 유일한 완치방법은 수술을 통한 근치 적 절제이다. 암세포가 대부분 주변부 간동맥, 간 문맥 등으로 침범하여 진행되는 경우가 많기 때문 에 근치적 절제가 쉽지 않고, 절제를 한 후에도 재 발이 잦은 편이다
1. 또한 항암화학요법과 방사선치 료, 광역학치료, 표적치료 및 기타 다각적 치료방법 을 통한 많은 치료가 이루어지고 있지만 아직까지 는 이들 효과에 대하여 충분한 검증이 필요하며
3,4, 담도암 치료 및 생존율 향상을 위한 지속적인 연 구가 필요한 실정이다.
茵蔯은 淸熱利濕의 효과가 있어, 임상에서 바이 러스성 간질환을 비롯한 간담질환의 치료에 광범 위하게 사용되는 약재이다
5. 茵蔯에 대한 연구는 항종양효과
6, 항미생물활성효과
7, 간섬유화 억제
8, 소염진통효과
9, 항진균효과
10, 간세포활성증가
11등 이 보고된바 있다. 그러나 담도암과 관련한 茵蔯의 항암효과는 아직까지 보고된 적은 없다.
저자는 본 연구를 통하여 한국인 담도암 환자로 부터 확립한 암세포주를 대상으로 茵蔯의 에탄올 추출물을 처리하여 항암효과에 대한 유의한 결과 를 얻었기에 이를 보고하고자 한다.
Ⅱ. 方 法
1. 재 료 1) 약 재
본 실험에 사용한 茵蔯( Artemisiae capillaris herba ) 은 대한약전 및 대한약전외 한약규격주해
12에 근거 하여 엄선한 것을 경희대학교 한방병원에서 구입 하여 실험에 사용하였다.
2) 검액의 조제
茵蔯 100 g을 80% 에탄올 수용액 1 L에 냉침하 여 4 ℃에서 추출하였으며, 매 3시간마다 분광기로 400 nm에서 흡광도를 측정하여 변화량이 둔화되어 변화량이 5% 미만으로 되었을 때 완료된 것으로 간주하였으며 48시간 정도 소요되었다. 추출액은 Whatman 여과지로 여과한 후 감압농축 하였다.
농축할 때, 용매가 완전히 제거되기 전에 증류수 를 첨하하여 얼린 다음 동결건조하여 12 g의 분말 을 얻었다(수득율은 12 %). 얻어진 동결건조 분말 은 -80 ℃ 냉동고에 보관하였고, 약재를 처리할 때 에는 dimethylsulfoxide(DMSO)(Sigma-Aldrich Inc, St, Louis, MO, USA)에 용해시킨 후 0.2 μm syringe filter로 여과하고 RPMI 1640 배양액에 필요한 농 도로 희석하여 사용하였다.
3) 세포 배양 및 시약
사람 담도암 세포주 SNU-1196를 한국세포주은 행에서 분양받아 사용하였다. 세포배양액은 RPMI 1640에 10% FBS, 1% penicillin/sterptomycin를 첨 가하여 사용하였으며, 37 ℃, 5% CO2 상태를 유지 하는 배양기에서 배양하였다.
2. 방 법
1) 세포증식 분석
세포활성은 3-(4,5-dimethylthiazol-2-yl)-2,5- diphenyltetrazolium bromide(MTT) 분석 kit인 CellTiter 96 AQueous One solution(Promega, Madison, WI, USA) 을 이용하여 측정하였다. 세포를 1×10
4cells/well의 농도로 96-well plate에 분주하고 검액을 각각 0, 50, 100, 200, 300, 500 μg/ml의 농도로 처리한 후 각각 24, 48, 72시간 동안 배양하였다. 세포 활성은 PMS/MTS solution을 이용하여 490 nm의 파장에 서 흡광도를 측정하였다.
2) 세포 주기 분석
茵蔯 추출물이 담도암 세포주의 세포주기에 미
치는 영향을 알아보기 위하여 cell cycle analysis를
시행하여 세포주기를 측정하였다. 6-well plate에
SNU-1196 세포를 5×10
5cells/ml의 농도로 분주 후
茵蔯 추출물을 농도별로 처리한 후 48시간 동안 배
양하였다. 그런 다음 세포를 PBS로 2회 세척하였
다. 그리고 계속해서 PBS 0.3 ml에 세포 침전물을
부유시키고 100% 에탄올 0.7 ml를 가하여 4 ℃에서
1시간 이상 고정시켰다. 그 후 세포 혼합물을 10 μl
의 RNase A(10 mg/ml)를 첨가하여 37 ℃에서 1시
간 동안 반응시키고, 계속해서 20 μl의 propidium iodide(1 mg/ml)로 염색하여 FACSCalibur(Becton Dickinson Immunocytometry System, San Jose, CA, USA)를 이용하여 세포 주기를 측정하였다.
3) 세포자멸 분석
茵蔯 추출물에 의한 담도암 세포주의 세포자멸 을 관찰하기 위해 Cell death detection ELISA kit (Roche Molecular Biochemicals, Mannheim, Germany) 를 이용하였다. 96-well plate에 세포를 각각 1×10
4cells/well의 농도로 분주하여 24시간 세포를 부착 시킨 후 茵蔯 추출물을 각각 0, 100, 200, 300 μg/ml 의 농도로 처리한 후 24, 48시간 동안 배양하였다.
그런 후 상층액을 제거하고 0.2 ml 용해완충액 (lysis buffer)을 첨가하여 실온에서 30분간 반응시 켜 세포를 용해시키고, 200×g에서 10분간 원심 분 리하였다. 20 μl 세포용해물 안에 존재하는 자멸세 포들은 제조사의 지시에 따라 ELISA kit를 이용하 여 DNA 분절화를 분석하였으며, 분관기의 파장 405 nm에서 흡광도를 측정하였다.
4) Caspase 활성도 측정
茵蔯에 의한 담도암 세포주의 세포사유도 연관 성을 관찰하기 위해 Caspase colorimetric assay kit 를 사용하여 intracellelar caspase-3 활성화 증가 여 부를 확인하였다. 세포를 100 mm 조직 배양 접시 에 2×10
6cells농도로 분주하여 24시간 배양하여 세 포를 부착시키고, 검액을 여러 농도로 처리한 후 typsin-EDTA로 세포를 떼어 수거하여 세포 수를 계산하였다. 그런 다음 원심 분리하여 상층액을 버 리고 세포 침전물을 PBS로 재 부유하여 1.5 ml 시 험관에 옮긴 다음 10,000 xg에 5분간 원심분리하고 상층액을 버렸다. 세포 침전물은 1×10
6농도의 세 포에 25 μl의 세포 용해액을 첨가하여 4 ℃에서 10 분간 용해시켰다. 그런 다음 10,000 xg에서 1분간 원심 분리하여 상층액에 포함된 단백질을 새로운 1.5 ml 시험관에 보관하였다. 이렇게 얻은 단백질 의 농도는 570 nm 흡광도에서 BCA 측정 방법으로 측정하였다. Caspase activity 분석은 colorimetric
assay(R & D System, Inc. Minneapolis. MN, USA) 의 방법으로 시행하였다. 96 well plate에 200 ug 단 백질이 포함된 검액을 50 μl 의 용량이 되도록 조 절하여 분주 하였다. 여기에 다시 1 mM DTT가 포 함된 2 x incubation 용액을 50 μl씩 넣고, caspase-3, -8, -9 colorimetric substrate를 각각 5 μl 씩 첨가하 여 2시간 반응시켰다. 분광기(E-max)를 이용하여 405 nm 에서의 흡광도를 측정하였다.
5) Caspase inhibitor를 투여한 후 세포 증식율 측정
96 well plate에 SNU-1196 세포를 1×10
4cells 의 농도로 분주하고 24시간 동안 배양하여 세포를 부착 시킨 다음, 50 μl의 caspase inhibitors를 포함하는 배 지로 교환하였다. 100 μl의 세포배양 중 pan-caspase inhibitor인 Z-VAD-FMK 혹은 caspase-3-specific inhibitor인 Z-DEVD-FMK의 농도는 각각 10 μM, 25 μM, 50 μM, 100 μM 이 되도록 첨가하였으며, 2 시간동안 pre-incubation 하였다. 그런 다음 茵蔯 추출물 50 μl(최종 농도 300 μg/ml)를 혼합하여 72 시간 동안 반응시켰다. 세포활성은 MTT assay와 동일한 방법으로 측정하였다.
6) 역전사 중합효소연쇄반응(RT-PCR) (1) RNA 추출
6-well plate에 SNU-1196 세포주를 분주하고 각 plate에 茵蔯 추출물을 0, 100, 200, 300 μg/ml의 농 도로 처리하였다. 72시간 후 Qiagen사의 RNeasy Mini Plus Kit를 이용하여 제작사의 방법에 따라 RNA를 분리하였다.
(2) Complementary DNA(cDNA) 합성
실험에 필요한 cDNA는 Fermentas사의 RevertAid
First-Strand cDNA Synthesis Kit를 사용하여 제
작사의 지시에 따라 시행하였다. 1 μg의 RNA와 1
μ l의 random primer를 포함하는 시료에 DEPC-처
리된 증류수를 가하여 12 μl 되게 조정한 다음 65 ℃
에서 5분간 가열한 후 5분간 얼음에 두었다. 그런 다
음 4 μl의 5×reaction buffer(250 μM Tris-HCL, pH
8.3), 1 μl의 RiboLock
TMRNase Inhibitor(200 U/μl),
2μl의 10μM deoxynucleoside triphosphate(dNTP) MIX, 1 μl의 RevertAid
TMM-MuLV Reverse Transcripase(200 U/μl)를 넣고 전체 볼륨을 20 μl 되게 조정하여 잘 섞어주었다. 반응조건은 25 ℃에 서 5분간, 42 ℃에서 60분간, 70 ℃에서 5분간으로 하여 반응시켰다. 합성된 cDNA는 -80 ℃에서 보 관하였으며 필요할 때마다 꺼내서 사용하였다.
(3) Primer 제작
House keeping gene으로 β-actin을 사용하였으 며, target gene은 Bcl-2, Bax, p53, p21, caspase-3, caspase-8, caspase-9 등을 선택하였다. Primer 합성 은 Bioneer(대전시 대덕구 문평동, 한국)에 의뢰하 여 제작하였다.
Genes Primer sequence Size (bp) GeneBank
Bcl-2 5’-GAT TGA TGG GAT CGT TGC CTT A-3’
5’-CCT TGG CAT GAG ATG CAG GA-3’ 200 NM000657 Bax 5’-GGA TGC GTC CAC CAA GAA G-3’
5’-GCC TTG AGC ACC AGT TTG C-3’ 216 NM138764 P53 5’-AAC AAC ACC AGC TCC TCT CC-3’
5’-CTC ATT CAG CTC TCG GAA CA-3’ 111 NM000546 p21WAF1/CIP1 5’-CAG ACC AGC ATG ACA GAT TTC-3’ 5’-TTA GGG CTT CCT CTT GGA GA-3’ 66 NM078467
Caspase-3 5’-CAG TGG AGG CCG ACT TCT TG-3’
5’-TGG CAC AAA GCG ACT GGA T-3’ 102 NM004346 Caspase-8 5’-GGA TGG CCA CTG TGA ATA ACT G-3’
5’-TCG AGG ACA TCG CTC TCT CA-3’ 101 NM001228 Caspase-9 5’-TGT CCT ACT CTA CTT TCC CAG GTT TT-3’
5’-GTG AGC CCA CTG CTC AAA GAT-3’ 101 BC002452 β -actin 5’-GCG AGA AGA TGA CCC AGA TC-3’
5’-GGA TAG CAC AGC CTG GAT AG-3’ 77 NM001101 Table 1. Primer Sequences for PCR.
(4) RT-PCR
PCR은 Applied Biosystem사(CA, USA)의 StepOnePlus RT PCR System을 사용하여 제작사 의 지시에 따라 시행하였다. 즉, 10 μl의 2×SYBR Green PCR Master Mix, 1 μl의 cDNA, 1 μl의 primer(sense), 1 μl의 primer(anti-sense), 7 μl의 Distilled water를 넣어 전체 볼륨을 20 μl로 조정하 였다. PCR 조건은 초기변성(denaturation)은 첫 cycle은 95 ℃에서 3분간, 이후에는 95 ℃에서 10초, 풀림(annealing)은 60 ℃에서 10초간, 연장(extension) 은 72 ℃에서 15초간으로 하여 증폭시켰다. House keeping gene으로는 β-actin을 사용하였으며, 발현
된 유전자의 상대적인 값을 정량적으로 표현하였다.
7) 통계분석
모든 데이터는 평균±표준편차로써 표기하였고, 엑셀 프로그램의 Student,s t-test를 이용하여 실험 군과 대조군의 차이를 비교하였으며, P <0.05을 기 준으로 통계적 유의성을 평가하였다.
Ⅲ. 結 果
1. 茵蔯 추출물이 담도암세포주 세포증식에 미치는 영향
茵蔯 추출물을 50, 100, 200, 300, 500 μg/ml의 농
도로 투여하여 24, 48, 72시간까지 배양한 결과 72
시간 배양하였을 때, 농도 의존적으로 세포증식이 억제되는 경향이 었다. 특히 300, 500 μg/ml의 농도 로 투여하였을 때 통계적으로 유의성 있는 결과를 얻었다.
SNU-1196은 24시간 배양 결과 50, 100, 200, 300, 500 μg/ml의 농도에서 각각 89.96±15.62%, 91.08±13.34%,
102.70±21.81%, 108.39±26.95%, 138.10±26.86%였다.
48시간에서는 각각 102.64±12.10%, 128.64±17.54%, 103.28±18.89%, 99.23±17.57%, 110.13±26.44%였다.
72시간에서는 각각 93.52±14.63%, 100.75±21.39%, 74.81±23.00%, 48.74±17.19%, 25.17±10.60%였다(Table 2, Fig. 1).
0 50 μg/ml 100 μg/ml 200 μg/ml 300 μg/ml 500 μg/ml 24 h 100 89.96±15.62 91.08±13.34 102.70±21.81 108.39±26.95 138.10±26.86 48 h 100 102.64±12.10 128.64±17.54 103.28±18.89 99.23±17.57 110.13±26.44 72 h 100 93.52±14.63 100.75±21.39 74.81±23.00 48.74±17.19* 25.17±10.60*
Values represent Mean±SD.
* : Statistically significant value compared with control group data by Student's t-test(
P
<0.05).Table 2. Effects of INJIN Concentration on Cell Viability of SNU-1196.
Fig. 1. Effects of INJIN concentration on cell viability of biliary tract cancer cells.
biliary tract cancer cells were treated with various concentrations of INJIN (0-500 μg/ml) for 24, 48, and 72 h. Cell viability was determined by the MTT assay. The data represent the Mean±SD of triplicate samples. *
P
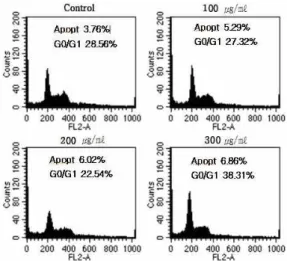
<0.05 compared to control.2. 茵蔯 추출물이 담도암세포주 세포주기에 미치는 영향
SNU-1196 세포주에 茵蔯추출물을 100, 200, 300 μ g/ml의 농도로 투여하여 세포주기 분석 결과 세 포자멸 분획은 각각 5.29%, 6.02%, 6.86%로 나타나 대조군의 3.76%와 차이를 보였다. G0/G1 분획은 대조군에서 28.56%였던 것에 비해 100, 200, 300 μg/ml 의 농도로 茵蔯추출물을 투여한 후에는 27.32%,
22.54%, 38.31%로 세포 분열 과정을 억제하는 경 향을 나타냈다(Fig. 2).
Fig. 2. Effects of INJIN concentration on cell cycle progression in biliary tract cancer cells.
Biliary tract cancer cells were cultured with various concentrations of INJIN (0-300 μg/ml) for 48 hours. Cells were harvested, treated with RNAsin and stained with propidium iodide. The DNA content was analyzed by flow cytometry. The indicated percentages are of the cells in apoptosis and G0/G1 phases.
3. 茵蔯 추출물이 담도암세포주 세포자멸에 미치는 영향
100, 200, 300 μg/ml 茵蔯 추출물을 투여한 후 24, 48, 72시간 동안 배양한 결과 SNU-1196 각 세 포주에서 세포자멸 효과를 측정한 결과 시간 및 농도가 증가함에 따라 세포자멸 효과가 유의하게
증가하였다.
24시간 배양 결과 100, 200, 300 μg/ml의 농도에 서 각각 2.125±0.437, 3.412±0.351, 4.119±0.413였으며, 48시간에서는 각각 2.982±0.176, 4.279±0.632, 5.924
±0.328 이었다. 또한 72시간에서는 각각 5.091±0.646, 6.391±0.331, 9.933±0.351 이었다(Table 3, Fig. 3).
concentration
time (hour) 0 μg/ml 100 μg/ml 200 μg/ml 300 μg/ml 24 1.000±0.107 2.125±0.437* 3.412±0.351** 4.119±0.413**
48 1.401±0.161 2.982±0.176** 4.279±0.632* 5.924±0.328**
72 4.398±0.132 5.091±0.646 6.391±0.331** 9.933±0.351**
Values represent Mean±SD.
* : Statistically significant value compared with control group data by Student's t-test (
P
<0.05) ** : (P
<0.01)Table 3. Effects of INJIN Concentration on the Apoptosis in SNU-1196.
Fig. 3. Effects of INJIN concentration on the apoptosis in biliary tract cancer cells.
Biliary tract cancer cells were cultured with various concentrations of INJIN (0-300 μg/ml) for 24, 48 and 72 hours. Apoptotic cells were measured using a cell death detection ELISA. The data represent the Mean±SD of triplicate samples.
*
P
<0.05 and **P
<0.01 compared to control.4. 茵蔯 추출물에 의한 Caspase mRNA 발현의 변 화
100, 200, 300 μg/ml 茵蔯 추출물을 투여한 후 SNU-1196 세포주에서 Caspase 3, 8, 9의 mRNA의 발현을 측정한 결과, Caspase 3, 8, 9의 유전자 발 현이 모두 농도에 따라 유의하게 증가하는 경향을
보였다(Table 4, Fig. 4).
0 100 μg/ml 200 μg/ml 300 μg/ml caspase-3 1.000 ±0.000 1.019
±0.263 1.368
±0.033** 1.523
±0.030**
caspase-8 1.000 ±0.000 1.050
±0.001** 1.130
±0.009** 1.220
±0.011**
caspase-9 1.000 ±0.000 1.028
±0.049 1.425
±0.038** 1.559
±0.062**
Values represent Mean±SD.
* : Statistically significant value compared with control group data by Student's t-test (
P
<0.05) ** : (P
<0.01)Table 4. Effects of INJIN Concentration on the
Expression of Caspase-3, Caspase-8,
and Caspase-9 in SNU-1196.
Fig. 4. Effects of INJIN Concentration on the Expression of Caspase-3, Caspase-8, and Caspase-9 mRNA in biliary tract cancer cells.
Cells were cultured with 0, 100, 200, 300 μg/ml INJIN concentration for 72hours and mRNA levels were measured by RT-PCR. The crossing point of Caspase-3, Caspase-8, and Caspase-9 with β-actin was applied to the formula, 2-(targetgene-ß actin),
and relative amounts were quantified. The data represent the mean ±SD of triplicate samples and are reported as the ratio of caspase-3, caspase-8 and caspase-9 to β-actin signals. *
P
<0.05 and**
P
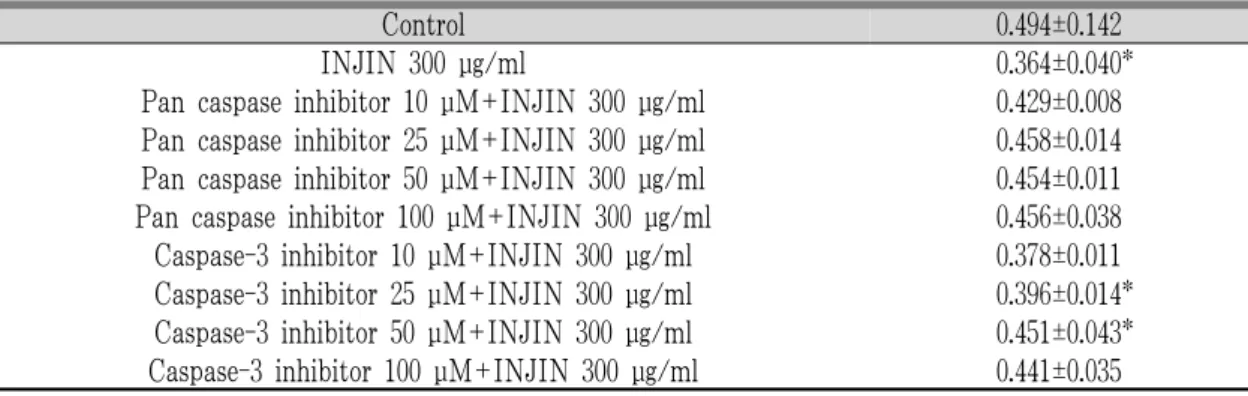
<0.01 compared to control.5. Caspase inhibitor가 茵蔯 추출물 처리 후의 세 포활성에 미치는 영향
SNU-1196 세포주에 300 μg/ml 茵蔯 추출물을 투 여한 후, pan caspase inhibitor와 caspase-3 inhibitor 를 각각 10, 20, 50, 100 μM씩 처리하여 세포활성을 측정한 결과, pan caspase inhibitor 처리 농도에 따 라 세포활성이 대체로 증가하는 경향을 보였다. 또한 caspase-3 inhibitor 처리 농도에 따라 세포활성이 유의하게 증가하는 경향을 보였다(Table 5, Fig. 5).
Control 0.494±0.142
INJIN 300 μg/ml 0.364±0.040*
Pan caspase inhibitor 10 μM+INJIN 300 μg/ml 0.429±0.008 Pan caspase inhibitor 25 μM+INJIN 300 μg/ml 0.458±0.014 Pan caspase inhibitor 50 μM+INJIN 300 μg/ml 0.454±0.011 Pan caspase inhibitor 100 μM+INJIN 300 μg/ml 0.456±0.038 Caspase-3 inhibitor 10 μM+INJIN 300 μg/ml 0.378±0.011 Caspase-3 inhibitor 25 μM+INJIN 300 μg/ml 0.396±0.014*
Caspase-3 inhibitor 50 μM+INJIN 300 μg/ml 0.451±0.043*
Caspase-3 inhibitor 100 μM+INJIN 300 μg/ml 0.441±0.035
Values represent Mean±SD.* : Statistically significant value compared with control group data by Student's t-test
Table 5. Effects of caspase inhibitors on INJIN-treated cell viability.
Fig. 5. Effects of caspase inhibitors on INJIN-treated cell viability.
Cell were treated with INJIN (500 μg/ml) in the presence or absence of Z-VAD-FMK (10-100 μM) or Z-DEVD-FMK (10-100 μM) for 72 hours. Cell viability was measured using the MTT assay. The data represent the mean±SD of triplicate samples. *
P
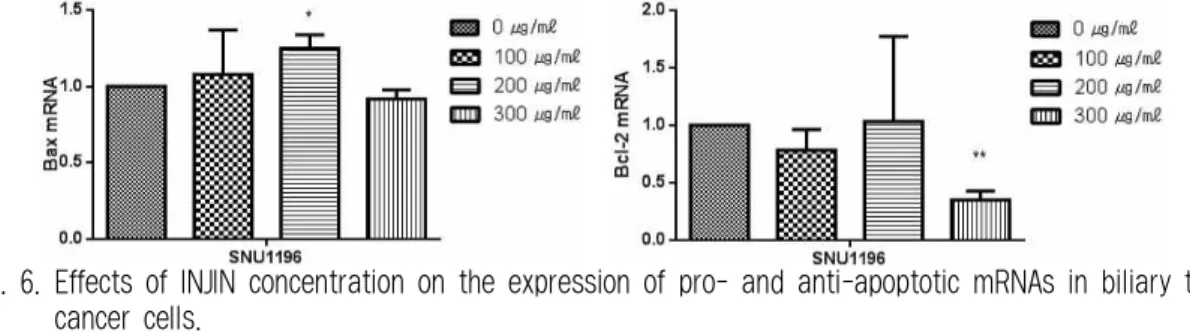
<0.05 compared to control.6. 茵蔯 추출물에 의한 Bcl-2, Bax mRNA 발현의 변화
SNU-1196 세포주에 100, 200, 300 μg/ml 茵蔯 추출물을 투여 한 후 Bcl-2, Bax gene mRNA의 발
현을 관찰한 결과, 200 μg/ml 투여 했을 때 Bax gene mRNA 발현이 유의하게 증가하였으며, 300 μg/ml 투여 했을 때 Bcl-2 유전자 발현이 유의하게 감소 하였다(Table 6, Fig. 6).
Bax mRNA-INJIN concentration (μg/ml) Bcl-2 mRNA-INJIN concentration (μg/ml)
SNU-1196 0 100 200 300 0 100 200 300
1.000 1.078±0.292 1.249±0.089* 0.917±0.061 1.000 0.784±0.180 1.034±0.738 0.351±0.078**
Values represent Mean±SD. * : Statistically significant value compared with control group data by Student's t-test (
P
<0.05) ** : (P
<0.01)Table 6. Effects of INJIN Concentration on the Expression of Pro- and Anti-apoptotic mRNAs in biliary tract cancer Cells.
Fig. 6. Effects of INJIN concentration on the expression of pro- and anti-apoptotic mRNAs in biliary tract cancer cells.
Cells were cultured with 0, 100, 200, 300 μg/ml INJIN concentration for 72hours and mRNA levels were measured by RT-PCR. The crossing point of Bcl-2, Bax with β-actin was applied to the formula, 2-(targetgene-ß actin), and relative amounts were quantified. The data represent the mean±SD of triplicate samples.
*
P
<0.05 and **P
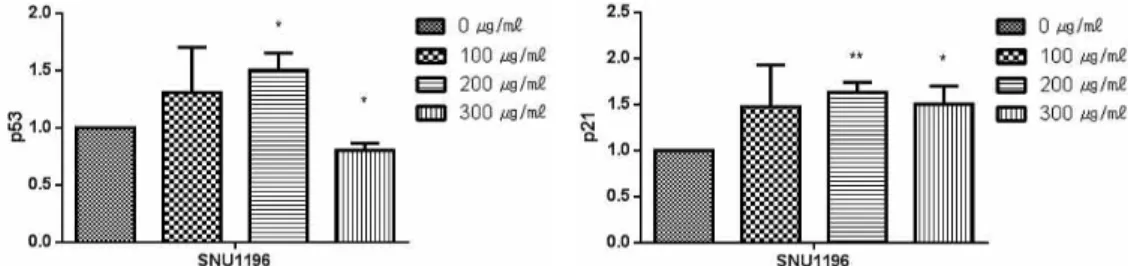
<0.01 compared to control.7. 茵蔯 추출물에 의한 p53, p21 mRNA 발현의 변화 각 세포주에 100, 200, 300 μg/ml 茵蔯 추출물을 투여 한 후 p53, p21의 발현을 관찰한 결과, p53은
200 μg/ml을 투여 했을 때 발현이 유의하게 증가 하였으며, p21은 200, 300 μg/ml을 투여 했을 때 발 현이 유의하게 증가하였다(Table 7, Fig. 7).
p53 INJIN concentration (μg/ml) p21 INJIN concentration (μg/ml)
SNU-1196 0 100 200 300 0 100 200 300
1.000 1.308±0.395 1.504±0.150* 0.802±0.063* 1.000 1.475±0.454 1.633±0.107** 1.505±0.195*
Values represent Mean±SD. * : Statistically significant value compared with control group data by Student's t-test (
P
<0.05) ** : (P
<0.01)Table 7. Effects of INJIN Concentration on the Expression of p53 and p21 in biliary tract cancer Cells.
Fig. 7. Effects of INJIN concentration on the expression of p53 and p21 in biliary tract cancer cells.
Cells were cultured with 0, 100, 200, 300 μg/ml INJIN concentration for 72hours and mRNA levels were measured by RT-PCR. The crossing point of p53, p21 with β-actin was applied to the formula, 2-(targetgene-ß actin), and relative amounts were quantified. The data represent the mean±SD of three independent samples. *