Received:
3 April 2013
Revised:
19 June 2013
Accepted:
1 July 2013
doi: 10.1259/bjr.20130190
Cite this article as:
Kim JY, Kim SH, Lee HJ, Kim MJ, Kim YH, Cho SH, et al. Utilisation of combined
18F-FDG PET/CT scan for differential diagnosis between benign and malignant adrenal enlargement. Br J Radiol 2013;86:20130190.
FULL PAPER
Utilisation of combined 18 F-FDG PET/CT scan for differential diagnosis between benign and malignant adrenal enlargement
1
J Y KIM, MD ,
1S H KIM, MD ,
1H J LEE, MD ,
1M J KIM, MD ,
1Y H KIM, MD ,
2S H CHO, MD and
3K S WON, MD
1
Department of Radiology, Dongsan Hospital, Keimyung University, Daegu, Republic of Korea
2
Department of Radiology, Kyungpook National University Hospital, Daegu, Republic of Korea
3
Department of Nuclear Medicine, Dongsan Hospital, Keimyung University, Daegu, Republic of Korea
Address correspondence to: Dr See Hyung Kim E-mail: [email protected]
Objective: To assess the properties of adrenal lesions with and without known primary cancer and investigate predictors for differential diagnosis between benign and malignant adrenal enlargement.
Methods: This retrospective study used fluorine-18 fludeoxyglucose positron emission tomography (PET)/CT in 325 patients with adrenal lesions (229 with known primary cancer and 96 without primary cancer). Age, sex, the presence of right and left masses, nodules or hyperplasia, unenhanced attenuation, maximum standardised uptake value (SUV
max) ratio, and the presence of metastasis in other body parts and locations of the primary cancer were assessed. Univariate and multivariate analyses were used to assess variables associated with risk of adrenal metastasis.
Results: Patients with adrenal metastasis vs those without had a higher frequency of primary lung cancer (52.3% vs 30.7%) but a lower frequency of gastrointes- tinal cancer (7.9% vs 16.6%). The frequency of other
abnormalities, including adenoma and hyperplasia, was similar between patients with and without known primary cancer. A higher proportion of patients with adrenal metastasis regardless of primary cancer site were younger, had a nodule or a mass, had an unenhanced attenuation of .10 HU, had an SUV
maxratio of .2.5, and had metastasis in other body parts. Analysis found independent associa- tions of age, unenhanced attenuation of .10 HU, SUV
maxratio of .2.5 and the presence of metastasis in other body parts with adrenal metastasis. The combination of the four variables was strongly associated with adrenal metastasis.
Conclusion: PET/CT was useful in characterising adrenal lesions as benign or malignant and helpful in identifying adrenal metastasis and cancer severity.
Advances in knowledge: PET/CT can help in the differen- tial diagnosis between benign and malignant adrenal enlargement.
The adrenal gland is a common site of metastasis in patients with cancer. Up to 50% of adrenal lesions in patients with known primary non-adrenal cancers are malignant dis- ease [1–4]. The most common malignant lesions that metastasise to the adrenal gland include lung, liver, colon, lymphoma, melanoma, breast, kidney, oesophagus, pan- creas and stomach cancer [4–6]. However, diagnosis of an adrenal lesion as malignant or benign can be problematic.
Characterisation of these adrenal lesions is therefore crit- ical to stage the primary disease, direct therapy and predict prognosis. Although CT and MRI are typically used to characterise a lesion, a small but important number of adrenal lesions are found to be indeterminate on cross- sectional images [7–9].
Several reports have documented the effectiveness of stand-
emission tomography (PET) to differentiate benign from malignant adrenal lesions [8–10]. Interest has focused on the ability of integrated in-line PET/CT to definitively characterise these lesions given that this technique com- bines the anatomical and densitometrical applications of CT and the functional and metabolic advantages of PET.
Several studies have reported PET/CT’s high sensitivity, specificity and accuracy for detecting adrenal metastatic lesions [7–10].
PET/CT can also be used as a non-invasive method to help
assess the lesion, facilitating diagnosis and treatment deci-
sions. The purpose of our study was to investigate whether
PET/CT can reliably detect differences between malignant
and benign lesions, tumour characteristics associated with
the location of the primary cancer and predictors for adrenal
METHODS AND MATERIALS
Our study was approved by Institutional Review Board of local general hospitals, and the requirement of informed consent was waived owing to the retrospective nature of our study.
Patient population
From January 2006 to July 2012, 325 consecutive patients had adrenal lesions as identified by an initial integrated in-line PET/
CT that were diagnosed as adrenal metastasis (for those with known primary cancers) or adenoma and hyperplasia by exami- nation 6–30 months after the initial PET/CT. The mean follow-up period was 18 months. During the follow-up period, we charac- terised the lesions as either benign or malignant.
Patients whose lesions were diagnosed as myelolipomas by the presence of macroscopic fat were excluded from our study, as were patients who had been treated for malignant or benign lesions in the adrenal gland, had diabetes or any other disorder affecting glucose metabolism.
PET/CT techniques
Patients fasted for at least 6 h before PET/CT. Blood glucose was measured 1 h before injection of 18 F-FDG and was ideally less than 150 mg dL 21 . The used 18 F-FDG dose was 10–12 mCi (370–444 MBq), with 1 h uptake. Imaging was acquired with an integrated in-line PET/CT system (Discovery™ ST; GE Healthcare, Waukesha, WI). Unenhanced CT from the base of the skull to the upper thigh was performed for attenuation correction and di- agnosis (300 mA; tube rotation time 0.5 s; 120 kVp; table speed 13.5 mm per rotation; beam collimation 831.25 mm). Axial CT images were reconstructed with a soft reconstruction kernel with a slice thickness of 3.75 mm and an interval of 3.27 mm to match the PET images.
The PET images were obtained in the two-dimensional mode for 3 min per bed position, and the images were reconstructed with standard vendor-provided reconstruction algorithms in- corporating ordered subset expectation maximisation. Attenua- tion correction of PET images was performed with attenuation data from the CT component of the examination. The man- ufacturer’s software was used to correct emission data for scatter, random events and dead-time losses.
PET/CT analysis
The PET/CT components were reviewed on a high-resolution workstation (Marosis; Infinity, Seoul, Republic of Korea). The PET and fused CT images were analysed in both axial and coronal planes. Two radiologists and one nuclear medicine physician reviewed the images, and decisions were reached by consensus.
The CT component measured the size of the adrenal lesion. The adrenal lesion unenhanced attenuations were measured from the unenhanced attenuation correction CT by taking the mean of two measurements from a region of interest (ROI). The ROI covered from one-half to two-thirds of the surface area of the lesion, avoiding adjacent retroperitoneal fat and inhomogeneous areas.
The PET and fused CT images were used to measure the average standardised uptake value (SUV) over an ROI placed on the liver
and the adrenal lesion. The PET/CT images reconstructed in the coronal and axial planes were used to confirm accurate place- ment of the ROI on the adrenal gland. The ROI included at least two-thirds of the adrenal lesion. A similar-sized ROI was placed within the right hepatic lobe free from the detectable metastatic lesion. Care was taken to avoid the periphery of the lesion, thereby minimising the partial volume effect. Maximum SUV (SUV max ) and average SUV (SUV avg ) were generated by the software with the equation SUV5C tis /D inj /body weight, in which SUV is normalised for body weight in kilograms, C tis is tissue concentration in megabecquerels per milliliter and D inj is the injected dose in megabecquerels. The adrenal SUV max ratio was divided by the liver SUV avg to calculate a ratio (SUV ratio ) for each lesion.
Standard reference
The results of follow-up images were all used as reference standards for final characterisation of the adrenal lesion in our study. Lesions that remained stable in size for more than 6 months at follow up were considered benign. Criteria for ma- lignancy included an interval increase in size or more than 20%
decrease in size after appropriate therapy. The mean follow-up period for lesions was 18 months. As this study is a retrospective examination and analysis of the clinical data, there were a variety of follow-up methods, such as contrast-enhanced CT, MRI and PET/CT.
Statistical analysis
Age was shown as mean 6 standard deviation and compared between groups by independent Student’s t-test. Other cate- gorical variables were shown as proportions, and the association between categorical variables was compared with Fisher’s exact test. The variables associated with adrenal metastasis were shown by their odds ratios with the 95% confidence interval (CI) in the univariate and multivariate logistic regression models.
The cut-off point of unenhanced attenuation (10 HU) in the prediction of adrenal metastasis was determined by the com- monly accepted value for distinguishing between benignancy and malignancy, and the cut-off point of SUV max ratio (2.5) was determined by the Youden’s index (the maximum of sensitivity and specificity-1) in the receiver operating characteristic curves analysis. The variables with p-values ,0.05 were included in a multivariate logistic regression model, selected by a forward conditional method. Statistical analysis was performed using ap- propriate software (SPSS ® v. 18.0 for Windows; SPSS, Chicago, IL). Null hypotheses of no difference were rejected if the p-value was ,0.05 or, equivalently, if the 95% CI of odds ratio estimates excluded 1.
RESULTS
Patient demography analysis
PET/CT was performed on 10 750 patients, including 3562
patients with primary cancer and 7188 patients without primary
cancer. Of these, 325 patients had adrenal lesions, 229 of whom
had known primary cancer and 96 of whom did not have known
primary cancer. Among the 325 patients with adrenal lesions, 28
were histologically diagnosed; of these, 21 were diagnosed as
having malignant lesions and the remaining 7 were diagnosed as
having benign lesions.
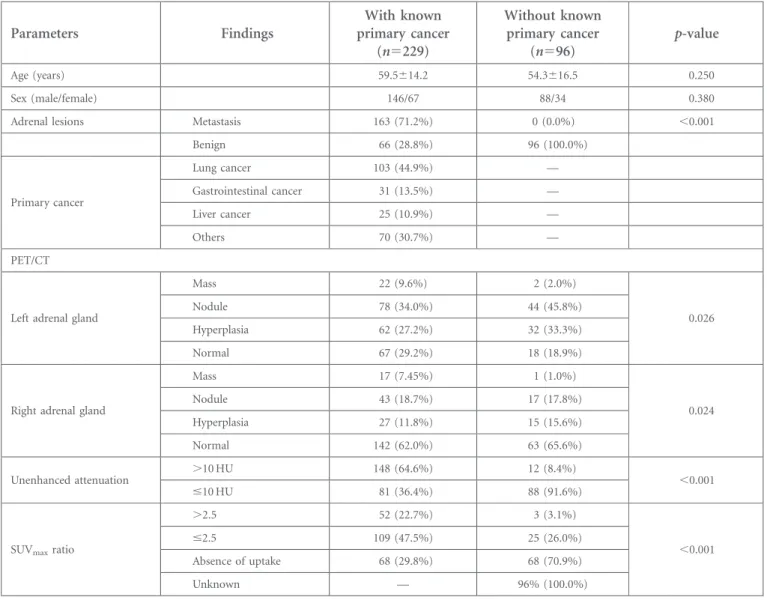
Patients’ demographics and PET/CT characteristics are summar- ised in Table 1. The presence of lesions in both groups of patients was not associated with age or sex, and the majority of patients in both groups were males. Over half of the patients with primary cancer had a metastatic lesion. The types of primary cancers included lung (44.9%), gastrointestinal (13.5%), liver (10.9%) and others (30.7%).
The proportion of patients with a mass in both adrenal glands was small in both groups but was significantly higher for the patients with known primary cancer. The proportion of lesions that were nodule, hyperplasia or normal was similar in both groups. Unenhanced attenuation .10 HU and SUV max ratios .2.5 were significantly higher in patients with known primary cancer than in those without. More patients without known primary cancer had evidence of no 18 F-FDG uptake.
Analysis of characteristics in patients with known primary cancer
The characteristics of patients with known primary cancer and categorisation by primary cancer types are summarised in Table 2.
Patients with adrenal metastasis were younger, more often had nodules or masses and more often both unenhanced attenuation .10 HU and an SUV max ratio .2.5. As would be expected, more patients with adrenal metastasis had metastasised tumours in other parts of their body. Patients with adrenal metastasis most often had primary lung cancer and less often had primary tumours in the gastrointestinal tract and the liver. Patients without adrenal me- tastasis had a higher rate of gastrointestinal cancer. Those with adrenal metastasis and a gastrointestinal cancer primary were significantly younger than those without adrenal metastasis.
Univariate analysis of predictors of adrenal metastasis The results of univariate analysis for predicting adrenal metas- tasis in patients with known primary cancer and categorisation by primary cancer are summarised in Table 3. Age, presence of left and right nodules or masses, unenhanced attenuation, SUV max ratio, and metastasis in other parts and locations of the primary cancer are significantly associated with adrenal metas- tasis. However, only age, unenhanced CT attenuation, SUV max
ratio and the presence of metastasis in other parts were associ- ated with adrenal metastasis after stepwise forward selection.
Table 1. Patients ’ demographics and PET/CT characteristics
Parameters Findings
With known primary cancer
(n5229)
Without known primary cancer
(n596) p-value
Age (years) 59.5 614.2 54.3 616.5 0.250
Sex (male/female) 146/67 88/34 0.380
Adrenal lesions Metastasis 163 (71.2%) 0 (0.0%) ,0.001
Benign 66 (28.8%) 96 (100.0%)
Primary cancer
Lung cancer 103 (44.9%) —
Gastrointestinal cancer 31 (13.5%) —
Liver cancer 25 (10.9%) —
Others 70 (30.7%) —
PET/CT
Left adrenal gland
Mass 22 (9.6%) 2 (2.0%)
0.026
Nodule 78 (34.0%) 44 (45.8%)
Hyperplasia 62 (27.2%) 32 (33.3%)
Normal 67 (29.2%) 18 (18.9%)
Right adrenal gland
Mass 17 (7.45%) 1 (1.0%)
0.024
Nodule 43 (18.7%) 17 (17.8%)
Hyperplasia 27 (11.8%) 15 (15.6%)
Normal 142 (62.0%) 63 (65.6%)
Unenhanced attenuation .10 HU 148 (64.6%) 12 (8.4%)
,0.001
#10 HU 81 (36.4%) 88 (91.6%)
SUV
maxratio
.2.5 52 (22.7%) 3 (3.1%)
,0.001
#2.5 109 (47.5%) 25 (26.0%)
Absence of uptake 68 (29.8%) 68 (70.9%)
Unknown — 96% (100.0%)
PET, positron emission tomography; SUV
max, maximum standardised uptake value.
Tabl e 2 . Cha racteristics in pat ients with kno wn prim ary can cer and catego risation b y prim ary can cer type Parameters Findings Adrenal metastasis All patients with known primary cancer (n 5 229)
Patients with lung cancer (n 5 103) Patients with gastrointestinal cancer (n 5 31)
Patients with liver cancer (n 5 25) Yes (n 5 151) No (n 5 78) p-value Yes (n 5 79) No (n 5 24) p-value Yes (n 5 13) No (n 5 18) p-value Yes (n 5 12) No (n 5 13) p-value Age (y ears) 54.8 6 12.5 65.5 6 11.7 0.028 59.2 6 13.0 62.4 6 11.7 0.090 56.1 6 12.7 64.8 6 10.4 0.010 6 0.4 6 9.9 57.3 6 11.2 0.160 Left adren al N odule or mass 76 (50.3%) 2 4 (30.7%) 0.003 36 (45.5%) 8 (33.3%) 0.125 6 (46.1%) 7 (38.8%) 0 .381 5 (41.6%) 7 (53.8%) 0.580 Right adren al N odule or mass 49 (32.4%) 1 1 (14.1%) 0.009 19 (24.0%) 5 (20.8%) 0.430 4 (30.7%) 5 (27.7%) 0 .600 5 (41.6%) 9 (69.2%) 0.057 U nenhanc ed # 10 HU 11 (8.8%) 3 1 (89.9%) 0.001 5 (9.0%) 1 0 (76.9%) 0.009 2 (20.0%) 1 1 (91.6%) 0 5 A ttenuation . 10 HU 114 (91.2%) 4 (11.1%) 0.001 50 (91.0%) 3 (23.1%) 0.010 8 (80.0%) 1(8.4%) 6 0 SUV
maxratio
# 2.5 68 (45.0%) 4 1 (52.5%) 2 9 (36.7%) 5 (20.8%) 8 (61.5%) 6 (33.3%) 0 (0.0%) 0 (0.0%) . 2.5 50 (33.1%) 2 (2.1%) 3 2 (40.5%) 1 (4.1%) 5 (38.4%) 0 (0.0%) 6 (50.0%) 5 (38.4%) No
18F -FDG uptak e 9 (5.9%) 5 9 (75.6%) , 0.001 3 (3.7%) 1 5 (62.5%) , 0.001 1 (7.6%) 1 1 (61.8%) , 0.001 1 (8.3%) 7 (53.8%) , 0.001 M etastasis in other parts
Y es 121 (73.5%) 2 4 (29.4%) , 0.001 62 (74.6%) 9 (29.1%) , 0.001 11 (84.6%) 9 (50.0%) 0 .008 8 (58.3%) 4 (23.0%) 0.214 N o 30 (13.2%) 5 4 (66.6%) 1 7 (18.9%) 1 5 (54.1%) 2 (15.3%) 9 (50.0%) 4 (0.25%) 9 (61.5%) Primar y
L u ng cancer 77 (49.0%) 2 6 (37.1%) 0.002 Gastro intestinal canc er 15 (7.9%) 1 6 (24.3%) 0.014 Liver cancer 13 (7.2%) 1 2 (17.9%) 0.174 Other 46 (28.4%) 2 4 (34.6%) 0.156
18F-FDG, flourine-18 fludeo xyglucose; SUV
max, maximum standardised uptake value.
Tabl e 3 . Univariate analysis for pred icting adr enal meta stasis in pati ents with k n o w n prima ry can cer and cat egoris ation b y prima ry can cer type Parameters Findings All patients with known primary tumour (n 5 229) Patients with gastrointestinal cancer (n 5 103) Patients with lung cancer (n 5 31)
Patients with liver cancer (n 5 25) OR (95% CI) p-value OR (95% CI) p-value OR (95% CI) p-value OR (95% CI) p-value A ge (y ears) 0.96 (0.94 , 0.98) 0. 024 0.95 (0.94 , 1 .00) 0.142 0.91 (0.86 , 0.99) 0. 028 1.05 (0.97 , 1 .18) 0.176 Left adr enal N odule or mass 2.31 (1.34 , 3.95) 0. 042 2.15 (0.88 , 5 .30) 0.093 2.04 (0.51 , 8.24) 0. 317 1.68 (0.31 , 9 .01) 0.553 Right adr enal N odule or mass 2.38 (1.29 , 4.21) 0. 038 1.35 (0.46 , 3 .58) 0.631 1.45 (0.35 , 7.29) 0. 638 9.07 (0.86 , 97.53 ) 0.068 U nenh anc ed # 10 HU 3.25 (1.54 , 9.26) , 0. 001 2.99 (1.34 , 9 .06) , 0.001 12.57 (1.42 , 86.51 ) 0 .031 N A A ttenuatio n . 10 HU 414 .5 (34.1 , 3712.1) , 0. 001 321 .5 (12.1 , 209 5.1) , 0.001 6.54 (1.01 , 78.42 ) 0 .044 N A SUV
maxratio # 2.5 15.4 (6.3, 38.2) , 0. 001 39.4 (7.3, 210.8) , 0.001 17.5 (1.4, 171 .5) 0. 015 8.30 (0.76 , 93.22 ) 0.085 . 2.5 509 .8 (58.2 , 4215.4) , 0. 001 321 .0 (27.2 , 371 2.8) , 0.001 N A N A M etastasis in other parts Y es 5.35 (2.05 , 8.99) , 0. 001 5.05 (2.09 , 12.51 ) , 0.001 14.2 (1.6, 129 .2) 0. 019 3.68 (0.88 , 23.23 ) 0.141 P rimar y
L ung canc er 2.52 (1.32 , 4.93) 0. 004 Gastr ointes tinal canc er 0.68 (0.32 , 1.43) 0. 180 Liv er canc er 0.71 (0.32 , 1.81) 0. 006 Other — NA, not applicable; OR, odds ratio; SUV
max, maximum standardised uptake value; 95% CI, confidence interval. Reference groups indicate that the corresponding variable had a significant influence on adrenal metastasis. N A indicates that the odds ratio was no t performed o w ing to s mall o r zero count.
The results of multivariate analysis for variables associated with adrenal metastasis are summarised in Table 4. After controlling for the unenhanced attenuation, SUV max ratio and metastasis to other parts, the risk for developing adrenal metastasis decreased slightly by each year of increasing age. Controlling for age, unenhanced attenuation and SUV max ratio, patients with me- tastasis to other parts had a significantly higher risk of adrenal metastasis than those with no adrenal metastasis. After controlling for the other two variables, unenhanced attenuation .10 HU and an SUV max ratio .2.5 raised the risk of adrenal metastasis sig- nificantly. This relationship held consistently across the major sites of lung and gastrointestinal cancer, although numbers were too small for significance with liver cancer.
Multivariate analysis of predictors of adrenal metastasis
The results of multivariate analysis for predicting adrenal me- tastasis in patients with known primary cancer and in patients with lung and gastrointestinal cancers are summarised in Table 5.
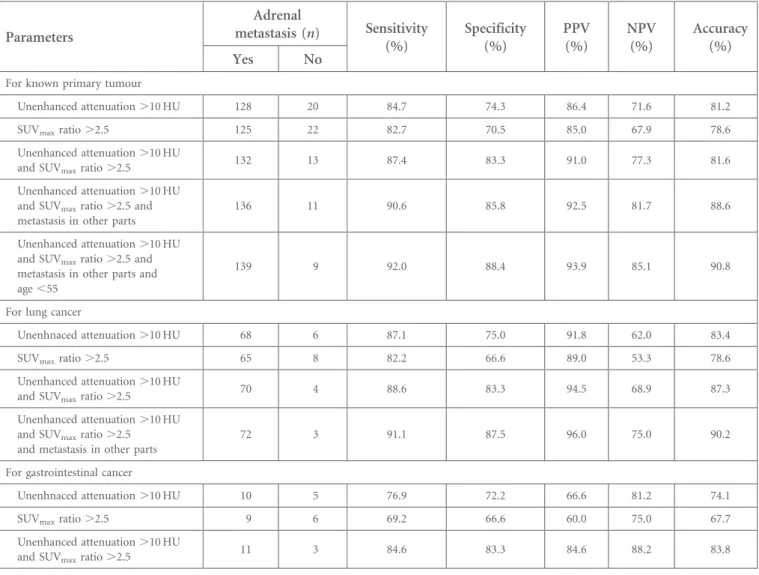
For patients with known primary cancer, age, unenhanced atten- uation, SUV max ratio and metastasis to other parts were associated with adrenal metastasis. The highest accuracy for predicting ad- renal metastasis was for the combination of “unenhanced atten- uation .10 HU, SUV max ratio .2.5, metastasis to other parts or age”, with 92.0%, 88.4% and 90.8% sensitivity, specificity and accuracy, respectively (Figure 1). The pairing of “unenhanced attenuation .10 HU or SUV max ratio .2.5” had relative lower sensitivity, specificity and accuracy than the combination of the variables. These findings held for primary site-specific analysis as well as for both lung and gastrointestinal cancer.
DISCUSSION
Our retrospective study used PET/CT to assess the character- istics of adrenal lesions in patients with known primary cancer and without primary cancer. Once an adrenal lesion has been detected in patients with cancer, its characterisation is critical to stage the primary disease. The most common clinical conundrum is to differentiate benign non-functioning lesions from metastatic lesions. Patients with known primary cancer were more likely to have an adrenal metastatic lesion than patients with no primary tumour. The risk of adrenal metastases is very low in patients with no history of primary cancer. Song et al [11] reported that a study of 1049 consecutive incidental adrenal masses in patients with no history of cancer did not find a single malignancy.
Imaging techniques to differentiate these lesions must be as close to 100% specific as possible so as not to risk making a diagnosis of benignancy in error [12]. The unenhanced CT and contrast- enhanced CT washout study and chemical shift MRI meet these principles [13–17]. The use of an integrated PET/CT enables confident localisation and characterisation of adrenal lesions [18]. Unenhanced attenuation data from an integrated PET/CT can characterise most benign adenomas given that the 10-HU threshold to differentiate benign from indeterminate lesions has been firmly established in clinical practice [19–23]. The use of a 10-HU threshold brings the sensitivity up to 79% and decreases the specificity to 96% [13,16,23]. The integrated PET/
CT is useful in cases in which the adrenal lesion has metabolic activity equal to or less than the background activity. Bagheri
Tabl e 4 . Imp act v ariables o f adrena l m e tastasis b y mul tivariate anal ysis Parameters Findings All patients with known primary tumour a (n 5 229) Patients with lung cancer b (n 5 103)
Patients with gastrointestinal cancer c (n 5 31) OR (95% CI) p-value OR (95% CI) p-value OR (95% CI) p-value A ge (y ears) 0.97 (0.94 , 0.99) 0.021 N A 0.87 (0.78 , 1.00) 0.070 U nenh anc ed . 10 HU 2.62 (1.23 , 8.53) , 0.001 2. 10 (1.24, 8.76) , 0.001 1.27 (0.29 , 5.01) 0.638 A ttenuatio n # 10 HU 356 .1 (29.8 , 3213.2) , 0.001 278.3 (10.9, 1825. 8) , 0.001 12.0 (1.3, 57.5) 0.035 SUV
maxratio # 2.5 13.9 (5.3, 36.8) , 0.001 35. 8 (5.9, 194 .6) , 0.001 21.7 (1.5, 280 .5) 0.020 . 2. 5 471 .5 (53.9 , 4240.2) , 0.001 310.7 (25.4, 3750. 7) , 0.001 N A M etastasis in other parts Y es 4.41 (1.74 , 9.22) , 0.001 4. 07 (1.04, 14.23 ) 0.042 N A NA, not applicable; OR, odds ratio , SUV
max, maximum standardised uptake value; 95% CI, confidence interval. Reference group indicates that the corresponding variable had a significant influence on adrenal metastasis. N A indicates that the odds ratio was no t performed o w ing to s mall o r zero count.
ap 5 0.321 in Hosmer and Lemesho w test indicates that the multivariate model fit well.
bp 5 0.686 in Hosmer and Lemesho w test indicates that the multivariate model fit well.
cp 5 0.136 in Hosmer and Lemeshow test indicates that the multivariate model fit well.
et al [24] found that 68% of normal adrenal glands had in- creased 18 F-FDG activity compared with the background and that identification of adrenal glands was difficult with PET alone.
Metser et al [20] suggested using an SUV max of 3.1 for detecting malignant adrenal lesions.
The combination of unenhanced CT and SUV max ratio is highly accurate in distinguishing between benign and malignant adre- nal lesions [25]. In our study, applying the suggested unen- hanced attenuation and SUV max ratio cut-off values of 10 HU and 2.5, respectively, substantially increased the accuracy of the test and would have decreased the number of false-positive results. Our study found that PET/CT was efficient in differen- tiating between benign and malignant adrenal lesions. Our study found that approximately 40% of patients with primary cancer did not have a malignant adrenal lesion, similar to previous reports [26]. Moreover, adrenal lesions in patients without pri- mary cancer were all benign or owing to hyperplasia, consistent with the low frequency (approximately 10%) of primary adrenal tumours [26]. Of the patients without known primary cancer, 8.4% had an unenhanced attenuation of .10 HU and 3.1% had an SUV max ratio of .2.5. Of the patients with known primary
cancer but no adrenal metastasis, 11.1% had unenhanced at- tenuation of .10 HU and 2.1% had an SUV max ratio of .2.5.
Among patients with known primary cancer, metastatic tumours were predominantly found in the left adrenal gland (50.3% of patients). Generally, left adrenal lesions such as nodules or hy- perplasia were overrepresented [27]. This may have been owing to developmental differences between the left and right adrenal glands, such as different anatomical positioning and formation of the asymmetrical mass. Also, liver SUV avg likely had no effect on our results, as the difference in the means of liver SUV avg was small and would have had minimal impact on a calculated SUV ratio.
Many malignant lesions are capable of adrenal gland metastasis [10]. In our study, the most common primary cancer was lung (44.9%). Our study was performed with a heterogeneous group of patients with all types of malignant diseases. It may be that groups of patients with lung, gastrointestinal and liver cancer are more likely to have adrenal metastasis than are group of patients with different cancers, potentially introducing interpreter bias. The majority of patients with adrenal metastasis also had metastatic
Table 5. The sensitivity, specificity, PPV and NPV of combining variables in the prediction for adrenal metastasis
Parameters
Adrenal
metastasis (n) Sensitivity (%)
Specificity (%)
PPV (%)
NPV (%)
Accuracy Yes No (%)
For known primary tumour
Unenhanced attenuation .10 HU 128 20 84.7 74.3 86.4 71.6 81.2
SUV
maxratio .2.5 125 22 82.7 70.5 85.0 67.9 78.6
Unenhanced attenuation .10 HU
and SUV
maxratio .2.5 132 13 87.4 83.3 91.0 77.3 81.6
Unenhanced attenuation .10 HU and SUV
maxratio .2.5 and metastasis in other parts
136 11 90.6 85.8 92.5 81.7 88.6
Unenhanced attenuation .10 HU and SUV
maxratio .2.5 and metastasis in other parts and age ,55
139 9 92.0 88.4 93.9 85.1 90.8
For lung cancer
Unenhnaced attenuation .10 HU 68 6 87.1 75.0 91.8 62.0 83.4
SUV
maxratio .2.5 65 8 82.2 66.6 89.0 53.3 78.6
Unenhanced attenuation .10 HU
and SUV
maxratio .2.5 70 4 88.6 83.3 94.5 68.9 87.3
Unenhanced attenuation .10 HU and SUV
maxratio .2.5 and metastasis in other parts
72 3 91.1 87.5 96.0 75.0 90.2
For gastrointestinal cancer
Unenhnaced attenuation .10 HU 10 5 76.9 72.2 66.6 81.2 74.1
SUV
maxratio .2.5 9 6 69.2 66.6 60.0 75.0 67.7
Unenhanced attenuation .10 HU
and SUV
maxratio .2.5 11 3 84.6 83.3 84.6 88.2 83.8
NPV, negative predictive value; PPV, positive predictive value; SUV
max, maximum standardised uptake value.
cancer in other body parts (73.5%), especially patients with primary gastrointestinal cancer (84.6%). These results were consistent with the fact that patients in our study who had adrenal metastasis had advanced cancer.
Univariate analysis revealed that age, unenhanced attenuation, SUV max ratio and the presence of metastasis in other parts were independent predictors for adrenal metastasis in patients with known primary cancer. The risk of adrenal metastasis from known primary cancer decreased with every increasing year of age. The same variables, except age, were associated with adrenal metastasis in patients with lung and gastrointestinal cancer. Mul- tivariate analysis revealed that in patients with primary cancer, unenhanced attenuation .10 HU, an SUV max ratio .2.5 and the presence of metastasis in other parts yielded high sensitivity, spec- ificity and accuracy for predicting adrenal metastasis. For patients with gastrointestinal cancer, unenhanced attenuation .10 HU and an SUV max ratio .2.5 were the best combination of sensitivity, specificity and accuracy for predicting adrenal metastasis.
Our study had a few important limitations. First, like many similar studies, it was conducted retrospectively. Second, we
used follow-up data to determine the nature of the adrenal lesions because we had pathological proof for only a few patients.
However, this situation is reflective of current practice. Most adrenal nodules are characterised with either follow-up data or imaging, and biopsy is reserved for a few selected indeterminate lesions. Third, our analysis was quantitative. It can be argued as to whether quantitative or qualitative methods are more effective in distinguishing between malignant and benign adrenal lesions.
Finally, the population of the study was small (n5325), and patients with lung cancer accounted for roughly 50% of our population. Therefore, the findings of the total population with known primary cancers may reflect the characteristics of a lung cancer population. Larger scaled studies including sizable pop- ulations representing multiple primary cancer types are needed to more fully assess the variables that predict adrenal metastasis.
In conclusion, on the basis of all our findings, we conclude that PET/CT is useful for characterising adrenal lesions present with or without known primary cancers. We identified variables that may be useful in assessing the risk of developing adrenal metas- tasis. PET/CT may help the clinician in diagnosis and in de- termining the optimal treatment strategies in patients with cancer.
Figure 1. A 39-year-old female with uterine cervical cancer. (a) The unenhanced CT scan shows a lesion measuring approximately 15 mm in the left adrenal nodule (arrow) with homogeneous attenuation (22 HU). (b) On integrated PET/CT scan, the lesion shows a high
18F-FDG uptake (SUV
maxratio 4.8). (c) A high
18F-FDG uptake lesion (SUV
maxratio 5.0) is shown in the left upper lung. (d) At follow-up 8 months later after appropriate chemotherapy, integrated PET/CT scan shows interval increases in size and aggravated
18