박 영 민,*1 최 인 호,2 장 병 희3
P ERFORMANCE A NALYSIS OF H OVERING UH-60A R OTOR B LADE Y.M. Park,*1 I.H. Choi
2 and B.H. Chang
3
The present paper describes the results of performance analysis for UH-60A rotor blade in hover. For the numerical simulations, commercial CFD software, FLUENT was used with Spalart-Allmaras turbulence model. The flow solver was based on node based scheme and second order spatial accuracy options was used for simulations.
For the enhancement of wake capturing capability, high resolution grid was used around tip vortex region. Granting that somewhat over-prediction of thrust was observed near blade tip region, performance was well correlated with experimental data within 3% accuracy in the operating region. Finally it was shown that the present flow solver can be used as a preliminary performance analysis tool for hovering helicopter rotor blades.
Key Words :
(CFD), (hovering), (performance), UH-60A(UH-60A), (rotor blade)
Corresponding author, E-mail: [email protected]
1.
(CFD)
Caradonna and Tung [1] UH-60A [2]
. Caradonna and Tung
. UH-60A
. UH-60A
[3-8]
.
tip vortex
free wake method, lifting line method, vortex embedding [4-6]
.
tip vortex modeling CFD
[7,8].
FLUENT
[9] Caradonna and Tung TRAM
.
FLUENT UH-60A
. collective pitch
(FM) .
FLUENT .
2.
2.1
FLUENT
3D, steady, implicit, Navier-Stokes, segregated type, node-
based . Spalart-Allmaras
turbulence intensity turbulence length scale
Fig. 1 Planform of UH-60A rotor blade
r/R
TwsitAngle
0.00 0.20 0.40 0.60 0.80 1.00
-4 -2 0 2 4 6 8 10 12 14
Fig. 2 Twist angle distribution of UH-60A rotor blade
Fig. 3 Surface mesh distributions of UH-60A blade
Fig. 4 Periodic boundary mesh and blade surface
0.1%, 0.01m .
2 upwind .
(periodic boundary)
pressure-inlet . FLUENT
pressure-inlet (total pressure)
. pressure-inlet
starting vortex circulation
.
2.2 UH-60A
UH-60A [10]
.
SC1095 SC1094R8 Fig. 1
. SC1094R8 SC1095 droop
1 .
SC1094R8 1 twist
.
Fig. 2 UH-60A twist
. Twist [10]
.
linear transition sweep
0.93R trailing edge leading edge 20
. chord
aerodynamic center . Fig. 3
200
. 25
.
Fig. 4 wake
. 5~6
(node) (cell)
4M 5.7M .
.
3. UH-60
3.1
Mach 0.65 4.3, 5.5, 7.3, 8.5, 9.1, 10.5, 11.0, 11.8
.
Experiment[2]
- 0.0850 0.00690 0.73
Present
0.0848 0.00694 0.72 Table 1 Comparison of FM at
=0.085
Iteration CT/σ
0 4000 8000 12000 16000 20000 24000
0.00 0.02 0.04 0.06 0.08 0.10 0.12 0.14 0.16
Collective Pitch =11deg
Collective Pitch =4.3 deg
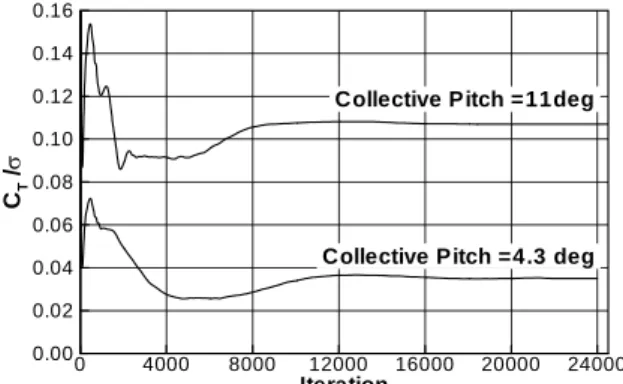
Fig. 5 Convergence histories for high and low thrust condition
C ollective P itch CT/σ
4 5 6 7 8 9 10 11 12
0.00 0.02 0.04 0.06 0.08 0.10 0.12 0.14
Experim ent
Experim ent with 1.2oOffset Present
Fig. 6 Collective pitch and thrust coefficient for UH-60A rotor blade
CT/σ
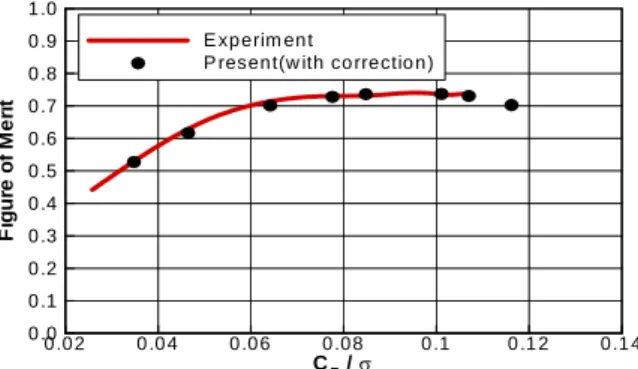
FigureofMerit
0.02 0.04 0.06 0.08 0.1 0.12 0.14
0.0 0.1 0.2 0.3 0.4 0.5 0.6 0.7 0.8 0.9 1.0
Experiment Present
Fig. 8 Thrust and figure of merit for UH-60A rotor blade
CT/σ CQ/σ(x10-3 )
0.020 0.04 0.06 0.08 0.1 0.12 0.14
2 4 6 8 10 12
Experiment Present
Working Range
Fig. 7 Thrust and power coefficient for UH-60A rotor blade
Fig. 5 4.3 11.0
. starting
vortex momentum
theory source sink
[8]. Starting vortex
.
Fig. 6 [2]
1.2 . 1
SC1094R8 twist
.
. Fig. 7
.
FLUENT [9]
.
Fig. 8 FM(Figure of Merit)
. ( : 0.006~0.01) 3%
FLUENT .
11.8
FM .
Table 1 (
=0.085)
FM 0.01 .
1.5% (pitch
angle= 4.3 degree) FM 5% .
Fig. 9
.
[8] .
tip vortex
r/R ΔCT/Δr
0.0 0.2 0.4 0.6 0.8 1.0
0 0.1 0.2 0.3 0.4 0.5 0.6 0.7 0.8
Present(5.7M Cells) S traw n[8 ](1 0.6 M Cells) S traw n[8 ](6 4.0M Cells) Ex periment
Fig 9. Sectional thrust distributions of UH-60A rotor blade (
=0.085)
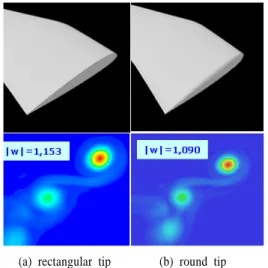
(a) rectangular tip (b) round tip
Fig. 10 Iso vorticity contour after 45 deg azimuth angle
Fig. 12 Iso-vorticity distributions of UH-60A rotor blade
r/R ΔCT/Δr
0.0 0.2 0.4 0.6 0.8 1.0
0 0.1 0.2 0.3 0.4 0.5 0.6 0.7 0.8
Present(Rectang ular Tip) Present(Ro und Tip) Ex periment
Fig. 11 Sectional thrust distributions of UH-60 rotor blade (
=0.085)
vortex . vortex
[8].
10.6M 64M
5.7M .
3.2 Tip
vortex
Fig. 10 round
.
tip vortex .
45 5% vortex
strength .
tip vortex .
Fig. 11
inboard tip vortex
. vortex core 0.95R
. .
3.3 Vortex Capturing
Fig. 12 iso-vorticity
vortex trajectory 360
. tip vortex
.
0.95R vortex core
. vortex core
[8]
.
[8] vortex core miss distance
0.2c miss
distance 0.21c .
0.4c vortex
CT/σ
FigureofMerit
0 .0 2 0 .0 4 0 .0 6 0 .0 8 0 .1 0 .1 2 0 .1 4 0 .0
0 .1 0 .2 0 .3 0 .4 0 .5 0 .6 0 .7 0 .8 0 .9 1 .0
E xp erim en t
P resen t(w ith co rrectio n )