INTRODUCTION
Chronic antibody-mediated rejection (CABMR) is an im- portant cause of late graft loss. CABMR is defined by the Banff classification as follows: (1) morphologic evidence of chronic tissue injury, (2) evidence of current or recent antibody interaction with the vascular endothelium, and (3)
serologic evidence of donor-specific antibodies (DSAs) to the human leukocyte antigen (HLA) or other antigens [1].
Since CABMR is known to be an extension of the acute antibody-mediated rejection that is not treated, pathologic findings are very important for the differentiation, diagno- sis, and prediction of prognosis [2,3]. Also, the presence of DSA during the diagnosis of CABMR is emphasized in
Clinical significance of de novo donor-specific antibody in kidney transplant recipients with chronic antibody-mediated rejection
Woo Yeong Park
1,2, Yaerim Kim
1,2, Jin Hyuk Paek
1,2, Kyubok Jin
1,2, Seungyeup Han
1,21Department of Internal Medicine, Keimyung University School of Medicine, Daegu, Korea
2Keimyung University Kidney Institute, Daegu, Korea
Background: Chronic antibody-mediated rejection (CABMR) is an important cause of late graft loss. De novo donor-specific antibody (dnDSA) is an important prognostic fac- tor for long-term allograft outcomes. However, the prognosis of CABMR based on the presence of dnDSA is uncertain.
Methods: We retrospectively analyzed 35 kidney transplant recipients with CABMR between 2010 and 2018. Fourteen recipients had no detectable DSA, and 21 recipients had detectable DSA. We investigated the pathologic findings at diagnosis of CABMR, al- lograft function 12 months later, related factors for allograft failure, and allograft survival rate based on the presence of dnDSA.
Results: The pathologic findings showed that acute and chronic changes were more se- vere in the dnDSA (+) group than in the dnDSA (–) group. There was no significant differ- ence in the allograft function 12 months after the diagnosis of CABMR and in the amount of proteinuria at diagnosis between the two groups. However, the death-censored graft survival rate was lower in the high-proteinuria group than in the low-proteinuria group in both groups. The treatment rate of recipients was higher in the dnDSA (+) group than in the dnDSA (–) group; however, there was no significant difference in the death-censored graft survival rate between the two groups.
Conclusions: Although the effect of dnDSA on the prognosis of CABMR is not clear, it would be important not to neglect treatment for CABMR with risk factors for allograft failure even without dnDSA. Continuous and rigorous surveillance of DSA and allograft function is needed in patients with CABMR.
Keywords: Kidney transplantation; Graft rejection; Antibodies; Risk factor; Treatment
Received October 27, 2020 Revised December 14, 2020 Accepted December 15, 2020 Corresponding author: Seungyeup Han Division of Nephrology, Department of Internal Medicine, Keimyung University Dongsan Hospital, Keimyung University School of Medicine and Keimyung University Kidney Institute, 1035 Dalgubeol-daero, Dalseo-gu, Daegu 42601, Korea
Tel: +82-53-258-7712 Fax: +82-53-258-4739 E-mail: [email protected]
© The Korean Society for Transplantation This is an Open Access article distributed under the terms of the Creative Commons Attribution Non-Commercial License (http://creativecommons.org/licenses/
by-nc/4.0/) which permits unrestricted non-commercial use, distribution, and reproduction in any medium, provided the original work is properly cited.
pISSN 2671-8790
eISSN 2671-8804
the Banff classification [4,5]. Recently, it has been reported that de novo DSA (dnDSA) is an independent risk factor for allograft failure [6]. However, the prognosis of CABMR based on the presence of dnDSA is uncertain. Therefore, we investigated the clinical outcomes of CABMR based on the presence of dnDSA.
METHODS Human and Animal Rights
We conducted this study in compliance with the principles of the Declaration of Helsinki. The study protocol was reviewed by the Institutional Review Board of Keimyung University Dongsan Medical Center, and they approved this study (IRB No. 2018-12-033). The Institutional Re- view Board waived the requirement for informed consent because the patients’ data were used retrospectively for research, except for important personal information, which the individual was identified by, and was explained to all the donors’ families and all recipients before kidney trans- plant (KT). Therefore, this study did not contain any identi- fiable personal information, except for the clinical process and outcome as a retrospective medical record study.
Study Design
We retrospectively analyzed 35 kidney transplant recipi- ents (KTRs) diagnosed with CABMR between 2010 and 2018. We excluded KTRs with positive crossmatching prior to KT, ABO-incompatible KT, and those whose data were insufficient. We divided the study population into two
groups as follows: 14 KTRs without and 21 KTRs with dnD- SA. We defined KTRs without dnDSA as KTRs with unde- tectable donor-specific anti-HLA antibodies and KTRs with dnDSA as KTRs with detectable donor-specific anti-HLA antibodies. We investigated the baseline characteristics of the study population, pathologic findings at the time of diagnosis of CABMR, change in allograft function before the diagnosis, and at 1, 3, 6, and 12 months after the diag- nosis, the amount of proteinuria at the time of diagnosis, response to treatment for CABMR, and allograft survival rate based on the presence of dnDSA.
Immunosuppression Protocols
We used basiliximab (20 mg on days 0 and 4, Simulect; No- vartis, Basel, Switzerland) for KTRs with low immunologic risk and anti-thymocyte globulin (thymoglobulin; Sanofi Genzyme, Cambridge, MA, USA; 1.5 mg/kg on day 0 and 1.0 mg/kg on days 1 through 3) for KTRs with high immuno- logic risk as immunosuppressants for induction treatment.
We used cyclosporine (3 mg/kg, twice a day; Sandimmun;
Novartis) or tacrolimus (0.05 mg/kg, twice a day, Prograf;
Astellas Pharma Inc., Toyama, Japan), prednisolone (30 mg, once a day), and mycophenolate mofetil (750 or 1,000 mg, twice a day, CellCept; Hoffmann-La Roche Inc., Nutley, NJ, USA) as immunosuppressants for maintenance ther- apy. The treatment protocol for CABMR was as follows:
high-dose intravenous immunoglobulin (IVIG; 2 g/kg) after a single dose of rituximab (375 mg/m
2) infusion, and treat- ment with (2–3 sessions) or without plasmapheresis ac- cording to the pathologic findings, allograft function, and willingness to undergo the therapy.
Demographic and Clinical Data
We investigated the age of donors and recipients at the time of CABMR diagnosis, sex of the donors and recip- ients, KT type, frequency of KT, dialysis type prior to KT, dialysis vintage, causes of end-stage renal disease, the number of HLA mismatches, immunosuppressants for in- duction and maintenance treatment, previous biopsy-prov- en acute rejection (BPAR), the amount of proteinuria at the time of diagnosis of CABMR, panel reactive antibody (PRA) class I or II >50%, positive DSA class I or II, mean fluores- cence index (MFI) value, and pathologic findings. Allograft protocol biopsies were performed at 12 months after KT, and indication biopsies were performed at the time of al- lograft dysfunction or if the KTR had persistent proteinuria.
All BPARs were the result of an indication biopsy in this study. Allograft biopsies were analyzed using the Banff HIGHLIGHTS
• We investigated the clinical outcomes of chronic anti- body-mediated rejection (CABMR) based on the pres- ence of de novo donor-specific antibody (dnDSA).
• Pathologic findings showed that acute and chronic change was more severe in the dnDSA (+) group than in the dnDSA (–) group.
• The treatment rate of recipients was higher in the dnD- SA (+) group than in the dnDSA (–) group, but, there was no difference of prognosis between the two groups.
• Continuous and rigorous surveillance of DSA and al-
lograft function is needed in patients with CABMR.
2017 classification, which defined CABMR as follows: (1) morphologic evidence of chronic tissue injury, (2) evidence of current/recent antibody interaction with the vascular endothelium, and (3) serologic evidence of DSAs to the HLA or other antigens [1]. Allograft function was measured as the estimated glomerular filtration rate (eGFR) based on the modification of diet in the renal disease (MDRD) formu- la before the diagnosis of CABMR, at the time of diagnosis of CABMR, and at 1, 3, 6, and 12 months after diagnosis or treatment. Proteinuria was measured using the spot urine
protein-creatinine ratio. We examined PRA screening and identification (class I and class II) before KT and annually after KT to evaluate KTRs with high immunological risks.
We defined KTRs with PRA >50% as high-risk immuno- logical patients. DSA was analyzed with a Luminex Single Antigen assay, using LABscreen Single Antigen HLA class I and class II (One Lambda, Canoga Park, CA, USA) accord- ing to the manufacturer’s manual prior to KT and at 1, 3, 6, and 12 months and annually after KT or at the time of diagnosis and monthly after the diagnosis or treatment
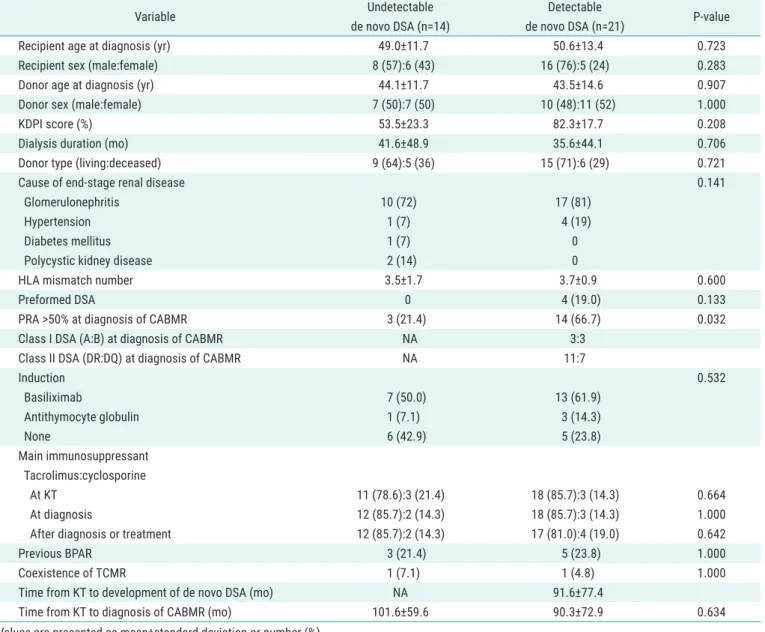
Table 1. Comparison of clinical and laboratory parameters based on detectable de novo DSA
Variable Undetectable
de novo DSA (n=14)
Detectable
de novo DSA (n=21) P-value
Recipient age at diagnosis (yr) 49.0±11.7 50.6±13.4 0.723
Recipient sex (male:female) 8 (57):6 (43) 16 (76):5 (24) 0.283
Donor age at diagnosis (yr) 44.1±11.7 43.5±14.6 0.907
Donor sex (male:female) 7 (50):7 (50) 10 (48):11 (52) 1.000
KDPI score (%) 53.5±23.3 82.3±17.7 0.208
Dialysis duration (mo) 41.6±48.9 35.6±44.1 0.706
Donor type (living:deceased) 9 (64):5 (36) 15 (71):6 (29) 0.721
Cause of end-stage renal disease 0.141
Glomerulonephritis 10 (72) 17 (81)
Hypertension 1 (7) 4 (19)
Diabetes mellitus 1 (7) 0
Polycystic kidney disease 2 (14) 0
HLA mismatch number 3.5±1.7 3.7±0.9 0.600
Preformed DSA 0 4 (19.0) 0.133
PRA >50% at diagnosis of CABMR 3 (21.4) 14 (66.7) 0.032
Class I DSA (A:B) at diagnosis of CABMR NA 3:3
Class II DSA (DR:DQ) at diagnosis of CABMR NA 11:7
Induction 0.532
Basiliximab 7 (50.0) 13 (61.9)
Antithymocyte globulin 1 (7.1) 3 (14.3)
None 6 (42.9) 5 (23.8)
Main immunosuppressant Tacrolimus:cyclosporine
At KT 11 (78.6):3 (21.4) 18 (85.7):3 (14.3) 0.664
At diagnosis 12 (85.7):2 (14.3) 18 (85.7):3 (14.3) 1.000
After diagnosis or treatment 12 (85.7):2 (14.3) 17 (81.0):4 (19.0) 0.642
Previous BPAR 3 (21.4) 5 (23.8) 1.000
Coexistence of TCMR 1 (7.1) 1 (4.8) 1.000
Time from KT to development of de novo DSA (mo) NA 91.6±77.4
Time from KT to diagnosis of CABMR (mo) 101.6±59.6 90.3±72.9 0.634
Values are presented as mean±standard deviation or number (%).
DSA, donor-specific antibody; KDPI, kidney donor profile index; HLA, human leukocyte antigen; PRA, panel reactive antibody; CABMR, chronic antibody-
mediated rejection; NA, not applicable; KT, kidney transplantation; BPAR, biopsy-proven acute rejection; TCMR, T-cell mediated rejection.
of CABMR. We defined DSA that existed before KT as preformed DSA, and when DSA occurred newly during the follow-up period after KT without preformed DSA or was different from preformed DSA was defined as dnDSA.
Statistical Analysis
Continuous variables were analyzed using the Mann–Whit- ney U-test, and categorical variables were analyzed by the chi-square or Fisher’s exact test. Graft and patient survival rates were evaluated using the Kaplan-Meier analysis with the log-rank test. Univariate and multivariate analyses with Cox regression analysis were performed to investigate the risk factors for allograft failure. P-values <0.05. were considered statistically significant. Statistical analysis was performed using SPSS ver. 18 (SPSS Inc., Chicago, IL, USA).
RESULTS
Baseline Characteristics of the Study Population
The mean age of KTRs at the time of diagnosis of CAB- MR was 50±13 years, and 24 patients (68.6%) were male.
Living donor KT occurred in 24 patients (68.6%), and 30 patients (85.7%) were the first KT recipients. All patients underwent hemodialysis before KT, and 21 patients (77.1%) had chronic glomerulonephritis as the primary renal disease. The main immunosuppressants used were tacrolimus (30, 85.7%) and cyclosporine (5, 14.3%). Eight patients (22.9%) experienced BPAR prior to the diagnosis of CABMR. Median proteinuria at the time of diagnosis of CABMR was 1.1 g (interquartile range [IQR], 0.3–2.8 g). The time from KT to the development of dnDSA was 91.6±77.4 months. The time until the diagnosis of CABMR after trans- plantation was 74.9 months (IQR, 42.8–142.6 months).
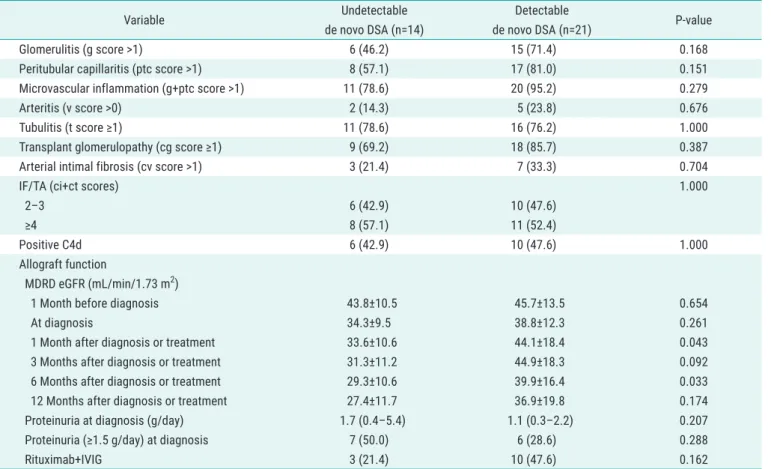
Table 2. Comparison of pathologic findings and clinical outcomes based on detectable de novo DSA
Variable Undetectable
de novo DSA (n=14)
Detectable
de novo DSA (n=21) P-value
Glomerulitis (g score >1) 6 (46.2) 15 (71.4) 0.168
Peritubular capillaritis (ptc score >1) 8 (57.1) 17 (81.0) 0.151
Microvascular inflammation (g+ptc score >1) 11 (78.6) 20 (95.2) 0.279
Arteritis (v score >0) 2 (14.3) 5 (23.8) 0.676
Tubulitis (t score ≥1) 11 (78.6) 16 (76.2) 1.000
Transplant glomerulopathy (cg score ≥1) 9 (69.2) 18 (85.7) 0.387
Arterial intimal fibrosis (cv score >1) 3 (21.4) 7 (33.3) 0.704
IF/TA (ci+ct scores) 1.000
2–3 6 (42.9) 10 (47.6)
≥4 8 (57.1) 11 (52.4)
Positive C4d 6 (42.9) 10 (47.6) 1.000
Allograft function
MDRD eGFR (mL/min/1.73 m
2)
1 Month before diagnosis 43.8±10.5 45.7±13.5 0.654
At diagnosis 34.3±9.5 38.8±12.3 0.261
1 Month after diagnosis or treatment 33.6±10.6 44.1±18.4 0.043
3 Months after diagnosis or treatment 31.3±11.2 44.9±18.3 0.092
6 Months after diagnosis or treatment 29.3±10.6 39.9±16.4 0.033
12 Months after diagnosis or treatment 27.4±11.7 36.9±19.8 0.174
Proteinuria at diagnosis (g/day) 1.7 (0.4–5.4) 1.1 (0.3–2.2) 0.207
Proteinuria (≥1.5 g/day) at diagnosis 7 (50.0) 6 (28.6) 0.288
Rituximab+IVIG 3 (21.4) 10 (47.6) 0.162
Values are presented as number (%), mean±standard deviation, or median (range).
DSA, donor-specific antibody; IF/TA, interstitial fibrosis/tubular atrophy; MDRD, modification of diet in the renal disease; eGFR, estimated glomerular
filtration rate; IVIG, intravenous immunoglobulin.
Comparison of the Clinical and Laboratory Parameters Based on the Presence of Detectable dnDSA
The mean follow-up duration was 129.0±72.7 months.
There were no significant differences in the mean age of donors and recipients, the proportion of sex distribution, KT type, Kidney Donor Profile Index score, KT number, duration of dialysis, dialysis type before KT, causes of end-stage renal disease, the number of HLA mismatches, induction and maintenance immunosuppressants, the rate of PRA >50%, and preformed DSA positivity, and the rate of previous BPAR between the dnDSA (–) and dnDSA (+) groups. There was one case (7.1%) of T-cell mediated rejection (TCMR) in the undetectable dnDSA group and one case (4.8%) of TCMR in the detectable dnDSA group.
There were no significant differences in the coexistence of TCMR between the two groups. The time from KT until the diagnosis of CABMR showed no significant difference between the two groups (Table 1).
Comparison of the Pathologic Findings of Allograft, Allograft Function, Proteinuria, and Treatment Options Based on Detectable dnDSA
Pathologic findings showed that acute changes such as glomerulitis, peritubular capillaritis, microvascular in- flammation, arteritis, and tubulitis were more severe in the dnDSA (+) group than in the dnDSA (–) group; how- ever, there was no significant difference between the two groups. Chronic changes such as transplant glomerulopa- thy, arterial intimal fibrosis, and interstitial fibrosis/tubular atrophy were also not significantly different between the
two groups. The proportion of C4d positivity was not sig- nificantly different between the two groups (Table 2).
There was no significant difference in the allograft function at 12 months after the diagnosis of CABMR and the difference in the amount of proteinuria at diagnosis between the dnDSA (–) and dnDSA (+) groups. The use of rituximab and IVIG treatment was higher in the dnDSA (+) group than in the dnDSA (–) group (Table 2).
Comparison of Death-Censored Allograft Survival and Risk Factors for Graft Failure Based on Detectable dnDSA Nine patients (25.7%) developed graft failure, including 5 (35.7%) patients in the dnDSA (–) group and 4 (19.0%) in the dnDSA (+) group. The causes of graft failure were as follows: chronic rejection, 4 (28.6%) and 3 (7.1%); infec- tion, 1 (7.1%) and 1 (4.8%) in the dnDSA (–) and dnDSA (+) groups, respectively. In the Kaplan-Meier analysis, there was no significant difference in the death-censored overall graft survival rate (Fig. 1A) and death-censored graft sur- vival rate after the diagnosis of CABMR (Fig. 1B) between the dnDSA (–) and dnDSA (+) groups. In the subgroup analysis, the death-censored graft survival rate was lower in the high-proteinuria group than in the low-proteinuria group in both the dnDSA (–) and dnDSA (+) groups (Fig.
2). However, there was no significant difference in the death-censored graft survival rate between the two groups, regardless of the treatment administered (Fig. 3). On mul- tivariate Cox regression analysis, deceased donor kidney transplantation and eGFR at 12 months after the diagnosis of CABMR were the risk factors associated with graft fail-
0 36 72 108 144 180 216 252 288
Cumulativesurvivalrate
Follow-up duration (mo) At KT
dnDSA ( ) dnDSA (+)
A B
14
21 20
13 12 11 10
14 14
21
10 10
20 19 19 18 17 17
Log-rank, P=0.502
dnDSA ( ) dnDSA (+)
0 36 48 60 72
Cumulativesurvivalrate
Follow-up duration (mo)
At diagnosisof CABMR
dnDSA ( ) dnDSA (+)
Log-rank, P=0.607
1.0 0.8 0.6 0.4 0.2
12 24
10 10
10 10
12 13 14
18 17
19 19
19 21 20
dnDSA ( ) dnDSA (+)
1.0 0.8 0.6 0.4 0.2
Fig. 1. Comparison of death-censored overall graft survival rate (A) and death-censored graft survival rate after diagnosis of chronic antibody-mediated
rejection (CABMR) (B) according to the presence of de novo donor-specific antibody (dnDSA).
ure in KT after adjusting for the significant variables in the univariate analysis (hazard ratio, 57.013; 95% confidence interval, 1.698–1,914.123, P=0.024; hazard ratio, 0.850;
95% confidence interval, 0.738–0.980, P=0.025) (Table 3).
Five patients (14.3%) died, including one (7.1%) patient in the dnDSA (–) group and 4 (19.0%) in the dnDSA (+) group. The causes of death were as follows: infection, 1 (7.1%) and 3 (14.3%); alveolar hemorrhage, 0 and 1 (4.8%) in the dnDSA (–) and dnDSA (+) groups, respectively. In the Kaplan-Meier analysis, patient survival rates showed no significant differences between the dnDSA (–) and dnDSA (+) groups (Table 3).
DISCUSSION
Our study found that the allograft outcome in the dnDSA (+) group was similar to that of the dnDSA (–) group. Both groups showed low graft and patient survival rates. Fur- thermore, the pathologic findings did not differ between the two groups. In particular, the Banff 2013 classification expressed negative DSA CABMR as suspicious CABMR [7];
however, in the Banff 2017 classification, the presence of DSA was imposed, and when there was no DSA, C4d was also supported for the diagnosis of CABMR [4]. However, our study showed that there was no significant difference in the allograft outcome between the C4d (+) and C4d (–)
Low proteinuria
A B
0 36 48 60 72
Cumulativesurvivalrate
Follow-up duration (mo) At diagnosis
of CABMR
Log-rank, P=0.069 1.0
0.8
0.6
0.4
0.2
12 24
High proteinuria
10
11 9 8 7
10 10 10 10 10 10
10 9 9
Low proteinuria
High proteinuria
Low proteinuria
0 36 48 60 72
Cumulativesurvivalrate
Follow-up duration (mo) At diagnosis
of CABMR
Log-rank, P=0.087 1.0
0.8
0.6
0.4
0.2
12 24
High
proteinuria 8 7 6 4
Low proteinuria
High proteinuria
6 6 6 6 6 6
6
Fig. 2. Comparison of death-censored graft survival rate between the high proteinuria and low proteinuria in the dnDSA (–) group (A) and dnDSA (+)
group (B). CABMR, chronic active antibody-mediated rejection; dnDSA, de novo donor-specific antibody.
0 36
Cumulativesurvivalrate
Follow-up duration (mo) dnDSA ( )+treatment ( )
dnDSA ( )+treatment (+) dnDSA (+)+treatment ( ) dnDSA (+)+treatment (+)
Log-rank, P=0.909
1.0
0.8
0.6
0.4
12 24
11 11 3 10
10 10 3 10
9 10 3 9
8 10 2 9
dnDSA ( )+treatment ( ) dnDSA ( )+treatment (+) dnDSA (+)+treatment ( ) dnDSA (+)+treatment (+)
Fig. 3. Comparison of death-censored graft