1. Introduction
1)
1) Research Backgrounds and Purpose
The economic performance of Korean immigrants in the U.S. has been very impressive (Yoon, 1996).
Korean Americans have demonstrated significant economic accomplishments despite their relatively short immigration history. The Average Family Income (AFI) of Korean Americans in 1990 is estimated to be $33,919, which is 91.3% of the
$37,152 earned by Caucasians in the U.S. This
* This article is the result of a collaborative study conducted by the Korean Ethnic Bank Research Project Team, which was funded by Korea Research Foundation (KRF-2003-072-BS204)
** Daegu University, Economics([email protected])
*** Korea Military Academy, American Studies
The Financial Development of Korean Americans:
A Comparison of Korean and Chinese American Banks in California*
Hyeon-Hyo Ahn**, Yun-Sun Chung***
미국에서의 한인 금융 캘리포니아에서 한국계와 중국계 은행의 비교: *
안현효 정연선**․ ***
요약 요약 요약
요약 본 논문은 캘리포니아의 중국계와 한국계의 양 소수민족은행을 비교하여 한국계 민족은행과 한국계 이민사회의:
경제적 관계를 해명하고자 한다 통상 미국 내 소수민족경제권의 경제적 성과 차이는 문화적 차이 또는 비공식금융의. 기여로 설명되는 경우가 많으나 우리는 공식금융제도의 적극적 역할에 주목하여 금융제도와 소수민족경제의 관련성을 강조한다 동시에 한국계 미국은행은 성장 수익성 은행전략 면에서 중국계 소수민족은행과 구분된다는 점을 중시하여. , , , 은행전략 측면에서 중국계와 한국계가 고객과의 장기적 거래를 중시하는 유사한 관계은행전략을 구사하지만 은행의, , 대출분포와 예금분포는 서로 다르다는 점을 지적하였다 이는 각 소수민족은행이 다른 경영성과를 낳는 이유가 된다. . 한국계은행의 경우 대출구조가 사업대출 중심이며 이자 낳지 않는 예금의 비중이 중국계 민족은행보다 상대적으로 높, 은 사실이 한국계 소수민족은행이 높은 성장을 하게 된 배경이다 따라서 관계은행전략이라는 개념만으로는 다수의 소. 수민족은행의 차이를 설명할 수 없으므로 본 연구는 한국계와 중국계의 이민사회 그 자체의 특수성에 주목하였다 중, . 국계 미국인의 경우 인구구성의 이질성과 해외자본의 영향이 한국계 미국인의 경우 동질적 인구 및 사업구성과 착 한, 국계 미국인 금융기관의 경쟁력이 특징적이다.
주요어 주요어 주요어
주요어 소수민족은행 한국계 미국은행 중국계 미국은행 관계은행: , , , Abstract
Abstract Abstract
Abstract By comparing to Chinese American banks, this research shows the uniqueness of Korean American: banks. This article argues that instead of the cultural attributes and/or informal financial institutions, formal financial institutions, such as the ethnic banks studied here, are responsible for the business success of Asians abroad. However, ethnic banks have different development trajectories depending on their respective ethnic communities. Korean American banks are notably different from Chinese American banks in terms of growth, profitability, and banking strategies. Although both ethnic banks exercise relationship banking strategies in their loan portfolios, their deposit compositions are very different and cause significant differences in financial performance. The focus on business loans and high rates of non-interest deposits allow for higher growth rates in Korean American banks. Therefore, relationship banking does not adequately explain the differences of ethnic banks. This research attempts to understand the underlying factors in choosing banking strategies by mainly focusing on the unique examples found in Korean and Chinese immigrant societies. For Chinese Americans, the heterogeneity of their population composition and foreign influence dominate their bank structures. On the other hand, Korean American homogeneity and business orientation are distinctly different. The influence of Korean capital is not significant when compared to overseas Chinese capital.
Key Words Ethnic banking, Korean Americans, Chinese Americans, Relationship banking:
value far exceeds the AFIs achieved by Hispanic and African-Americans, which are 68% and 60%
of the earnings of Caucasians, respectively.
Asian-American owned businesses have also experienced significant growth. As of 1997, Asian and Pacific Islander (API) owned businesses numbered 912,960 nationwide (4.4% of all businesses in U.S.). Among minority-owned businesses, APIs are behind Hispanics (almost 1.2 million), but ahead of African Americans (823,499) and Native Americans (197,300), despite the fact that the API population is less than one-third of African Americans and Hispanics.
Among APIs, Korean owned businesses have higher average sales and receipts ($339,000) when compared to all three minority groups (Native Americans - $174,000, Hispanics - $ 155,000, and African Americans - $86,000).
Moreover, Asian-Americans also have higher rates of entrepreneurship: 105.6 Asian owned companies for every 1,000 Asian adults, nearly twice the rate of Hispanics and more than three times the rate of African Americans (1997 Economic Census http://www.census.gov/epcd/mwb97/
us/us.html).
While there has been much research on Korean immigrants in the US in the fields of history, sociology, and anthropology, a notable absence is found in the field of economics. Even the existing studies on economic performance have focused mainly on case studies confined to one or two areas. A handful of research on economic performance, mostly done since the 1992 Los Angeles riots (Abelmann and Lie, 1995;
Chang, 1990), have focused on small businesses owned by Korean Americans (Park, 1997; Light and Bonacich, 1998; Min, 1995, 1996). These studies have not paid significant attention to the relations between the Korean American economy and their financial institutions. We have done some research to fill this gap (Ahn and Hong, 2001; Ahn, 2003). This research continues our
previous efforts to uncover the relations between ethnic economies and their financial institutions, mainly by the comparison of Korean American banks and Chinese American banks.
Business success of Asians abroad is often explained by certain cultural attributes and/or informal lending circles (such as Hui in Chinese and Kye in Korean) that have traditionally been prevalent within Asian American communities (Geertz, 1956; Light, 1972; Light and Bonacich, 1988; Light and Gold, 2000). However, such preconceived notions belie today's reality of Chinese and Korean American ethnic banks.
Recently, research was collected showing the development of Latino, African American, and Asian ethnic banks (Li and Dymski, 2002; Li, Yu, Dymski and Chee, 2001). These reports indicated that each ethno-banking sector is indeed unique; i.e. their development trajectories are time-dependent and path-specific. These researchers also indicate that Chinese banks are primary conduits for savings. This allows for credit flows that provide Chinese ethnic banks an opportunity to play an entrepreneurial role.
However Li, Yu, Dymski and Chee (2001) and Ahn (2003) were able to explain neither the uniqueness of Korean American banks, nor the cause of the differences between Korean and Chinese banks in California. This research attempts to clear up the cause of the differences between Korean and Chinese banks. The purpose of this article is to understand the uniqueness of Korean and Chinese ethnic banking strategies by diving deeper into more detail in the differences between Korean and Chinese American societies. This also can clarify the close relation of formal financial institutions (Korean American banks) and Korean American businesses.
Section 2 shows the differences between
Korean and Chinese American banks using
statistical index. Section 3 analyses the different
strategies of these two groups and the causes of their differences. Section 4 summarizes the implications of our research in understanding the relations between financial institutions and the economic performance of the same ethnic groups.
2) Research Area and Data
To understand the uniqueness of ethnic banks of two ethnic groups in California, this research adopts the area of L. A. County which can represent the situation of California. Figure 1 shows the geographical distribution of those ethnic banks in L.A. county area. Theses maps indicate that Korean American banks are mainly concentrated in Korea Town in L.A. while Chinese American banks are scattered around L.A County focusing on San Gabriel Valley region, east of L. A. This reflects the population movement of Korean and Chinese immigrants
too.
In this research we use two kinds of data.
The first one is formal reports, called “Call Report” which is supposed to be submitted to FDIC (Federal Deposit Insurance Corporation) every quarter. These reports have the information such as establishment date, number of branches, number of employees, the location of headquarter and types of business. They also show the assets size, loan and deposit portfolio. Using this data, we can get the trends of these ethnic banks because this information has been accumulated since the establishment dates of these banks.
The information, however, does not define the ethnicity of those banks. Therefore we needed to identify the ethnicity of those banks with the help of Korean and Chinese bankers. The definition can be obtained by the two criteria of ownership and client base. For this research we interviewed 10 Korean bankers in the U.S from
Figure 1. The Geographical Distribution of 8 Korean American Banks and 22 Chinese American Banks in L. A. County in 1999 (headquarters and bank branches)
July 17th, 2004 to August 13th, 2004. The interview provided the useful qualitative information to understand the dynamics of Korean and Chinese ethnic banks. For the Chinese banks, Dr. Wei Li, our partner of ethnic banking research team, helped us get the list of Chinese banks using her interview.
2. The Development of Korean American Banks
A Comparison with Chinese American Banks Korean banks, like Chinese banks, can be categorized as ethnic community banks. Ethnic banks are defined as U.S. chartered commercial banks and savings and loans which are owned, controlled, and managed by members of U.S.
ethnic minority groups, and whose market orientation is to service primarily the specific needs of ethnic businesses and residents. They are ethnic banks because they focus on a particular ethnic population as their primary clients. In addition, they are owned and operated mainly by the same ethnic groups. They are community banks because their size is relatively smaller than those of the usual mega banks that have many branches nationwide.
1) Comparison of Korean and Chinese American Banks
According to our field research, California has 11 (of which 8 are active as of 2004) of the total of 19 Korean American banks (of which 15 are active as of 2004) in the US. The total number of branches in the US is 119, of which 80 branches are concentrated in California. On the other hand, the estimated number of Chinese banks in California is 31 (of which 22 are active as of 2004).
The concentration rate of Korean ethnic bank branches in California (67% as of 1997, Economic Census Data) is much higher than that of the Korean population in California (32.1% as of 2000, Census Data, U.S. Census bureau). This means that the Korean financial institutions in California have experienced much more development compared to those in other areas.
The growth of Korean American banks in California has indeed been substantial. While the average size of assets held by Korean ethnic banks was less than that of Chinese ethnic banks until 2004, the two numbers are now similar. In 2002, Korean bank assets totaled $650 million and Chinese banks $880 million.
Currently, Korean banks hold $1.08 billion, a value that is not significantly different from that of Chinese ethnic banks.
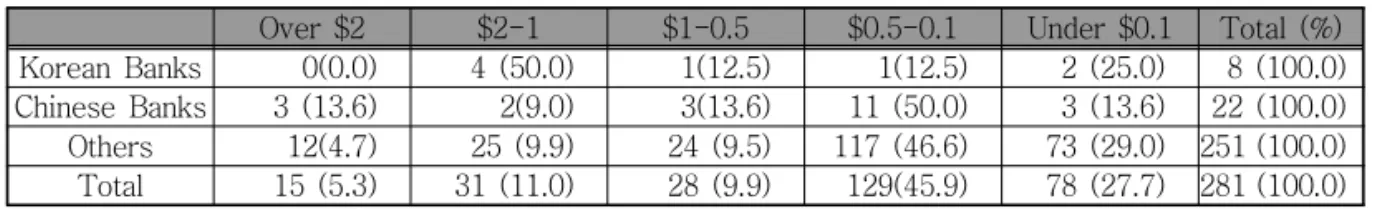
1)Table 1 and Table 2 summarize the size of assets between the two groups. Chinese banks have wider variations in terms of asset size, even though some Chinese banks are much
Over $2 $2-1 $1-0.5 $0.5-0.1 Under $0.1 Total (%)
Korean Banks 0(0.0) 4 (50.0) 1(12.5) 1(12.5) 2 (25.0) 8 (100.0) Chinese Banks 3 (13.6) 2(9.0) 3(13.6) 11 (50.0) 3 (13.6) 22 (100.0) Others 12(4.7) 25 (9.9) 24 (9.5) 117 (46.6) 73 (29.0) 251 (100.0) Total 15 (5.3) 31 (11.0) 28 (9.9) 129(45.9) 78 (27.7) 281 (100.0) (units: number, billion dollars)
1) As of December 2003.
2) As of May 2004, Pacific Union Bank (previous California Korea Bank) merged with Hanmi Bank, which gave Hanmi Bank (a Korean American bank) assets of over $3 billion. This was not reflected in this list as the merger was not approved at the time of the research.
Source: FDIC (www.fdic.gov)
Table 1. Average Asset Size of Korean and Chinese Ethnic Banks and Other Banks in California
larger than Korean banks. The standard deviation of Chinese banks' assets is $846 million, while Korean banks tally to $298 million. This suggests that Korean banks are more homogeneous in terms of their assets size.
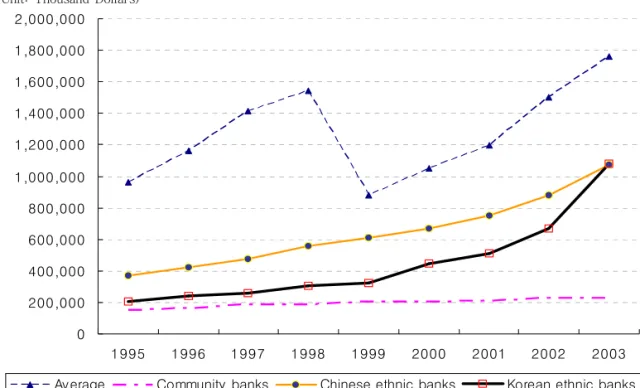
Figure 2 shows the change in size of Korean and Chinese banks, including the average asset sizes in California. The average assets of community banks are calculated from the data of banks assets sized under $0.1 billion.
2)Korean American banks show surprising growth and performance. Figure 3 exhibits the managerial success of Korean American banks in terms of profitability. The ROE (Return of Equity) of Korean banks is higher than that of Chinese
banks for eight straight years.
2) Explanations on the Causes of Differences in Terms of Bank Management
By investigating the differences in the management strategies between Korean and Chinese American banks, we can partly understand the causes of the relative success of Korean ethnic banks.
The first notable difference in banking management stems from the loan portfolios among banks. There are three kinds of loans that banks make, largely causing the differences in the performance of banks. First is the
1995 1999~ 2000 2003~ Average over 1995 2003~Chinese Banks 586 1,709 846
Korean Banks 201 482 298
(unit: million dollars)
Source: Recalculated from call reports from the FDIC (www.fdic.gov)
Table 2. Standard Deviation of Assets Between Two Groups of Banks
Source: Recalculated from the FDIC (www.fdic.gov)
Figure 2. Change of Assets of Banks in California (1995~2003) 0
200,000 400,000 600,000 800,000 1,000,000 1,200,000 1,400,000 1,600,000 1,800,000 2,000,000
1995 1996 1997 1998 1999 2000 2001 2002 2003
Average Community banks Chinese ethnic banks Korean ethnic banks (Unit: Thousand Dollars)
business loan, including commercial and industrial loans (C&I loans) and commercial real
estate loans (among several real estate loans).
Mortgage loans are second, and are represented
(Unit: Thousand Dollars)Source: Recalculated from FDIC reports (www.fdic.gov)
Figure 3. Return of Equity (ROE) of Banks in California (1995~2003)
Source: Recalculated from FDIC reports (www.fdic.gov)
Figure 4. Ratio of Business Loans of Banks in California (1995~2003) 0
2 4 6 8 10 12 14 16 18
1995 1996 1997 1998 1999 2000 2001 2002 2003
Average Community banks Chinese ethnic banks Korean ethnic banks
20 30 40 50 60 70 80 90
1995 1996 1997 1998 1999 2000 2001 2002 2003
Av erage Community banks Chinese ethnic banks Korean ethnic banks (Unit:: %)
by one or multi-family real estate loans.
Consumer loans account for the last type. In analyzing the data, the ratio of business loans in Korean banks are much higher than Chinese banks. Korean banks also surpassed business loans by other community banks in general.
Business loans are a double edged sword: they usually have higher returns but they also have higher default risks, which make banks reluctant to actively provide business loans. This comes from the asymmetry of information between lenders and borrowers, which results in the low-level average ratio of business loans of all banks in California (30% as of 2003). However, as shown in Figure 4, Korean American banks concentrated most of their loans in business loans, which resulted in higher rates of returns.
This suggests that regardless of expected default risks, the real default rate of Korean Americans were much lower than expectations.
Korean banks also have higher performance because they have higher ratios of non-interest bearing deposits among total deposits. Non- interest bearing deposits are composed of
checking deposits which must be withdrawn at the depositor’s convenience. Customers of Korean banks may need these deposits since many Korean Americans are small business owners who have a daily base for income and spending.
This high ratio is consistent with the high concentration of small businesses among Korean Americans. Figure 5 shows that the ratio for Korean banks is much higher than that of Chinese banks, and even higher than the aggregate average for all banks in California.
Ahn (2003) argued that owing to the short history of Korean banking development, the future of Korean banks is not certain. In addition, it was argued that Korean banks may follow the trajectory of Chinese banks as time goes on. However, the above data shows that the tendency of growth in Korean American banks has remained consistent for the past 8 years. Therefore, we need to investigate the differences between Korean and Chinese American banks rather than the common elements. We need to see where these two factors, which makes the higher performance of
Source: Recalculated from FDIC reports (www.fdic.gov)
Figure 5. Ratio of Non-Interest Bearing Deposits Among Total Deposits in California (1995~2003) 0
5 1 0 1 5 2 0 2 5 3 0 3 5 4 0
1 9 9 5 1 9 9 6 1 9 9 7 1 9 9 8 1 9 9 9 2 0 0 0 2 0 0 1 2 0 0 2 2 0 0 3 Av erage Co mmunity banks Chinese ethnic banks Ko rean ethnic banks (Unit:: %)
Korean American banks possible, comes from.
We hypothesize that the character of the
"relationship banking" strategy in Korean and Chinese banks plays an important role.
3. Development of Korean American Banks and Korean American
Ethnic Economy
1) Relationship Banking
The first Chinese American bank was Cathay Bank (1962), while the first Korean American bank was California Korea Bank (1974, changed to Pacific Union Bank, later bought by Hanmi in 2004). Chinese banks have developed largely based on the long history of Chinese immigration and the large immigrant population scattered across the country.
The success of small ethnic banks can be explained by three reasons, composed of both push and pull factors. One is related to the need of Asian immigrants. Non-ethnic banks became uninterested in providing the credit required for minority businesses. This happened due to the change of banking strategy in the U.S. from the relationship-over-time, to fee-based transactions (Dymski and Veitch, 1996; Dymski, 1999).
Secondly, the limited success of informal financial institutions may have contributed to the rise of small ethnic banks. Marginalization of financial institutions caused the development of informal or fringe finance services such as check cashing stores, pawnshops, money-order services, and loan brokers (Caskey, 1994a; b). However, informal or fringe fee-based transactions have no time deposit accounts and no channel for building up funds from small savers. Thirdly, due to these two factors, small ethnic banks were able to fill niche markets more successfully.
3)For these reasons, the market orientation of ethnic banks is quite different from
that of mainstream banks in the U.S.
The strategy of niche banks, such as Korean American, Chinese American, and other ethnic minority banks, is to specialize in a certain customer types. This is kind of niche banking strategy is called “relationship banking”.
Relationship banking involves business practices that depend on sustained links and information exchanges between bankers and their customers.
4)Relationship banking strategy in the management of financial institutions provides an informational monopoly over the firm (Rajan, 1992; Petersen and Rajan, 1994). Therefore it guarantees monopolistic rents or information rents (Aoki and Dinc, 1997). On the other hand, businesses can have an opportunity for an access to capital (Petersen and Rajan, 1994).
First and foremost, Chinese and Korean American banks have clear missions of serving communities, including Asian-American communities of immigrants and later generations for all their business ventures. Chinese and Korean American bankers acknowledge the importance of relationships between banks and community development, and believe their banks play vital roles in a local community's economic growth and social wellbeing. The majority of our interviewees stressed the importance of relationship banking in their strategies. Chinese and Korean American bankers consider that key difference between their banks and larger mainstream ones lies mainly in their familiarity with their customers. They build strong rapport and trust relationships with their customers.
They have regular face-to-face meetings and
continuous close contact, both in and out of the
office. In terms of market orientations, both
Chinese and Korean American banks rely heavily
on their ethnic depositors, which make up to
80% and 70% of their patrons, respectively. As
for loan borrowers and portfolios, however,
Chinese American banks are more diverse when
compared to Korean American banks. 70% of loan borrowers are fellow Koreans, and are heavily geared towards business loans (Ahn and Hong 1999; Li, Zhou, Dymski and Chee, 2001).
Considering the differing performances of the two groups of banks under the same strategy of relationship banking, relationship banking itself should be analyzed. In order to understand the differences between these ethnic banks, it is necessary to go further into the ethnic societies and their relations with ethnic banks.
5)2) Heterogeneity and Foreign Influence - The Uniqueness of Chinese Americans When focusing on the differences of two ethnic banks, previous research had problems with their models of leaders (Chinese banks) and followers (Korean banks). Diverse loan portfolios of banks are understood as showing the aggressive and active role of Chinese banks in project financing. Korean banks were seen as more passive, following the trends of business
based off the Korean population. (Dymski, Wei and Zhou, 1998). According to a recent analysis of Korean American banks in California (Figure 6), these banks became very active in providing loans for fellow Korean businesses. In 2003, the ratio of loans from total deposits was approximately 90% in Korean ethnic banks, and 85% in Chinese ethnic banks. Other models besides the leader-follower model need to be analyzed, especially the social capital model.
Three factors are suggested to explain the difference of Chinese immigrants' social networks in terms of population aspects and economic aspects.
First, there is a large difference in the immigration history and immigrant population between Korean and Chinese Americans. The ratio is 1 : 2.4 (one million Korean vs. 2.4 million Chinese). While massive Korean immigration began in the 1960s, Chinese immigration has over 100 years of history.
Chinese immigration also has very diverse original backgrounds: 35 countries, including
Source: Recalculated from FDIC reports (www.fdic.gov)
Figure 6. The Ratio of Loan-Deposit of Banks in California (1995~2003) 40
50 60 70 80 90 100
1995 1996 1997 1998 1999 2000 2001 2002 2003
Av erage Community banks Chinese ethnic banks Koean ethinc banks (Unit:: %)
mainland China (31.3%), Taiwan (29.7%), Indochina such as Vietnam, Cambodia, and Laos (18.5%), Hong Kong, (10.6%) and as well as 29 other countries (10%) (Li, 1999). This heterogeneity of the Chinese population is closely related to the heterogeneity of the Chinese ethnic economy caused by the diversity of Chinese immigration. For example, immigrants from Taiwan are mainly businessmen who move directly to the San Gabriel Valley (SGV) area in California. On the other hand, Vietnamese Chinese are usually working in a trade, while Chinese immigrants from mainland China or Hong Kong work as laborers.
A second factor resulting in the uniqueness of Chinese ethnic banks is the foreign influence of overseas Chinese capital. Political factors such as the restoration of China-US diplomatic relations (1970s), the end of the Vietnam War (1975), and the return of Hong Kong to China (1997) all resulted in changes in Chinese immigration patterns. It has also increased the amount of capital new immigrants have come with.
Therefore, Chinese immigration has also involved overseas Chinese capital inflows. This can be inferred from the higher ratio of interest bearing deposits in Chinese American banks when compared to other banks. Another fact showing this trend is the ownership of Chinese banks.
Among the 31 Chinese banks located in California, only a handful of banks including Cathay Bank, East West Bank, and Trust Bank are owned by local Chinese Americans. The overwhelming majority are owned by Chinese overseas (Chee, Dymski, Li, 2003). Table 3 shows the ownership structure of Chinese banks in one of the cities in San Gabriel Valley, cities
with a strong concentration of Chinese Americans in California.
A third factor in the uniqueness of Chinese immigrants is the business composition of Chinese Americans. Chinese banks began their businesses ten years earlier than Korean banks, which reflects the differences of immigration between the two ethnic groups. Before WWII, Chinese immigration was mainly comprised of laborers. Since the 1970s, students from Taiwan and wealthier families from various countries began their immigration. According to census data, from 1980 to 2000, the Chinese population in Los Angeles County rose from 41,000 to 329,000, an eightfold increase. During the same period, L.A. experienced an economic boom. This caused a real estate bubble, and Chinese immigration to move directly to San Gabriel Valley, not to the usual Chinatown in L.A.
(Fong, 1994). In response to this, Chinese American banks did not limit themselves to only providing business loans to small Chinese businessmen. They also played an active role in providing real estate loans for Chinese Americans as well as other ethnic groups (Smith, 1995). The higher proportion of real estate loans found in Chinese banks reflects the uniqueness of the socioeconomic formation of Chinese Americans. Inflows of overseas Chinese financial capital might have been pursued as a safer investment, which likely caused the inflow to banks first and finally moved into real estate investment in the U.S.
Real estate was the preference for overseas Chinese capital. However, there are other contributing factors worth noting when examining this preference. The portion of FIRE
Origin of Capital Hong Kong Indonesia Japan Old timer Taiwan Vietnam TotalNumber of Banks 0 4 1 3 6 0 14
Source: Chee, Dymski and Li (2003)
Table 3. Ownership of Chinese Banks in City of Monterey Park in California
(Finance, Insurance and Real Estate Industries) among Chinese businesses in the U.S. is 11% by business numbers and 4% by sales amount (Economic Census of the United States, 1997) and is relatively higher than those of Korean Americans (3%, 1% respectively). On the other hand, the portion of wholesale trade is 9 % by business numbers and 50% by sales, indicating that the Chinese ethnic economy has close relations with their country of origin. This also explains how Chinese banks are highly specialized in trade finance.
These three factors mentioned above illustrate the uniqueness of Chinese social networks, which also influences the uniqueness of Chinese banking management. The change and evolution of the Chinese ethnic enclave called 'Chinatown' also shows this character of local level globalization, coined by the capital inflow from overseas Chinese capital and immigration. The evolution of the ethnic enclave Chinatown to ethno-burb is found in California (Li, 1997;
1999). An ethno-burb is mainly composed of Chinese, but it is not an exclusively Chinese residential area. Ethno-burbs are multi-ethnic residential areas dominated by Chinese American populations. This area fuses the inwardness of Chinese ethnicity as well as the outwardness of their new surroundings, owing to the mixture of ethnic groups, which matches well for localized globalization of Chinese ethnic economy. The typical example of this localized globalization is San Gabriel Valley, a suburban area of eastern Los Angeles. With the exception of a Hispanic
middle, the eastern and western parts of San Gabriel are heavily populated by Chinese Ethno-burbs. Typical enclave cities are the City of Monterey Park (West SGV), often called the
"Chinese Beverly Hills", Diamond Bar, Hacienda Heights, Rowland Heights, and Walnut (East SGV). In the 1980s, the City of Monterey Park also became known as a Chinese ethno-burb since its population was 30.8% Chinese. Additionally, Monterey Park had a 56.5% concentration of Chinese businesses in SGV (Li, 2000).
3) The Unique Homogeneity and Business Orientation of Korean Americans
Contradictory to previous understandings (Ahn and Hong, 1999) in the differences between Korean and Chinese American banking strategies, Table 4 shows how both Korean banks and Chinese banks have followed the movement of the same ethnic populations. This pattern denies the notion which suggests that Chinese banks are active and that they are leaders of ethnic population movements and that Korean banks are passive and followers of the Korean immigration movement.
The difference lies in the socioeconomic formation of two ethnic groups. Although the average size of Korean American banks are similar to that of Chinese American banks, the largest Korean American bank is half the size of the largest Chinese American bank. In addition, as mentioned prior, the banking strategy is different since Korean American banks mainly
Year Ethnic
Population
Ethnic Business
No. of ethnic bank
No. of Ethnic Branch
Overall Pop per bank branch
overall business per bank branch
Chinese American 329,352 40,352 27 128 2,573 315
Korean American 186,350 21,777 8 62 3,006 351
Source: U.S. Census Bureau (Population and Economic Censuses), FDIC, Chinese and Korean Yellow Pages, various years; and Pollard 1996
Table 4. Population and Bank Branches of Korean and Chinese Americans in Los Angeles County in California State (1990)
cater to the business loans needs of aspiring small business owners. Though many Korean Americans in Los Angeles have moved to SGV and the San Fernando Valley area, Korean banks in this area have not expanded their business lines to include real estate loans. However, this different strategy does not reflect the active/
passive characteristics of Korean American banks. Rather, it reflects the uniqueness of the Korean American ethnic economy.
The first difference of Korean American ethnic society from that of Chinese Americans is that Korean ethnic networks are homogeneous.
This can be summarized in three parts. First, Koreans have the same origins in terms of race, language, and culture. Second, their immigration has common religious connections - Christianity.
Third, Korean American ethnic economies employ over 75% of fellow Koreans inside their ethnic enclaves, which makes the economy have a strong and unique national character (Min, eds.
1995, p.227). These factors have created a solid bond inside the ethnic population as well as a strong anti-alien character against other ethnic populations. The same factors also have led to a homogeneous managerial character and business pattern in Korean American banks.
The second major difference has to do with the economy of the Korean ethnic group. Rather than real estate businesses, Korean businesses
are more concentrated in manufacturing and trade. The business patterns of Korean American businesses focusing on retail trade (such as liquor stores and manufacturing,) resulted in a business loan orientation of Korean American banks (See Figure 3). According to 1997 Economic Census data, the portion of retail trade of all Korean American businesses in the US is 32% in terms of number and 37% in terms of sales amount. The development and unique management of Korean American banks have close relation with the development and uniqueness of Korean businesses in California.
Table 5 shows the close connection between Korean businesses and Korean American banks.
As Korean American businesses engaged in larger retail trade, (liquor, food, & clothe stores, gas stations, dry cleaning stores, garment manufacturing industries, etc.,) the average business loan amount also increased from approximately $150~200 thousand to over $500 thousand (Hanmi Bank, 2003).
Another indication of the close relationship Korean American banks have with Korean businesses is the Small Business Administration (SBA) Loan Program. For example, Hanmi Bank began SBA loans in 1988. Since then, it has been very popular with Korean small business owners. One-third of all SBA loans in L.A. were provided by Korean ethnic banks for Korean
Year 70 80 90 2000
Population 8,811 103,891 n.a. 345,882
No. of Businesses 69('72) 588('79), 4,266('82) 8,848('85) 43,465('97)
Establishment of new Korean American banks
CKBin 1974 (merged into
Hanmi bank in 2004)
Wilshire State Banks in 1980 Global Savings in 1981 (merged into Hanmi Bank in 1998)
Hanmi Bank in 1982 California Center Bank in 1986
Nara Bank in 1989
Shaehan Bank in 1991 Aisana Bank in 1999
(merged into Nara Bank in 2003)
Unity Bank in 2001 Mirae Bank in
2002 Pacific City Bank in 2003 Number of new
bank branches 0 2 16 23 cf. 38 in
2004 Source: Korean Yellow Pages, Census Data, Hanmi Bank Annual Reports
Table 5. Increases in Korean Population, Businesses, and Korean American Banks in California since the 1970s
small business owners. This program provided the critical catalyst for many Korean entrepreneurs and contributed largely to the development of Korean businesses in California.
Korean American banks utilized this opportunity as a well found niche, as mega bank ignored the demands of small business owners by just focusing project financing deals in real estate development.
The SBA loan program is special loan program for small and medium sized businesses with less than 500 employees. Its special structure demands less collateral and regulation, allowing for flexible loan terms when compared to other loans. The amounts range from $50 thousand up to $ 2 million dollars. Banks do not have high risks as SBA guarantees the redemption for most of the amounts borrowed.
This loan also has a long period, typically 7 to 30 years. Bank can provide this loan flexibly by acquiring Preferred Lender Provider (PLP) licenses.
Recently, according to bank interviews, capital inflows from South Korea, largely increased.
Discounting a short period for the 1997 financial crisis, the rapid growth of the South Korean economy seems to have risen in tandem with greater capital inflow to California. As a caveat, this information cannot be proven easily by bank statistics. There is no category showing this trend in the quarterly call reports that banks are supposed to submit to their supervisory institution, the FDIC. However, an indicator implying this trend can be seen through the analysis of more detailed loan portfolios among business loans, consumer loans, and real estate loans. By dividing real estate loans into commercial and residential loans, measures of the influence of capital inflow from Korea can be hypothesized.
Figure 7 shows the rapid increase of commercial real estate loans since 1995, except for the 1997 crisis period in the South Korean economy. However we need to see
Figure 7. Proportion of Loans Provided by Korean American Banks (1995~2003)
that the change in mortgage loans has not been greater than approximately 10% of total loan amounts. Therefore the influence of overseas Korean capital is limited. Reason being, most Korean American banks are owned by local Korean American immigrants, not by foreign Korean capital. Furthermore the Pacific Union Banks (previously owned by Korean capital) merger into Hanmi Bank shows that local immigrant capital is more competitive than larger overseas South Korean.
We can conclude that the influence of overseas Korean financial capital is not larger than the influence of overseas Chinese financial capital. It is true that the influence of the country of origin - South Korea – is very important. Relatively, however, the influence is not exceedingly high when compared to the influence of China on Chinese American banks.
Based on the uniqueness of local Korean ethnic economies rather than overseas Korean capital, the growth of Korean American banks goes well with the development of the same ethnic economy
4. Conclusion
Despite some similarities that Korean ethnic banks share with Chinese ethnic banks, this study shows that the differences between the two are still significant. The common elements they share include high growth rates, dense information networks, and commonly shared ethnic practices that have helped the development these ethnic banks.
However, once closely examined, there are significant differences between Korean and Chinese banks in America. We have researched the characteristics of Korean and Chinese ethnic economies under the assumption that the character of the social networks yields wide
influence. The environment ethnic banks are embedded into can be a critical factor in determining the business strategies and managerial performance of those banks. The difference of these banking strategies cannot be simplified into a bank managerial difference, i.e. active and passive roles or the leader and follower model.
Instead, by investigating the respective ethnic networks, we see that the two ethnic groups are different in terms of their homogeneity and foreign capital influence.
These differences in the social networks of the two ethnic groups are the main causes that determine the differences in banking strategy and success among Korean and Chinese ethnic banks in America.
Acknowledgement
Our team members were allowed to conduct face-to-face interviews with several Korean American banks headquartered in the United States in 2004. We would like to thank several bankers for their willingness to discuss the situations of Korean banks in the U.S. They include: Mr. Won-Ho Chung (ex-President and CEO of Asiana Bank, Sunneyvale, CA), Mr.
Young-Gu Choi (ex-CFO of Hanmi Bank, CA), Hi-Dong Kim, (President, Liberty Bank, NY), Chang-Yul Lee (President, First Inter Continental Bank, GA), Benjamin Hong (President, Nara Bank, CA), Jae-Wahn Yoo, (President, Hanmi Bank, CA), Hyun-Jang Chang (President, Pacific City Bank, CA), William Im (Unity Bank, CA), Un-Hak Bak (President, Mirae Bank, CA), and Ju-Hak Kim, (President, Saehan Bank, CA). All have been exceedingly helpful and considerate.
This research was also possible through the
information acquired with their assistance, bank
related information such as call reports, annual
reports, FDIC documents, and census data.
註
1) For the full lists of Korean and Chinese American banks, see end note 1 and 2. Dr. Wei Lee, co-researcher of the ethnic banking project team in the U.S, assisted greatly to accurately report the number of Chinese banks. and call reports, available at the FDIC(www.fdic.go), were used to calculate banks statistics used in our research 2) Total number of banks in California was 286 in
200 and 281 in 2003. Community bank with assets under $ 100 million were 242 as of 2002 and 235 as of 2003. Date from 2003 was used in this report. We call banks with assets over $ 2 billion mega bank in this paper.
3) It is doubtable that every small bank survived successfully under these situations. On one hand, wealthier retail customers were lost to larger banks with better offers. On the other hand, lower-income customers were lost to non-bank financial institutions.
4) Aokian Dinc (1997) define relationship banking (or relational financing) somewhat differently. They say that relational financing is a type of financing in which the financier is expected to make additional financing in a class of un-contractible states in the expectation of future rents over time.
The Japanese main bank system has been regarded as a typical example of relaionship banking (Aokian Patric 1994). In contrast to this,
"arm's length banking" means that financial contracts are conducted at an arm's length between buyers and sellers. Through close and continued interaction, a firm may provide a lender with sufficient information about the firm's affairs so as to lower their costs and increase the availability of credit. This interaction is called relationship banking (Petersenan Rajan, 1994 : 5).
5) This can be theorized by the term “social capital”.
Capital here does not only mean the physical assets, such as machinery, but also social relations. The common element of financial capital, physical capital, and human capital is social relations. Social capital is different from other kinds of capital in the sense that this capital is the social relation with the networks of information, norms, and disciplinary mechanisms of people (Colema 1988; Putna 1993). The banking strategy of Korean and Chinese ethnic banks is rooted in co-ethnic social capital (Li, Zhou, Dymskian Che, 2001).
References
Abelmann, Nancy, and John Lie., 1995, Blue Dreams: Korean Americans and the Los Angeles Riots. Cambridge: Harvard University Press.
Ahn, Hyeon-Hyo, 2003, The Development of Koran American Banks in the context of Ethnic Banking in Southern California, Journal of American Studies, (Korea), 35(1), 111-138.
Ahn, Hyeon-Hyo, and Jang-Pyo Hong., 2001, The Evolution of Korean ethnic banks in California, Journal of Regional Studies (Korea), 7(2), 97-120.
Aoki Massahiko and Serdar Dinc., 1997, Relational Financing as an Institution and its Viability under Competition, mimeo, Center for Economic Policy Research, Stanford University.
Aoki, Massahiko and Hugh Patrick., 1994, Japanese Main Bank System, Oxford, U.K.:Oxford University Press.
Caskey, John P., 1994a, Bank representation in low-income and minority communities, Urban Affairs Quarterly. 29, 617-638.
Caskey, John P., 1994b, Fringe Banking: Checking- Cashing Outlets, Pawnshops and the Poor.
New York, NY: Russell Sage Foundation.
Chang, Edward Tea., 1990, New Urban Crisis:
Korean Black Conflicts in Los Angeles. Ph. D.
Diss., University of California, Berkeley.
Chee, M., G, Dymski and W. Li., 2003, Asia in Los Angeles: Ethnic Chinese Banking in the Age of Globalization, unpublished article.
CKB, 1997, Annual Report, California Korea Bank.
Coleman, J., 1988, Social Capital in the creation of human capital, American Journal of Sociology 94, 95-120.
Dymski, Gary, and John Veitch, 1996, Financial Transformation and the Metropolis: Booms, Busts, and Banking in Los Angeles, Environment and Planning A, 28(7) July, 1233-1260.
Dymski, Gary, Wei Li and Yu Zhou, 1998,
Ethnobanks and Ethnoburbs in Los Angeles
County: A Framework and Initial Empirical
Findings. Paper presented at the Annual Meeting of the Association of American Geographers, Boston, MA.
Dymski, Gary., 1999, The Bank Merger Wave:
The Economic Causes and Social Consequences of Financial Consolidation. Armonk, NY: M.E.
Sharpe.
FDIC, 2004, www.fdic.gov, Federal Deposit Insurance Corporation, Washington, DC.
Fong, T., 1994, The First Suburban Chinatown:
the remaking of Monterey Park, California, Temple University Press, Philadelphia, PA.
Geertz, C., 1956, The Rotating Credit Association:
An Instrument for Development. Massachusetts Institute of Technology, Center for International Studies, Cambridge.
Hanmi Bank., 2003, Hanmi Bank 20 Years. 2003 Li, Wei, Yu Zhou, Gary Dymski, and Maria Chee., 2001, Banking on Social Capital in the Era of Globalization Chinese ethnobanks in Los Angeles, Environment and Planning A, 33(4), 1923-1948.
Li, Wei., 1999, Building Ethnoburbia: The Emergence and Manifestation of the Chinese Ethnoburb in Los Angeles San Gabriel Valley, Journal of Asian American Studies. 2(1), 1-28.
Li, Wei., 1997, Spatial Transformation of an Urban Ethnic Community From Chinatown to Chinese Ethnoburb in Los Angeles, Unpublished doctoral dissertation, University of Southern California, Los Angeles, CA.
Li, Wei, Gary Dysmki., 2002, Globally Connected and Locally Embedded Financial Institutions:
Analyzing the ethnic Chinese banking sector.
In Eric Fong ed., Chinese Ethnic Economy:
Global and Local Perspectives, Philadelphia, PA: Temple University Press.
Light, I. H., 1972, Ethnic enterprise in America:
Business and welfare among Chinese, Japanese, and Blacks. Berkeley, CA: University of California Press.
Light, Ivan and Steven J. Gold., 2000, Ethnic Economies, San Diego, CA: Academic Press.
Light, Ivan and Edna Bonacich., 1988, Immigrant Entrepreneurs: Koreans in Los Angeles 1965- 1982, University of California Press.
Min, Pyong Gap. ed., 1995, Korean Americans, In Asian Americans: Contemporary Trends and Issues, Sage Publications, Inc.
Min, Pyong Gap., 1996, Caught in the Middle:
Korean Communities in New York and Los Angeles, University of California Press.
Park, K., 1997, The Korean American Dream, Cornell University Press.
Peterson and Rajan, R., 1994, The Benefits of Lending Relationships: Evidence from Small Business Data, Journal of Finance, 49(1), 3-37.
Putnam, R. D., 1993, Making Democracy Work:
Civic Tradition in Modern Italy, Princeton, NJ: Princeton University Press.
Rajan R., 1992, Insiders and Outsiders: The Choice between informed and Arm's-Length Debt, Journal of Finance, 47(4), 1367-1400.
Smith, C.J., 1995, Asian New York: The Geography and Politics of diversity, The International Migration Review, New York: vol. 29 Yoon, In-Jin, 1996, On My Own: Korean
Businesses and Race Relations in America, Chicago, IL: University of Chicago Press.
접수 채택
( : 2005. 10. 13, : 2005. 12. 10)
교신
• :안현효(712-714,경북 경산시 진량읍 내리리15번 지 [email protected] Phone) 053-850-4147, Cellular) 016-9234-6251, Fax) 053-850-4141
Correspondence Ahn Hyeon-Hyo(15 Naeri,: Jinryang, Gyongsan, Gyoungbuk, 712-714 Korea, harryahn @daegu.
ac.kr, Phone: 82-53-850-4147, Cellular: 82- 16-9234- 6251, Fax: 82-53-850-4141
Korean American
Banks HQ
No of branches
99.6.30
No of branches
04.8.12
Assets
99.6.30 Assets 04.6.30
No of Employees
04.3.31 Establishment Pacific Union
Bank* Los Angeles 10 n/a 593.8 n/a n/a Sep-74
Wilshire State
Bank Los Angeles 5 12 300.5 1,202.5 223 Dec-80
Hanmi Bank Los Angeles 10 27 739.7 1,756.6 363 Dec-82
Center Bank Los Angeles 4 15 361.7 1185.9 251 Mar-86
California
ChoHung Bank* Los Angeles 1 n/a 89.3 n/a n/a Oct-88
Nara Bank Los Angeles 6 18 358.9 1395.2 340 Jun-89
Saehan Bank Los Angeles 2 7 121.5 306.5 106 Jun-91
Asiana Bank* Sunnyvale 1 n/a 19.6 n/a n/a Feb-99
Unity Bank Buena Park n/a 2 n/a 102.7 25 Dec-01
Mirae Bank Los Angeles n/a 2 n/a 90.2 30 Aug-02
Pacific City Bank Los Angeles n/a 1 n/a 85.1 22 Sep-03
1) Pacific Union Bank* was merged into Hanmi Bank on May 1, 2004.
2) California ChoHung Bank* was merged into CHB America Bank on March 24, 2003.
3) Asiana Bank* was merged into Nara Bank on August 25,2003.
Source : FDIC (www.fdic.gov)
End note 1. Korean American Banks in California
(unit: number, million dollars)
Chinese American
Banks HQ No of
branches 99.6.30
No of branches
04.8.12
Assets 99.6.30
Assets 04.6.30
No of employees
04.3.31
Establishment Bank of Canton
of California San Francisco 2 n/a 910.4 n/a n/a May-37
Universal Bank West Covina 7 7 359.5 407.6 95 Nov-54**
Cathay Bank Los Angeles 10 38 1,995.5 5,762.4 815 Apr-62
Chinatrust
Bank (U.S.A.) Torrance 7 17 1,305.9 1,863.8 299 Apr-65
East West Bank Los Angeles 20 41 2,150.3 4,896.8 732 Jun-72 International
Bank of California Los Angeles 6 7 131.2 186.4 79 Apr-73
Far East
National Bank Los Angeles 7 15 856.4 1,684.0 339 Dec-74
Guaranty Bank
of Calif. Los Angeles 3 4 106.6 143.7 58 Nov-76
Trust Bank, f.s.b. Monterey Park 3 3 185.6 229.0 47 Jan-77
First Global Bank Los Angeles n/a n/a n/a n/a n/a Jan-78
American Int'l Bank Los Angeles 8 n/a 198.8 n/a n/a Jul-78
Omni Bank Alhambra 4 6 189.7 210.0 67 Feb-80
General Bank Los Angeles 9 n/a 1,738.5 n/a n/a Mar-80
United Pacific Bank City of Industry 2 2 151.9 84.2 24 May-82 Los Angeles
National Bank Buena Park 2 4 142.3 197.7 44 Dec-82
Golden Security Bank Alhambra 1 1 90.3 135.5 22 Dec-82
Grand National Bank Alhambra 2 n/a 142.5 n/a n/a Feb-83
United National Bank San Marino 6 11 486.0 891.8 155 Jun-83
Pacific Business Bank Santa Fe Springs 7 n/a 176.9 n/a n/a Apr-84 Eastern
Int'l Bank Los Angeles 2 2 73.5 86.7 28 Feb-85
Standard Bank Monterey Park 6 6 701.1 984.9 92 Jun-85
First Central Bank Cerritos N/a n/a n/a n/a n/a Jan-86
United Commercial Bank San Francisco 6 39 2,282.8 6,057.0 718 Mar-86
Lippo Bank San Francisco 1 n/a 21.1 n/a n/a Nov-89
Asian Pacific
National Bank San Gabriel 2 2 39.7 51.5 16 Jul-90
First Continental Bank Rosemead 3 n/a 270.6 n/a n/a Mar-91
First United Bank San Diego 1 3 75.1 156.1 25 May-91
Preferred Bank Los Angeles 6 9 496.6 849.1 110 Dec-91
Evertrust Bank City of Industry 2 3 114.3 61.1 43 May-95
First Commercial
Bank (USA) Alhambra 2 4 129.3 300.1 60 May-97
InterBusinessBank Los Angeles n/a 3 n/a 178.2 44 Sep-00
1) Pacific Business and Universal Bank became Chinese American bank in 1994 and 1980 respectively.
2) Bank of Canton of California was merged into First Republic Bank on May 29, 2002.
3) First Global Bank was merged into Hanmi Bank on October 1, 1998.
4) American Int'l Bank was merged into East West Bank on January 14, 2000.
5) General Bank was merged into Cathay Bank on October 20, 2003.
6) Pacific Business Bank was merged into East West Bank on March 15, 2003.
7) First Central Bank was merged into East West Bank on May 29, 1999.
8) Lippo Bank was merged into First Bank of California on May 30, 2000.
9) First Continental Bank was merged into United Commercial Bank on July 22, 2003.
Source: FDIC (www.fdic.gov)
End note 2. Chinese American Banks in California
(units: number, million dollars)