ARTICLE
Received: June 12, 2018 Revised: June 22, 2018 Accepted: June 24, 2018
*Corresponding author : Younghoon Kim
Dept. of Animal Science and Institute of Milk Genomics, Chonbuk National University, Jeonju, Korea.
Tel : +82-63-270-2606 Fax : +82-63-270-2612 E-mail : [email protected]
Copyright © 2018 Korean Society of Milk Science and Biotechnology.
This is an Open Access article distributed under the terms of the Creative Commons Attribution Non-Commercial License (http://
creativecommons.org/ licenses/by-nc/3.0) which permits unrestricted non-commercial use, distribution, and reproduction in any medium, provided the original work is properly cited.
ORCID Sangnam Oh 0000-0002-2428-412X Younghoon Kim 0000-0001-6769-0657
Determination of Microbial Diversity in Gouda Cheese via Pyrosequencing Analysis
Sangnam Oh 1 and Younghoon Kim 2*
1
Dept. of Functional Food and Biotechnology, Jeonju University, Jeonju, Korea
2
Dept. of Animal Science and Institute of Milk Genomics, Chonbuk National University, Jeonju, Korea
Abstract
The present study aimed to investigate the microbial diversity in Gouda cheese within the four months of ripening, via next-generation sequencing (NGS). Lactococcus (96.03%), and Leuconostoc (3.83%), used as starter cultures, constituted the majority of bacteria upon 454 pyrosequencing based on 16S rDNA sequences. However, no drastic differences were observed among other populations between the center and the surface portions of Gouda cheese during ripening. Although the proportion of subdominant species was <1%, slight differences in bacterial populations were observed in both the center and the surface portions. Taken together, our results suggest that environmental and processing variables of cheese manufacturing including pasteurization, starter, ripening conditions are im- portant factors influencing the bacterial diversity in cheese and they can be used to alter nutrient profiles and metabolism and the flavor during ripening.
Keywords
Gouda-style cheese, cheese microbiota, pyrosequencing, ripening
Introduction
In recent, several challenges have highlighted the possible effect of the cheese production environment and the influence of technological factors of cheese manu- facturing (Johnson, 2017). The typical characteristics of cheese are strongly associated with the composition, dynamics and interactions of the cheese microbiota (Yeluri Jonnala et al., 2018). Especially, the use of milk for cheese making is undesirable owing to public health issues, and the presence of undesirable microbiota population which may cause defects in flavor and texture of cheese (Quigley et al., 2013).
Generally, microbiological broths or agars that selectively support the growth of the target microbial population used for identifying bacterial analysis. These approaches are usually low‐tech and inexpensive but are relatively labor intensive and time‐
consuming. More recently, considerable efforts have been made to develop more rapid,
high‐throughput tests that rely on genetic analysis. Especially, polymerase chain
reaction (PCR) technology can be used to verify the results generated through traditional
tests, but their ability to serve as an alternative to culture‐based analysis is increasingly
being appreciated. Among them, next-generation sequencing (NGS) methodologies
provide an excellent tool to study microbial community and composition shifts, allowing
the detection of minor bacterial populations. In recent years, metagenomic analysis has
proved to be highly beneficial for studying the microbial community and changes in
its composition during cheese manufacturing and ripening (Escobar-Zepeda et al.,
2016). Our groups reported recently on the feasibility of generating sequenced meta- genomes to study the dynamics of microbial communities in Camembert cheese (Oh et al., 2017). However, little is known about the microbial dynamics during other hard cheese processing including Gouda-style cheese.
In the present study, we prepared Gouda-style cheese and we evaluated the bacterial populations of cheese microbiota for 4 months of ripening. Our results indicated that the diversity of cheese bacterial communities are important factors for safety and quality of Gouda-style cheese.
Materials and Methods
1. Gouda-style cheese making and sampling
Raw milk was obtained local dairy farm (Holstein, Jeollabuk-do, Korea) Gouda-style cheese was produced at a commercial dairy factory according to the following procedure: low temperature/long time (LTLT) pasteurized (63℃, 30 min) milk was poured into a stainless steel cheese vat. After reaching the optimal temperature, mesophilic starter culture (FD-DVS; Chr. Hansen., Copenhagen, Denmark) including Lactococcus lactis subsp. cremoris, L. lactis subsp. diacetylactis, L. lactis subsp. lactis, and Leuconostoc mesenteroides subsp. cremoris) were inoculated into the pasteurized milk. After 45∼50 min, rennet (Chr. Hansen) was added to milk sample. After coa- gulation and draining, the curds were put into plastic moulds and pressed with same weight for overnight. The fresh cheese was brined in a 20% (w/w) brine solution. After raining-off from the brine and drying, the cheese was ripened at 12∼14℃ for 4 months with a relative humidity of 85∼90%.
2. DNA extraction and emulsion-based PCR (emPCR)
The extraction method for bacterial DNA was performed by using a ZR Fungal/Bacterial DNA MiniPrep kit (Zymo Research, Irvine, CA). Library was prepared using PCR products according to the GS FLX plus library prep guide. Libraries were quantified using Picogreen assay (Victor3). The emPCR, corresponding to clonal amplification of the purified library, was carried out using the GS-FLX plus emPCR Kit (454 Life Sciences). Briefly, libraries were immobilized onto DNA capture beads. The library- beads obtained were added to a mixture of amplification mix and oil and vigorously shaken on a Tissue Lyser II (Qiagen) to create “micro-reactors” containing both amplification mix and a single bead. Emulsion was dispensed into a 96-well plate and the PCR amplification program was run according to the manufacturer's recommendations. 20 ng aliquot of each sample DNS was used for a 50 μL PCR reaction. The 16S universal primers 27F (5’-GAGTTTGATCMTGGCTCAG-3’) and 800R (5’-TACCAGGGTATCTAATCC-3’) were used for amplifying of 16s rRNA genes. FastStart High Fidelity PCR System (Roche Applied Science, Mannheim, Germany) was used for PCR under the following conditions: 94℃ for 3 min followed by 35 cycles of 94℃ for 15 s; 55℃ for 45 s and 72℃ for 1 min; and a final elongation step at 72℃ for 8 min.
After the PCR reaction, we purified the products using AMPure beads (Beckman Coulter
Inc., Atlanta, GA).
3. Next generation sequencing using Roche 454 GS-FLX plus
Following PCR amplification, the emulsion was chemically broken and the beads carrying the amplified DNA library were recovered and washed by filtration. Positive beads were purified using the biotinylated primer A (complementary to adaptor A), which binds to streptavidin-coated magnetic beads. The DNA library beads were then separated from the magnetic beads by melting the double-stranded amplification products, leaving a population of bead-bound single-stranded template DNA fragments.
The sequencing primer was then annealed to the amplified single-stranded DNA. Lastly, beads carrying amplified single-stranded DNA were counted with a Particle Counter (Beckman Coulter Inc.). Sequencing was performed on a Genome Sequencer FLX plus (454 Life Sciences), and each sample was loaded in 1 region of a 70∼75 mm PicoTiter plate (454 Life Sciences) fitted with a 8-lane gasket.
By BLAST, all the sequence reads were compared to Silva rRNA database. Sequence reads which has the similar sequence with less than 0.01 E-value were admitted as partial 16S rRNA sequence. Non-16S rRNA sequence reads were less than 1%.
Taxonomic assignment of the sequenced read was carried out using NCBI Taxonomy Databases. From database, the five most similar sequences for each sequence read were found by their bit scores and E-value from BLAST program. The taxonomy of the sequence with the highest similarity was assigned to the sequence read. By the similarity, we assigned the taxonomy down to these taxonomical hierarchies; species with more than 97% similarity, genus 94%, family 90%, order 85%, class 80%, and phylum 75%. Moreover, CD-HIT-OTU software was used for clustering. Mothur software was used for analyzing microbial communities and Shannon-Weaver diversity index and Simpson index were used for species diversity.
Results and Discussion
1. Characteristics of bacterial diversity in Gouda-style cheese
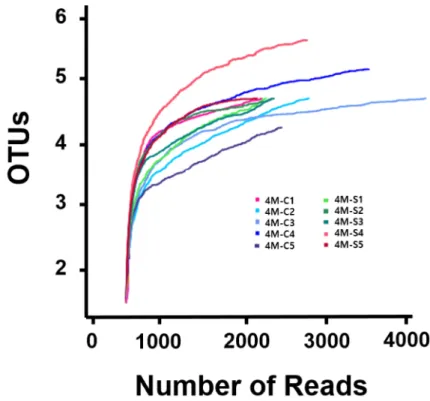
A total of 27,240 bacterial reads were obtained from separate 5 Gouda-style cheese.
Each Cheddar cheese sample was covered by an average of 2,724 reads, and the average number of operating taxonomic unit (OTUs) was 8.2. We found that the subsampled sequences sufficiently represented the microbial communities with an average Good’s coverage of 97.5±1.3% from all samples. This indicates that the sequencing process identified most of the bacterial species present in the cheese samples. The statistical bacterial diversities for each sample were calculated, and the alpha diversity parameters are presented in Table 1 and Fig. 1.
Based on diversity from Shannon and Simpson estimators that reflects the evenness of
the distribution of bacterial species in a sample, indicating that a different number of
species was present in center portion than that in surface portion. The results for the
alpha diversity of Gouda-style indicated that the microbial community in center portions
showed higher diversity compared with that in the surface portion of Gouda-style cheese.
Table 1. Number of sequences, operating taxonomic units (OTUs), and diversity estimates of bacteria in Gouda-style cheese at the ripening of 4 month
Read counts
1)OTUs
2)Shannon Simpson Goods coverage
Center-1 2,099 5 0.212039 0.916974 1
Center-2 2,825 5 0.134168 0.952046 1
Center-3 4,632 4 0.131848 0.952933 1
Center-4 3,753 6 0.212127 0.916077 0.99
Center-5 2,400 4 0.152015 0.942961 1
Surface-1 2,167 4 0.183783 0.929949 0.99
Surface-2 2,257 5 0.198948 0.924238 1
Surface-3 2,289 5 0.19682 0.922873 0.99
Surface-4 2,797 5 0.248519 0.900981 1
Surface-5 2,021 5 0.31485 0.861922 1
1)
Read counts, the total number of sequence reads.
2)