Secondary Aerosol Pollution by a Home Insecticide under Ozone Exposure
Thai Phuong Vu
1 ),2 )· Sun-Hwa Kim
1 )· Seung-Bok Lee
1 )· Shang-Gyoo Shim
1 )Gwi-Nam Bae
1 ),2 )*· Jong Ryeul Sohn
3 )1)
Center for Environment, Health and Welfare Research, Korea Institute of Science and Technology, Seoul, Korea
2)
Construction Environment Engineering, University of Science and Technology, Daejeon, Korea
3)
Department of Environmental Health, Korea University, Seoul, Korea
Abstract
Secondary air pollution can be caused by aerosol formation through reactions of ozone and volatile organic compounds (VOCs) emitted from household products used in the indoor environment. In this study, we investigated the potential for aerosol production during the reactions of ozone and VOCs emitted from a home insecticide, a popular commercial product extracted from natural ingredients, in a 1-m
3reaction chamber. The major chemical component of the test product was prallethrin, which has very high efficacy of mosquito and housefly elimination. Toluene, α -pinene, cymene, d -limonene, α -terpinene, and α -thujone were also identified as constituents of the insecticide. Injected ozone concentrations of 50, 100, and 200 ppb generated particle mass concentrations, corrected for wall loss and air exchange loss, of 7.3, 33.1, and 40.0 μ g/m
3, respectively, after a 4-h reaction time. These concentrations are lower than those generated by an air freshener in a previous study under the same experimental conditions. It was concluded that the home insecticide tested had the potential to initiate secondary aerosol formation under ozone exposure due to the biogenic VOCs it contained.
Keywords : home insecticide, ozone, volatile organic compound, secondary air pollution, nanoparticle
* Corresponding author. Tel: +82-2-958-5676, E-mail: [email protected]
1. Introduction
Diseases associated with mosquitoes affect millions of people worldwide every year. Some mosquitoes transmit diseases such as malaria, yellow fever, and various other infections to hu- mans and animals. The global malaria program of the World Health Organization (WHO) has helped more than 100 countries to prevent ma- laria (WHO, 2010). Many localities and houses have established mosquito control and pre- vention programs employing methods ranging from simple to complex, such as the use of mosquito nets and the application of chemical and biological insecticides. To protect human health and the environment and to minimize other risks, insecticide labels are required to identify their active chemicals and to provide guidance for safe usage. Normally, people are not required to relocate when they use in- secticides in their homes to eliminate or prevent mosquitoes. However, no insecticide is com- pletely safe and care must be exercised in the use of such products because of their potential toxicity (Casida, 1980; Zaim et al., 2000;
Schummer et al., 2010).
Domestic insecticides are applied using spray- ers and electrically heated evaporators. Natural or synthetic pyrethroid insecticides are com- monly used against mosquitoes, houseflies, and cockroaches (Lines, 1996; Sirak-Wizeman et al.,
2008; Mongkalangoon et al., 2009). In addition to the pyrethroids used for insect minimization or elimination, such as prallethrin, geraniol, per- methrin, and deltamethrin, domestic insecticides also incorporate volatile organic compounds (VOCs), which are associated with fragrances to ensure comfortable conditions after their application. Most of these fragrant home in- secticides are extracted from natural ingredients.
The fragrances are mostly VOCs, which can re- act strongly with ozone to produce secondary aerosols. Previous studies reported that VOCs, particularly terpenes, emitted from air fresheners react with ozone to form secondary aerosols (Nazaroff and Weschler, 2004; Singer et al., 2006; Coleman et al., 2008; Vu et al., 2011b).
Thus, the contribution of secondary aerosols produced from the reaction of ozone with VOCs can contribute to indoor air pollution, together with other outdoor and indoor primary sources.
This contribution might explain the findings of previous studies that organic content accounts for 5 40% of the total mass of indoor particles – (Odum et al., 1996; Hoffmann et al., 1997;
Sheehan and Bowman, 2001).
The secondary particle concentration increases with ozone concentration under the same con- centrations of VOCs (Vu et al., 2011a, 2011b).
Concentrations and the chemical composition of
VOCs also affect secondary aerosol formation
(Odum et al., 1996; Cocker, 2001). Evaporation
of VOCs from household products mostly de- pends on temperature and the surface area to which they are applied. Nearly 100% of methyl benzoate, an ingredient used in perfumes, was reported to evaporate after 55 min (Aggarwal et al., 1997), and the evaporation of fragrances in gel-type air fresheners occurred readily at temper- atures <100°C (Aggarwal et al., 1998). Normally, common organic pollutants are two to five times higher inside homes than outside (US.
EPA, 2012). Indoor VOC concentrations are
<50 µg/m
3, with average levels <10 µg/m
3in Europe and North America (Wolkoff and Nielsen, 2001). In addition, outdoor back- ground-level ozone concentrations are affected by the time of day and season, with peak con- centrations on hot and sunny days. A large pro- portion (30 70%) of indoor ozone is derived – from the outdoor ozone source (Weschler, 2000). The United States National Ambient Air Quality Standard set an 8-h average outdoor ozone concentration limit of 75 ppb. The WHO guideline value is 50 ppb, which implies that the indoor ozone concentration should be <35 ppb. Secondary aerosol formation, however, can occur at low VOC and ozone concentrations (Liu et al., 2004; Langer et al., 2008).
In this work, we investigated the potential for secondary aerosol formation during the reactions of ozone and VOCs emitted from a commercial household insecticide in a 1-m
3reaction
chamber. The effects of three levels of injected ozone concentration (50, 100, and 200 ppb) were observed. The particle number size dis- tribution was continuously monitored. The con- sumed ozone was compared with the amount of secondary aerosol formed during the test period.
2. Experimental methods
2.1 Identification of VOCs in a test specimen
A commercial liquid-type insecticide, mar-
keted for home use, was chosen as a test
product. This product contained prallethrin, a
chemical widely used to kill mosquitoes, with a
content of 1.33 g/100 mL product. The prod-
uct’s labeled constituents were naturally ex-
tracted ingredients, such as orange and pine
oils. According to the label, the product con-
tained sufficient active ingredient for about 45
days of use (10 h/day use time). A headspace
test using a solid-phase microextraction (SPME)
method was performed to identify VOCs emit-
ted from the insecticide. SPME is a very sim-
ple, efficient, and solventless sample preparation
method with sensitive detection limits (Vas and
Vekey, 2004). VOCs emitted from 20 μ L in -
secticide contained in a glass vial were ad-
sorbed on an SPME fiber (carboxen/poly-
dimethylsiloxane, 75- m thickness; Supelco, μ
USA) for 1 h at 25°C and analyzed by gas chromatography/mass spectrometry (GC/MS;
Model 6890N; Agilent Technologies, USA). A 30-m fused silica capillary column (HP-5MS, 0.25-mm internal diameter, 0.25- m film thick μ - ness; Agilent Technologies) was used to sepa- rate the target analytes. The initial GC oven temperature was set at 40°C for 2 min, and then programmed to increase to 100°C at 10°C/min intervals and from 100°C to 250°C at 5°C/min intervals. The MS was operated in full-scan mode from 35 to 350 m/z at a 0.5-s scan interval.
2.2 Ozone reaction experiment
The experimental system consisted of a re- action chamber, ozone and pure air generators, a heater to control temperature, and monitoring instruments for ozone, particle, temperature and relative humidity. The cube-shaped reaction
chamber was made of 2-mil (~51- m) Teflon μ fluorinated ethylene propylene film and had a volume of 1 m
3. The surface-to-volume ratio was 6.0 m
-1. The chamber was installed in an indoor wooden box equipped with a door to avoid any light disturbance from the outside (Fig. 1). A pure air generation system (Model 737-15;
Aadco Instruments, USA) was used to supply pure air into the reaction chamber (Bae et al., 2003). The confirmed concentrations of O
3, NO, NO
2, NO
x, and SO
2impurities in the pure air were <1 ppb. GC/MS analysis of pure air de- tected no limonene, α -pinene, β -pinene, or terpinene.
Prior to each experiment, the chamber was flushed twice with pure air, and then with ozone (200 ppb) under ultraviolet (UV) irradi- ation for 4 h to minimize the effects of bag contamination. Thereafter, background particle and ozone concentrations of the air-filled cham- ber were measured for 4 h, resulting in a final ozone concentration <1.5 ppb and particle mass concentration <0.02 μ g/m
3.
A 1.0-mL liquid test specimen of the house-
hold insecticide was contained in a 50-mL glass
Petri dish with a diameter of 65 mm, and was
then placed in the bottom of the 1-m
3chamber
filled with pure air. The chamber was main-
tained at a temperature of 20 ± 1°C and a rela-
tive humidity <20%. Ozone injection into the
center of the chamber through the top surface
Fig. 1. Schematic of the experimental setup.
using a photometric O
3calibrator (API 401; A Teledyne Technologies Company, USA) com- menced at 4 min after the test specimen was set. The ozone calibrator was operated at three different concentrations (50, 100, and 200 ppb) at a flow rate of 4.0 L/min. Each experiment lasted for approximately 4 h.
A Teflon sampling line was connected to an O
3analyzer with a flow rate of 1.5 L/min. A stainless-steel sampling line was connected to a wide-range particle spectrometer (WPS; 1000XP;
MSP Corporation, USA) with a flow rate of 1.1 L/min. The total sampling flow rate for mon- itoring concentrations of particles and ozone in the chamber was controlled to be similar to the flow rate of ozone injected into the chamber us- ing mass flow controllers. The control of inflow and outflow produced an approximate air ex- change rate of 0.24 h
-1.
During the experiments, the ozone concen- tration was monitored once per minute using a UV photometric O
3analyzer (TEI 49i; Thermo Electron Corporation, USA) with an O
3lower detection limit of 1.0 ppb. The analyzer was calibrated with 700-ppb span gas. The particle number size distribution was determined using the WPS over a scanning time of 153.6 s. The aerosol and sheath flows in the electrostatic classifier were set to 0.3 and 3.0 L/min, re- spectively, to detect particles ranging from 10
to 10,000 nm in diameter. The particle mass concentration was calculated from the particle number size distribution obtained from the WPS data, with an assumption of a 1-g/cm
3unit density. The air temperature and relative humid- ity in the Teflon chamber were monitored every 5 min using a small sensor with a data logger (SK-L200Th; Sato Keiryoki Mfg. Co., Ltd., Japan). This data logger was placed in the bot- tom of the chamber and had a lower detection limit for relative humidity of 20%.
3. Results and Discussion
3.1 VOCs emitted from a home insecticide
The major chemical ingredient of the test
product was prallethrin. This product is applied
in the home using an electrically heated
evaporator. According to the product guidelines,
it has an effective mosquito prevention or elimi-
nation area of 7.29 12.96 m –
2. The product con-
tains a large number of VOCs (Fig. 2). Toluene
is well known for its human toxicity. Other
VOCs present include -pinene, cymene, α d-limo-
nene, -terpinene, and -thujone. Some of these α α
VOCs, such as α -pinene and d-limonene, react
readily with ozone to form secondary aerosols
(Grosjean et al., 1993; Hoffmann et al., 1997;
Jang and Kamens, 1999; Fan et al., 2003; Liu et al., 2004; Sarwar and Corsi, 2007). The re- action of limonene and ozone can occur at rela- tively low concentrations (~10 ppb each) (Langer et al., 2008). The reaction of -pinene α and ozone is significantly effective in forming secondary organic aerosols (Chen and Hopke, 2009). This reaction can contribute to secondary organic aerosol yields of 13.7 81.3% (Hoffmann – et al., 1997; Cocker, 2001), depending on envi- ronmental conditions such as parent reactant concentrations, temperature, relative humidity, ir- radiation, ventilation, and the presence of OH and NO
3radicals. In addition, these reactions produce OH radicals, which contribute 19 29% – of the particle mass formed (Fan et al., 2003).
The final products of these reactions are acids and aldehydes (Jang and Kamens, 1999;
Leungsakul et al., 2005), which are formed by
the contribution of OH radicals to the chemical transformations of intermediates.
3.2 Effect of ozone concentration on secondary aerosol formation
Prior to conducting reactions of VOCs and ozone, we needed to determine the ozone con- centration supplied to the chamber and the background potential for secondary aerosol par- ticle formation. A mass balance equation was considered to calculate the variation in ozone concentrations in the chamber for these experi- ments, as described in a previous study (Vu et al., 2011b). Based on the variations in ozone concentration in the chamber with and without the test home insecticide, the reacted ozone con- centration in each experiment was estimated and compared with the secondary particle mass.
Reactions of VOCs and ozone are well known Fig. 2. Chromatogram of volatile organic compounds emitted from the home insecticide tested
in this study.
to form secondary aerosols, depending on vari- ous factors such as the type of VOCs present in the air (Odum et al., 1996; Hoffmann et al., 1997; Cocker, 2001; Fan et al., 2005), the re- acted ozone concentration (Hoffmann et al., 1997; Vu et al., 2011a, 2011b), light (Hoffmann et al., 1997; Sheehan and Bowman, 2001), tem- perature (Jang and Kamens, 1999; Sheehan and Bowman, 2001; Takekawa et al., 2003; Lamorena and Lee, 2008), and air exchange rate (Sarwar and Corsi, 2007). Here, we investigated the ef- fect of ozone and VOCs emitted from a home insecticide on secondary aerosol formation.
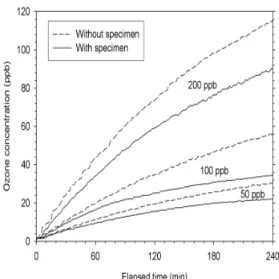
Most VOCs in the specimen immediately evaporated into air. The quantity of VOCs in the air was largest 10 min after placing the specimen into the chamber. This finding implies that the reactions of VOCs and ozone occurred most readily at this time. Ozone was injected into the chamber 4 min after introducing the specimen. We considered this point to represent the beginning of the experiment (elapsed time = 0). When ozone was injected into the chamber, the reactions between VOCs and ozone occurred immediately due to the pre-existing VOCs emit- ted from the specimen. Ozone concentrations in the experiment with the test specimen were clearly lower than those in the control experi-
ment without the test specimen (Fig. 3).
Fig. 3. Comparison of ozone concentrations in pure air experiments with and without the home insecticide.
This result indicates that ozone was consumed
during the reaction with VOCs. The reacted
ozone rate may also vary with time. Obvious
differences were observed between the two
ozone concentration curves at 27, 10, and 4 min
for injected ozone concentrations of 50, 100,
and 200 ppb, respectively. The ozone con-
sumption rates were nearly constant during the
reaction periods. These rates were 0.03, 0.09,
and 0.10 ppb/min for the 50-, 100-, and
200-ppb treatments, respectively. The ozone
concentrations measured at 4 h were 22.0, 34.6,
and 89.6 ppb for the 50-, 100-, and 200-ppb
treatments, respectively. Reacted ozone concen- trations of 8.8, 20.7, and 26.1 ppb for the 50-, 100-, and 200-ppb treatments, respectively, were estimated from the differences between meas- ured ozone concentrations with and without the test specimen.
The typical secondary particle formation and growth phenomenon are plotted in Fig. 4 for the 100-ppb treatment. Fig. 4a shows the typical
“banana-shaped” plot of nanoparticle formation and growth during the mixture of VOCs and ozone. Nanoparticle formation occurred very abruptly at about 20 min and proceeded rapidly.
These nanoparticles also grew quickly to larger particles through the condensational growth phe- nomenon (Heaton et al., 2007; Simchi et al., 2007), which increased the particle mass con- centration rather than the particle number concentration. Ultrafine particles are very stable and can exist from minutes to hours in the at- mosphere (US EPA, 2004). The ultrafine par- ticles generated in this study obviously existed for more than 3 h. The stability of ultrafine particles in indoor environments may contribute to their damaging effects, as they have time to come in to contact with the human lung, expos- ing tissue surfaces to the surface chemistry of the particles (Donaldson et al., 1998) and ulti-
(a)
Elapsed time (min)
0 60 120 180 240
Particle number concentration (particles/cm3) 0 2000 4000 6000 8000 10000 12000 14000 16000 18000
Particle mass concentration (µg/m3) 0 2 4 6 8 10 12 14 16 18
(b)
Elapsed time (min)
0 60 120 180 240
Particle number concentration (particles/cm3) 0 2000 4000 6000 8000 10000 12000 14000 16000 18000
Particle mass concentration (µg/m3) 0 5 10 15 20 25 30 35 Corrected number
Corrected mass
(c)
Fig. 4. Particle formation and growth phenomena due to the reaction of ozone with volatile organic compounds emitted from the household insecticide at 100-ppb ozone concentration:
(a) particle size distribution,
(b) measured particle number and mass
concentrations, (c) corrected particle
number and mass concentrations.
mately depositing in the deepest regions of the human respiratory system (Fissan et al., 2007).
The particle number concentration increased rap- idly and peaked at 60 min (Fig. 4b), which is well known as the nucleation burst phenomenon.
After reaching a peak concentration (16,608 par- ticles/cm
3), the particle number concentration then decreased due to wall loss (Lee et al., 2004). Although the particle number concen- tration decreased, the particle mass concentration increased gradually through the condensational growth of pre-existing particles during the ex- perimental period.
To compare the particle formation potential of this insecticide with previously reported results for other household products, the particle mass concentrations were corrected for deposition loss on the reaction chamber wall and ventilation loss due to air exchange using the following equations:
where N(t, d
p) and ∆ N(t, d
p) are the measured particle number concentration and the wall loss of the particle number concentration, re- spectively, during ∆ t at a given time t for a particle diameter of d
p. In this study, a size-in- dependent wall loss rate of 8.4 × 10
-5s
-1was
used (Lee et al., 2004). The wall loss of the particle mass concentration was calculated from
N(t, d
∆
p) using Eq. 2 (Hinds, 1999):
where C
m,wallis the particle mass concentration lost on the chamber wall, ρ
pis the assumed particle density (1 g/cm
3), and d
pis the particle diameter at time t.
The loss of particle number and mass concen- trations due to ventilation can be calculated us- ing Eqs. 3 and 4, respectively:
where N
AERand C
m,AERare the lost particle number and mass concentrations due to air ex- change during a time interval of t
2– t
1, respectively. N(t
1) and C(t
1) are the measured particle number and mass concentrations at time t
1, respectively, and AER is the applied air ex- change rate. AER was 0.24 h
-1in this study.
Finally, corrected particle mass concentrations can be calculated using Eq. 5:
where C is the measured particle mass, C
m,wallis
ΔN(t, d
p) = N(t, d
p)[1 exp(-8.4 – × 10
-5Δt)], ··· (1)
C
m,wall= ∑ΔN(t, d
p) ρ
p(d
p)
3, ··· (2)
N
AER= N(t
1)AER(t
2– t
1), ··· (3)
C
m,AER= C(t
1)AER(t
2– t
1), ··· (4)
C
m,corrected= C + C
m,wall+ C
m,AER, ··· (5)
the lost particle mass on the wall, and C
m,AERis the lost particle mass due to ventilation. The corrected particle number and mass concen- trations are shown in Fig. 4c. The particle mass concentration that formed was 2.1 times higher than the measured particle mass concentration.
The corrected particle mass concentration of the insecticide was lower than those for air fresheners previously tested under the same ex- perimental conditions, although their increasing trends are similar (Vu et al., 2011b). This dif- ference in particle formation potential between the two kinds of household product is likely to result from differences in composition and emis- sion rates of the different VOCs contained in each product.
Reactions of ozone and VOCs, particularly biogenic hydrocarbons such as terpenes, sig- nificantly contribute to secondary organic aero- sol formation (McMurry et al., 2004). Several studies have reported the effect of ozone con- centration on particle mass concentration (Hoffmann et al., 1997; Coleman et al., 2008;
Lamorena and Lee, 2008; Vu et al., 2011a, 2011b). In this study, we investigated the effect of ozone concentration on secondary aerosol formation during reactions between ozone and VOCs emitted from a home insecticide in a test
chamber. Three levels of ozone concentration (50, 100, and 200 ppb) were set to simulate re- al-world environments.
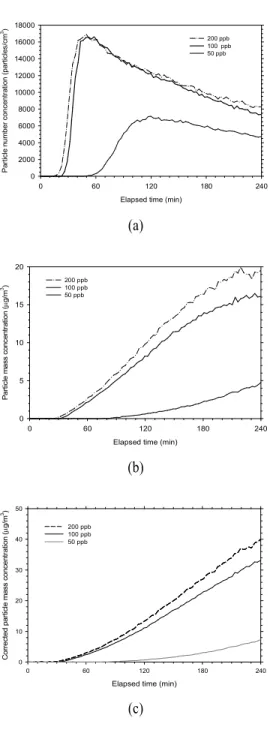
Fig. 5a shows that the nucleation burst was
delayed as the injected ozone concentration
decreased. Nanoparticle formation occurred at
50, 25, and 17 min for ozone concentrations of
50, 100, and 200 ppb, respectively. Clearly, the
reaction between ozone and VOCs significantly
contributed to secondary aerosol formation. The
peak particle number concentration at 100 ppb
was twice that at 50 ppb. However, the peak
particle number concentrations at 100 and 200
ppb were similar (16,608 and 16,933 par-
ticles/cm
3, respectively). These findings indicate
that certain amounts of condensable organic va-
pors, available to nucleate new particles, were
produced after a similar reaction time. When
the ozone concentration was increased to 200
ppb, more condensational growth, rather than
new particle production, occurred. In this case,
the increased ozone concentration promoted con-
densational growth of particles, thereby generat-
ing larger particles that produced a higher par-
ticle mass concentration (Fig. 5b). The particle
mass concentrations corrected for wall loss and
ventilation loss gradually increased during the
reactions (Fig. 5c). Particle mass concentrations
were 7.3, 33.1, and 40.0 µg/m
3at 240 min for the 50-, 100-, and 200-ppb treatments, respectively.
The highest particle mass concentration at 240 min was 40.0 µg/m
3for the 200-ppb treatment, which was lower than that (163.5 µg/m
3, cor- rected for wall loss and ventilation loss) pro- duced from reactions between ozone and VOCs emitted from an air freshener under the same experimental conditions (Vu et al., 2011b). The ratios of reacted ozone to the corrected particle mass concentration were 1.21, 0.63, and 0.65 for the 50-, 100-, and 200-ppb treatments, respectively. These ratios are higher than those recorded in the air freshener experiment (~0.4) under the same conditions (Vu et al., 2011b).
These results indicate that the difference in composition of the VOCs emitted from house- hold products is an important factor determining the potential for secondary aerosol formation through ozone reaction.
4. Conclusions
Home insecticides are commonly used to pre- vent or eliminate mosquitoes, houseflies, and cockroaches. The health risks associated with the generation of primary air pollutants from the use of home insecticides should be minimized.
Elapsed time (min)
0 60 120 180 240
Particle number concentration (particles/cm3) 0 2000 4000 6000 8000 10000 12000 14000 16000 18000
200 ppb 100 ppb 50 ppb
(a)
Elapsed time (min)
0 60 120 180 240
Particle mass concentration (µg/m3) 0 5 10 15 20
200 ppb 100 ppb 50 ppb
(b)
Elapsed time (min)
0 60 120 180 240
Corrected particle mass concentration (µg/m3) 0 10 20 30 40 50
200 ppb 100 ppb 50 ppb