- 91 -
A Study of the Expression of Cytokines and p53 in Nasal Polyps
Myoung Sil Ju, M.D.1, Chong Nahm Kim M.D.1 and Young Sook Hong, M.D.2 ABSTRACT
Background and Objectives:Nasal polyps are a condition of uncertain etiology. Cytokines are thought to play a role in nasal polyps in vitro, but in vivo studies on the patterns of cytokine expression in nasal polyps have been limited. The aim of the present study is to gain a better understanding of the pathophysiology of nasal polyps by defining the patterns of expression of cytokine mRNA and p53 in the nasal mucosa of patients with nasal polyps. Materials and Methods:This objective was supported by performing RT-PCR (reverse transcription-polymerase chain reaction) for IL-2, INF-γ (T1 cytokine), IL-5, IL-8, IL-10, IL-13 (T2 cytokine), TNF-α, TGF-β1, and p53. Results:Observation of the nasal polyps indicated significant increases in mRNA for T2 cytokines and p53 over controls. The expressions of IL-10 and IL-13 mRNA in the nasal mucosa of non-allergic patients were stronger than in that of allergic patients. Conclusion:This result suggests that the pathogenesis of nasal polyps is assoc- iated with T2 cytokines and p53.
KEY WORDS:Nasal·Polyp·Pathogenesis·Cytokine·p53.
INTRODUCTION
Frequently encountered in otolaryngology clinics, na- sal polyps are caused by an uncertain etiology but are observed in cases of allergy or chronic sinusitis, and lo- cal minor factors in the nasal mucosa appear to be im- portant. An effective method of treating nasal polyps has not yet been developed, and studies on the pathop- hysiology of allergic diseases are being actively condu- cted both domestically and overseas with focus being placed on the role of cytokines.1-3) Studies on cytokine expression in nasal polyps, however, remain inconclu- sive.
There are two types of cytokines:the Th1-type, wh- ich accelerates cell-mediated reactions, and the Th2-type, which produces antibodies and restrains the emission of Th1-type cytokines resulting from allergyrelated cell di-
stribution.4) The two types of cells regulate each other;
a strong Th2 response restrains a strong Th1 response and vice-versa. In the present study, we studied the role of cytokines in nasal polyps by identifying which Th cell subset demonstrated the stronger expression in nasal polyps. In addition, we attempted to determine the local factors of nasal polyps through observation of p53 ge- nes, most of which are found in deformed cells and tu- mor cells.
In the present study, we compared the expressions of Th1-type cytokinesInterleukin-2 (IL-2) and Interferon- γ (IFN-γ) and Th2-type cytokinesInterleukin-5 (IL- 5), Interleukin-8 (IL-8), Interleukin-10 (IL-10), Inter- leukin-13 (IL-13), tumor necrosis factor-α (TNF-α) and transforming growth factor-β (TGF-β) in the nasal polyps of a control group and a patient group with allergic and non-allergic nasal polyps. We also attempted to determine a correlation with the expression of p53.
MATERIAL AND METHODS Material
We obtained tissue for this study by sampling the na- sal polyps of 33 patients who visited the Otolaryngology
1Department of Otolaryngology, 2Biochemistry, College of Me- dicine, Ewha Womans University, Seoul, Korea
Adderss correspondence and reprint requests to Young Sook Ho- ng, MD, Departmant of Biochemisitry, College of Medicine, Ewha Womans University, Dong Dae Mun Hospital, 70 Chongro 6-ka Chongroku, Seoul 110-126 Korea
Tel:82-2-760-5135, Fax:82-2-763-5719 Accepted for publication on November 7,1999
Department of Ewha Womans University Hospital and who were diagnosed with nasal polyps (10 patients with allergic nasal polyps of the perennial type and 23 pati- ents with non-allergic nasal polyps). Tissues for the co- ntrol were obtained by extracting samples from the tur- binate mucosa of six patients with nasal septum deviation who did not show signs of allergy or nasal polyps during surgery. The samples were kept in a frozen state at a temperature of -70℃. The patients ages ranged from 19 years to 48 years and averaged 34 years. The 10 pat- ients with perennial allergic nasal polyps were oversen- sitive to house dust or mites, and their allergic sinusitis was diagnosed through an examination of their medical history and the performance of physiologic and skin pr- ick tests. Patients treated with anti-allergic or antibiotic therapies of the spray or oral type and patients who had undergone nasal surgery in the past were excluded.
Separation of total RNA
Total RNA was obtained through the UltraspecTM-
Ⅱ RNA isolation system (Biotecx Lab. Inc., Houston, TX), which is a modification of the guanidiumphenol- chloroform extracting method. About 100 mg was extr- acted from the frozen tissue, which had been kept at a temperature of -70℃, and was equalized in 1 ml Ultr- aspecTM RNA (Biotecx Lab. Inc., Houston, TX) with a polytron (Ultra-Tarrax T25TM, IKA-Labortechnik Co- rp., Staufen, Germany). Following this, the tissue was maintained at a temperature of 4℃ for five minutes to separate its nuclear protein and was then mixed with 0.2 ml chloroform, reacted on ice for approximately five minutes and placed in a centrifuge (Micro 17112 Hanil industrial company, Seoul, Korea) for 20 minutes at 12, 000×g (4℃). We transferred the top layer of the cent- rifuged material to a new test tube and added 0.5 ml isopropanol and RNA TrackTM resin (Biotecx Lab. Inc., Houston, TX). The precipitates of the centrifuged mat- erial were dissolved with distilled water treated with di- ethyl pyrocarbonate and then placed in the centrifuge to separate the RNA. The separated RNA was diluted 20 times and its OD (optimal density) was measured with a spectrophotometer (DU-650, Beckman instruments Inc., Fullerton, CA) under 260 nm. A high purity RNA with high OD values ranging between 1.9-2.0 was obtained for the following tests.
Reverse transcription
By applying the methods of Gilliland et al.,5) we co- nducted RT-PCR through the reverse transcription syst- em (PromegaTM, Madison Corp., Madison, WI). The extracted 2 μg RNA was placed in 2μl oligo (dT) primer (0.5 mg/ml) for 10 minutes at a temperature of 65℃. Following this, a mixture containing 5 mM MgCl2, 1mM dNTP mixture, 1×reverse transcription buffer so- lution (10 mM Tris-HCl, pH 8.8 at 25℃;50 mM KCl;
0.1% Triton X-100), 2.5 units of rRNasin (RNase inhi- bitor), and 15 units of AMV reverse transcription enz- yme was created and brought to a final volume of 20 μl, which was then compounded with complementary DNA. The reaction solution was reacted for one hour at a temperature of 42℃ and the reverse transcription en- zyme activity was stopped for five minutes at a tempe- rature of 95℃. The resulting solution was frozen at a temperature of 4℃.
PCR (polymerase chain reaction)
2 μl complementary DNA was mixed with 1×PCR buffer solution (10 mM Tris-HCl, pH 8.3 at 25℃;50 mM KCl;1.5 mM MgCl2), 1 unit of Taq polymeraseR (Takara Shuzo Corp., Shiga, Japan), 10 pmol β-actin and each cytokines sense and antisense primer for a final reaction volume of 50 μl. A PCR reaction was cond- ucted using the GeneAmp PCR System 9600 (Perkin Elmer Corp., Norwalk, CT). The reaction process incl- uded denaturation for five minutes at 94℃ and for one minute at 94℃, one minute annealing at 58℃ for β- actin, TGF-β, IL-2 and IFN-γ, 60℃ for IL-8, IL-10 and IL-13, 57℃ for IL-5, 50℃ for TNF-, 55℃ for p53, and a one minute extension at 72℃. The reaction cycle was repeated 35 times with one more extension of seven minutes at 72℃. The primer sequence and the size of re- action products against the β-actin of each cytokine and p53 are shown in Table 1.
Southern blot Electrophoresis
The product amplified with the PCR went through el- ectrophoresis (Mupid-2TM, Cosmo Bio. Corp., Tokyo,
Japan) under a 1.5% agarose gel condition. It was then stained with ethidium bromide for separation and visu- alization and transferred to a NYTRAN-PLUS (Scheicher
& Schuell, Dassel, Germany) with the capillary diffus- ion method and baked at 80℃ for two hours.
Manufacture of the probe
Manufacture of the probe was based on Gene Bank data, which is shown in Table 2.
Hybridization
Hybridization was performed at 47℃ for 16 hours by mixing β-actin and each cytokine probe after a hybri- dization buffer (6×SSC, 10×Denhadt’s solution, 50%
formamide, 0.5% SDS, 1 mg/ml denatured salmon sperm DNA) was added and pre-hybridization was performed at 42℃ for three hours. The NYTRAN-PLUS was rin- sed with a washing solution (2×SSC, 0.5% SDS), rin- sed again with a second washing solution (1×SSC, 0.
1% SDS), dried, then sensitized to X-ray film (Agfa- Gevaert N.V. ISO9001, Belgium) for 16 hours with a developer (FUJI FPM1200, Tokyo, Japan).
Densitometry
The intensity of each band on the X-ray film was measured with a densitometer (UKB 2222-020 Ultro- Scan XL, Phamacia LKB Biotechnology, Uppsala, Swe- den) and density ratios were calculated by dividing each cytokines band intensity by the band intensity of the β- actin of the same individual sample.
Data analysis
An arithmetic mean of cytokine expression was obt- ained and all results were analyzed for significance with
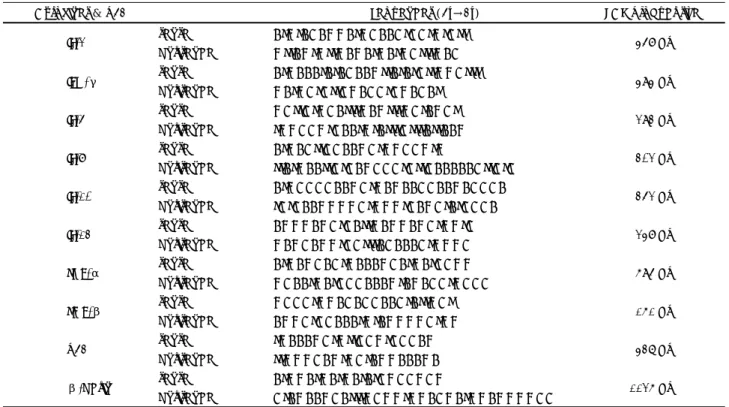
Table 1. Primer sequences and PCR product size of β-actin, cytokines and p53
Cytokines & p53 Sequences (5’→3’) PCR product size sense ATGTACAGGATGCAACTCCTGTCTT
IL-2
antisence GTTAGTGTTGAGATGATGCTTTGAC 458 bp sense ATGAAATATACAAGTTATATCTTGGCTTT
IFN-γ
antisence GATGCTCTTCGACCTCGACAT 494 bp sense GCTTCTGCATTTGAGTTTGCTAGCT
IL-5
antisence TGGCCGTCAATGTATTTCTTTATTAAG 293 bp sense ATGACTTCCAAGCTGGCCGTG
IL-8
antisence TTATGAATTCTCAGCCCTCTTCAAAAACTTCTC 302 bp sense ATGCCCCAAGCTGAGAACCAAGACCCA
IL-10
antisence TCTCAAGGGGCTGGGTCAGCTATCCCA 352 bp sense AGGGAGCTCATTGAGGAGCTGGTC
IL-13
antisence GAGCAGGTCCTTTACAAACTGGGC 248 bp sense ATGAGCACTGAAAGCATGATCCGG
TNF-α
antisence GCAATGATCCCAAAGTAGACCTGCCC 695 bp sense GCCCTGGACACCAACTATTGCT
TGF-β
antisence AGGCTCCAAATGTAGGGGCTGG 161 bp sense TGAAAGCTGTTCCGTCCCAG
p53 antisence TTGGGCAGTGCTAGGAAAGA 437 bp sense ATGGATGATGATATCGCCGCG
β-actin
antisence CTAGAAGCATTTGCGGTGGACGATGGAGGGGCC 1126 bp
Table 2. Probe sequences of β-actin, cytokines and p53 Cytokines & p53 Sequences (5’→3’)
IL-2 CACTTAAGACCCAGGGACTT IFN-γ TGCAGAGCCAAATTGTCTCC IL-5 GAGGATTCCTGTTCCTGTAC IL-8 CAGTTTTGCCAAGGAGTGCT IL-10 GAGCAGGTGAAGAATGCCTT IL-13 TGCAATGGCAGCATGGTATG TNF-α TGGAGCTGAGAGATAACCAG TGF-β AAGTGGATCCACGAGCCCAA p53 CTGTACCACCATCCACTACA β-actin AGCCCAAGATAGTTAAGTGG
ANOVA set at a statistical significance of p≤0.05.
RESULTS Expression of T1 cytokine mRNA
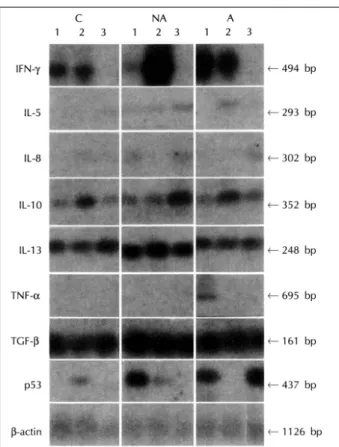
IL-2 mRNA did not express in the control group or the nasal polyp patients group of the present study (Ta- ble 4). The expression of IFN-γmRNA, however, was observed in two (33%) out of six control group patients, 10 (43%) out of 23 non-allergic nasal polyp patients, and two (20%) out of 10 allergic patients (Table 3, Fig. 1).
Expression of Th2 cytokine mRNA
The expression of IL-5, which is known to be related to allergic pathogenesis, demonstrated a large difference between the control group and the other groups:there was only one case (17%) of expression in the control group, 16 (70%) out of 23 non-allergic patients and six (60%) out of 10 allergic patients (Table 3, Fig. 1).
IL-8 is known to cause and maintain proliferation and inflammation in various human organs. In the present study, four (67%) out of six patients in the control gro- up exhibited expression of IL-8, while 16 (70%) out of 23 non-allergic patients and eight (80%) out of 10 all- ergic nasal polyp patients demonstr-ated expression (Ta- ble 3, Fig. 1).
During observations for IL-10, expression was found in three (50%) out of six patients in the control group, 18 (73%) out of 23 non-allergic patients and six (60%) out of 10 allergic patients. That is, the degree of expre- ssion was slightly higher among non-allergic patients (Table 3, Fig. 1).
The expression of IL-13, which is similar to IL-4 in its activity of compounding IgG4 and IgE, was found in three (50%) out of six patients in the control group,
21 (91%) out of 23 non-allergic patients and six (60%) out of 10 allergic patients (Table 3, Fig. 1).
Expression of TNF-α and TGF-β
TNF-α, a proinflammatory cytokine known to play an important role in acute and chronic inflammation of epithelium cells in the respiratory system, did not expr- ess in the control group and was found in only one (4%) non-allergic patient and two (20%) allergic patients (Ta- ble 3, Fig. 1).
The expression of TGF-β was observed in the con- trol group and the nasal polyp patients group (Table 3, Fig. 1).
Expression of p53 mRNA
The expression of p53 was observed in two (33%) out of six patients in the control group, 15 (65%) out
Table 3. Number of subjects with positive band on Southern blot analysis of amplified cDNA
Cytokines &
p53
Control (n=6)
Non-allergy polyp (n=23)
Allergy polyp (n=10) IL-5 1( 17%) 16( 70%) 6( 60%) IL-8 4( 67%) 16( 70%) 8( 80%) IL-10 3( 50%) 21( 91%) 6( 60%) IL-13 3( 50%) 18( 78%) 6( 60%) TNF-α 0( 0%) 1( 4%) 2( 20%) TGF-β 6(100%) 23(100%) 10(100%) p53 2( 33%) 15( 65%) 7( 70%)
Fig. 1. Southern blot analysis for IFN-γ, IL-5, IL-8, IL-10. IL-13, TNF- α, TGF-β, p53, and β-actin RT-PCR product in normal su- bjects (C) non-allergic (NA), and allergic nasal polyps (A). The cDNA is synthersized from total RNA and amplified with primers specific for IFN-γ, IL-5, IL-8, IL-10, IL-13, TNF-α, TGF-β, p53, and β-actin. The RT-PCR products were blotted and hybridized with IFN-γ, IL-5, IL-8, IL-10, IL-13, TNF-α, TGF-β, p53, and β-actin probes.
of 23 non-allergic patients and seven (70%) out of 10 allergic patients. That is, the degree of p53 expression was found to be higher in nasal polyp patients than in control group patients (Table 3, Fig. 1.).
Ratio of cytokine/-actin and p53/β-actin in each group
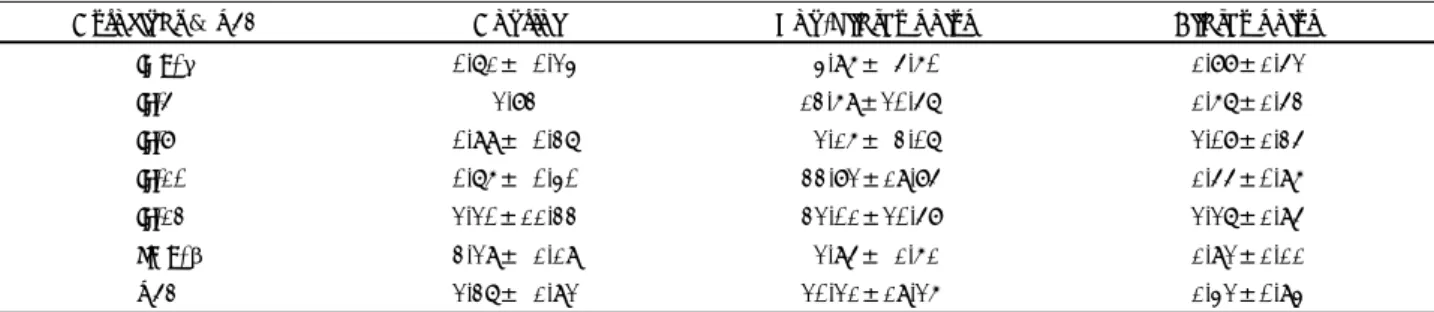
For relative measurements of each cytokine expres- sion, the densities of the special band in each cytokine and of its corresponding special band in the β-actin were obtained and represented in a single ratio. β-actin is a material that indicates mRNA expressions in every cell without external stimuli, so it is often used as a sta- ndard in evaluating the reliability of an mRNA express- ion test. By measuring the expressed bands except those of IL-2 and TNF-α, which were not expressed in tissues obtained from the control group, with a densitometer, av- erage values and standard deviations were obtained for IFN-γ/β-actin, IL-5/β-actin, IL-8/β-actin, IL-10/β- actin, IL-13/β-actin, TGF-β/β-actin, and p53/β-actin.
They were 0.71±0.24, 2.83, 0.99±0.37, 0.76±0.40, 2.20±11.33, 3.29±1.90, 2.37±1.92 in the control group, 4.96±5.60, 13.69±20.57, 2.16±3.07, 33.82±19.85, 32.
01±20.58, 2.95±1.61, and 20.21±19.26 in the non- allergic patient group, and 1.88±1.52, 1.67±1.53, 2.08
±1.35, 1.55±0.96, 2.27±1.95, 1.92±1.11, 1.42±0.94 in the allergic patient group. The density ratios for IL-10 and IL-13 were significantly higher in the non-allergic patient group than in the control group and the allergic patient group, while the density ratios for p53 were sig- nificantly higher in the non-allergic patient group than in the allergic patient group (Table 4).
DISCUSSION
Infection,6) allergy,7) epithelium rupture due to dest-
ruction of the mucous gland,8) Bernouilli reaction due to negative pressure from nasal cavity synechia,9) and differentiation of ion movement in the epithelium cells10) are some of the various factors thought to cause nasal po- lyps. Because nasal polyps can be caused by such com- plicated factors, there have been a number of recent st- udies attempting to identify the various pathogeneses of acute infection, chronic infection and allergy by analyzing cytokines.
Cytokines are secreted from inflammatory cells such as lymphocytes and eosinophils, which infiltrate human organs, mast cells, fibroblasts, epithelium cells and ma- crophages. Therefore, by analyzing cytokines in an tissue, the immune reactions of the related pathology can be identified. Cytokines were first divided into Th1 and Th2 categories through the study of mice and the method of classification was fun-ctional, not based on expression.
Th1, which includes IL-2, IFN-γ and TNF-β, are se- creted by inflammatory T cells, which are associated with the activation of macrophages. Th2 cytokines incl- ude IL-4, IL-5, IL-6, IL-8 and IL-10, which are produced by helper T cells, which also activate B cells to promote anti-body production.
IFN-g, a cytokine secreted by Th cells at times of in- fection, activates cell-mediated immunity, restrains the proliferation of Th2 cells, and activates the production of antibodies and the development of cytotoxic T cells.
Test results from the present study revealed no expr- ession of IL-2 in normal subjects and those with nasal polyps while the expression of IFN-γ was found in two out of six patients in the control group, 10 out of 23 pa- tients with non-allergic nasal polyps, and two out of 10 patients with allergic nasal polyps. The finding of incr- eased IFN-γ expression in non-allergic nasal polyps is consistent with the findings of a study conducted by Hamilos et al.,11) which reports that the expression of IFN-γ increased in non-allergic nasal polyps. A recent
Table 4. Relative quantitation of amplified cytokine cDNA using amplified β-actin cDNA as a reference
Cytokines & p53 Control Non-allergy polyp Allergy polyp
INF-γ 0.71± 0.24 4.96± 5.60 1.88±1.52
IL-5 2.83 13.69±20.57 1.67±1.53
IL-8 0.99± 0.37 2.16± 3.07 2.08±1.35
IL-10 0.76± 0.40 33.82±19.85* 1.55±0.96 IL-13 2.20±11.33 32.01±20.58* 2.27±1.95
TGF-β 3.29± 1.19 2.95± 1.61 1.92±1.11
p53 2.37± 1.92 20.21±19.26* 1.42±0.94 Density ratio is mean±SD
*p<0.05 compared with control and allergy polyp group
study by Park et al.12) also reports finding distinctive evidence of cell-mediated immunity activated by IFN- γ in non-allergic nasal polyps. However, Min et al.13) have maintained that IFN-γis expressed in all nasal polyps equally regardless of whether the nasal polyp is allergic or non-allergic. The report also maintains that IFN-γ plays a more important role than IL-4 or IL-5 in causing nasal polyps. And according to findings from a study by Miller et al.,14) IFN-γ produced by Th1 cells accumulates in nasal polyps.
IL-4 is believed to increase IgE production by cau- sing an isotype switch to B lymphocyte, while IFN-γ is known to prevent such activity. IL-5, meanwhile, is thought to play a major role in the differentiation and proliferation of eosinophils and in the enhancement of their survival capabilities. It is known that eosinophils increase in nasal polyps, and the increase can be expla- ined in one of two ways:there is an increase in eosin- ophil movement or there is a lengthening of eosinophil life. In vivo studies have shown that IL-5 lengthens the life of eosinophils. IL-4 is known to stimulate the exp- ression of VCAM-1 in endothelium cells. And other cy- tokines, such as TNF-α and TGF-β, have been found to be produced by eosinophils. Hamilos et al.15) have reported finding that cell infiltration by GM-CSF, IL-3, IL-4 and IL-5, which are Th2 cytokines, increased in al- lergic nasal polyps but did not increase in non-allergic nasal polyps. The presence of Th2 cytokines indicates that allergic nasal polyp patients are exposed to allergy chronically but does not explain why eosinophils incr- ease in non-allergic nasal polyps.
In the present study, a close relationship between eo- sinophil increase and nasal polyps is suggested by the differing rates of IL-5 expression:17% in the control group compared to 60-70% in nasal polyp patients. But the rates did not differ significantly between allergic and non-allergic groups.
According to a report by Lee et al.,16) much of the cytokine production occurs in nasal polyps and are a major pathogenesis of nasal polyps, but the allergy itself is not a main pathogenesis of nasal polyps. In the present study, the rates of IL-4 and IL-5 expression did not dif- fer significantly between allergic and non-allergic nasal polyps, which suggests that allergy is not a main contr- ibutor to the development of nasal polyps. There have been studies finding no difference in lymphocyte subp- opulation and antigen specific IgE level between aller-
gic and non-allergic nasal polyps,17) and other findings indicate an increase in epithelial mast cells in both alle- rgic and non-allergic nasal polyps.18) A study by Claudia et al.19) suggests IL-1β and TNF-α, which are proin- flammatory cytokines, to be main factors in allergic or viral rhinitis. Proinflammatory cytokines, such as IL-1β and IL-6, have been found to increase in acute sinusitis, and IL-8 and IL-3, neutrophil activity protein, have also shown significant increases. According to findings from the present study, there was a distinct increase in IL-5 cytokines in nasal polyps, but there was no difference between allergic and non-allergic nasal polyps.
IL-8, which is secreted by monocyte or epithelium cells, stimulates the movement of neutrophil and causes its degranulation, thus playing a major role in the prol- iferation of epidermallayer and inflammatory reaction.
According to the results of the present study, IL-8 exp- ressed equally in the control group and nasal polyp pat- ients. Density ratios also indicate no significant difference between the two groups.
The IL-10 has a representative anti-Th1 cell function and is known to have in-vitro properties of anti-inflam- mation. Th1-type cytokines, which are responsible for the sterilization of macrophages and IgG2 production, cause IL-10-producing cells to differentiate B cells into anti-body-producing cells. In the present study, IL-10, which decreases the production of Th1-type cytokines, expressed 10-41% higher in nasal polyps than in the control group and density ratios indicated a prominent increase in IL-10 in non-allergic nasal polyps.
IL-13, a pleiotropic cytokine, is produced largely by activated Th2 cells and is similar in activity to IL-4.
The difference between IL-4 and IL-13 is that the latter reinforces DNA compounding induced by IL-2 and pr- omotes the emission of IFN-_, while IL-4 restrains the reaction of B cells against IL-2 and restrains the emission of IFN-γ. The fact that IL-10 and IL-12 are restrained by IL-13 is particularly important in the cross-regulation that occurs between Th1 cells and Th2 cells, because IL- 10 restrains inflammatory cytokines (Th1) while IL-12 promotes the development of Th1 cells. In other words, IL-13, together with IL-4 and IL-10, acts as a Th2-type cyto-kine. In the present study, IL-13, which is similar in activity to IL-4, was found to express 10-28% higher in nasal polyps, and density ratios also indicated a sign- ificantly higher expression.
TNF-α, a proinflammatory cytokine, is related to the
occurrence and maintenance of acute and chronic infl- ammation of epithelium cells in the respiratory system including the nasal mucosa. But in the present study, its expression was found to be low in nasal polyps.
TGF, a cell-deforming cytokine, includes a, β1, β2, and β3, of which β1 is most frequently observed in vi- tro. TGF-β1, which causes edema, can potentially create nasal polyps, but the results of the present study indicate that it expressed both in normal subjects and in patients with nasal polyps without any significant difference.
The p53 gene is found most often in cells or tumor cells deformed by chemical carcinogenic substances, ul- traviolet rays and viruses and is rarely present in normal cells. The expression of p53 within cells is controllable in the transcription or post-transcription phases and the amount of p53 mRNA increases when cell growth is activated. The presence of p53 protein is known to be 10-100 times greater in deformed cells than in normal cellsthe increase in p53 mRNA and the metabolism of p53 protein are stabilized in deformed cells. The role of p53 in nasal polyps is unknown but results from the present study indicate that its expression was 32-37%
higher in the control group than in the experimental gr- oup and that its density ratio was significantly higher (p≤0.05) in control subjects than in non-allergic or al- lergic patients with nasal polyps. The finding that there was higher p53 expression in nasal polyps than in nor- mal structures may be attributable to the fact that nasal polyps are a type of deformation, but this requires fur- ther investigation.
According to the findings of the present study, there was higher expression of IFN-γ, a Th1 cytokine, and higher expressions of IL-5, IL-10 and IL-13 in patients with nasal polyps than in control subjects. These cyto- kines are thus believed to be the main factors in nasal polyp development and there was little difference in ex- pression rates between allergic and non-allergic nasal polyps, with non-allergic nasal polyps indicating a slig- htly higher expression rate.
In conclusion, it is yet to be determined which cyto- kine functions to cause nasal polyps. We were, however, able to identify the various pathogeneses related with the disease. Further study should be made in the future.
CONCLUSION
Findings from the present study indicate a higher ex-
pression of IFN-γ, a Th1 cytokine, and higher expres- sions of IL-5, IL-10 and IL-13 in patients with nasal polyps than in control subjects. These cytokines are be- lieved to be the main factors in nasal polyp development and there was little difference in expression rates between allergic and non-allergic nasal polyps, with non-allergic nasal polyps indicating a slightly higher expression rate.
Specifically, non-allergic nasal polyps indicated a sign- ificant increase in IFN-γ, while allergic and non-allergic nasal polyps indicated similar expressions of Th2 cyt- ines, which are thought to increase in allergic nasal polyps. A comparison of band density ratios indicates the expressions of IL-10 and IL-13 to be significantly higher in non-allergic patients with nasal polyps than in normal subjects and allergic patients with nasal polyps.
This finding suggests that allergy is not a main patho- genesis of nasal polyps. The expression of p53 was 32- 37% higher in patients with nasal polyps than in normal subjects. The density ratios of expressed bands were si- gnificantly higher in non-allergic nasal polyps than in allergic nasal polyps, suggesting that the pathogeneses of non-allergic and allergic nasal polyps are different.
Further investigation is needed.
REFERENCES
1) Del Prete G, Maggi E, Parronchi P, Chretien I, Tiri A, Macchia D, et al. IL-4 ia an essential factor for the IgE synthesis induced in vitro by human T cell clones and their supernatants. J Immu-nol 1988;140:4193-8.
2) Hamid Q, Azzawi M, Ying S, Moqbel R, Wardlaw AJ, Corrigan CJ, et al. Expression of mRNA for interleukin-5 in mucosal bro- nchial biopsies from asthma. J Clin Invest 1991;87:1541-6.
3) Kapsenberg ML, Wierenga EA, Bos JD, Jansen HM. Functional subsets of human CD4+ T-cells. Immunol Today 1991;12:392-5.
4) Huang M, Wang J, Lee P, Sharma S, Mao JT, Meissner H, et al.
Human non-small cell lung cancer cells express a type 2 cytokine pattern. Cancer Res 1995;55:3847-53.
5) Gilliland GS, Perrin K, Blanchard K, Bunn HF. Analysis of cyt- okine mRNA and DNA: Detection and quantitation by competi- tive polymerase chain reaction. Pro Natl Acad Sci USA 1990;87:
2725-9.
6) Dawes P, Bates G, Watson D, Lewis D, Lowe D, Drake-Lee A. The role of bacterial infection of the maxillary sinus in nasal polyps.
Clin Otolaryngol 1989;14:447-50.
7) Ogawa H. Atopic aspects of eosinophilic nasal polyposis and a possible mechanism of eosinophil accumulation. Acta Otolarngol (Stockh) Suppl 1986;430:12-7.
8) Tos M, Morgensen C. Pathogenesis of nasal polyps. Rhinol 1977;
15:87-95.
9) Gray L. Deviated nasal septum: Ⅲ Its influence on the physiology and disease of the nose and ear. J Laryngol 1967;81:953-86.
10) Bernstein JM, Cropp GA, Nathanson I, Yankaskas JR. Bioelectric properties of cultured nasal polyp and turbinate epithelial cells.
Am J Rhinol 1990;4:45-9.
11) Hamilos DL, Leung DY, Wood R, Cunningham L, Bean DK, Yas- ruel Z, et al. Evidence for distinct cytokine expression in allergic versus nonallergic chronic sinusitis. J Allergy Clin Immunol 1995;
96:537-44.
12) Park YJ, Yoon HR. Expression of IL-4, IL-6, GM-CSF and INF-γ mRNAs in Nasal Polyps. J Clincal Otolaryngol 1999;10:53-60.
13) Min YG, Rhee CS, Kim CS, Koh YY, Min KU, Anderson PL. In- flammatory Cytokine Expression on Nasal Polyps Developed in Allergic and Infectious Rhinitis. Acta Otolaryngol (Stockh) 1997;
117:302-6.
14) Miller CH, Pudiak DR, Hatem F, Looney RJ. Accumulation of in- terferon gamma-producing TH1 helper cells in nasal polyps. Otol-
aryngol Head Neck Surg 1994;111:51-8.
15) Hamilos DL. Naactive Tissue. sal Polyps as Immunore Allergy and Asthma Proc. 1996;17:293-6.
16) Lee CH, Rhee CS, Min Y-G. Cytokine gene expression in nasal polyps. Ann Otolaryngol 1998;107:665-70.
17) Liu CM, Shun CT, Hsu MM. Lymphocyte subsets and antigensp- ecific IgE antbody in nasal polyps. Ann Allergy 1994;72:19-24.
18) Otsuka H, Ohkubo K, Seki H, Ohnishi M, Fujikura T. Mast cell quantitation in nasal polyps, sinus mucosa, and nasal turbinate mu- cosa. J Laryngol Otol 1993;107:418-22.
19) Claudia R, Wolfgang, Claus B. Cytokines in Nasal Polyposis, Ac- ute and Chronic Sinusitis. American J Rhinology 1998;12:383-8.
20) Kim YM. Tumor suppressor gene. Clin Otol 1996;7:10-8.