ABSTRACT
Purpose: The present study was undertaken to examine whether periodontal probe visibility (PV) accurately reflects gingival thickness (GT) and to identify factors affecting PV using cluster and multivariate analyses.
Methods: The clinical characteristics of the maxillary central incisors (n=90 subjects) were examined. Clinical photographs, sex, PV, probing depth, gingival width, papilla height, GT as measured with an ultrasonic device, and the ratio of crown width to crown length were recorded. Multivariate analysis, using multinomial baseline-category logistic regression, was used to identify factors predictive of PV. Cluster analysis was used to identify gingival biotypes.
Results: In the multivariate analysis, sex was the only significant predictor of PV (odds ratio, 6.48). Two clusters of subjects were created based on morphometric parameters. The mean GT among cluster A subjects was significantly lower than that among cluster B subjects (P=0.015). No significant difference was found between cluster A and B subjects in terms of PV score (P=0.583).
Conclusions: Periodontal PV was not associated with GT as measured directly using an ultrasonic device. Sex was a highly significant predictor of periodontal PV. GT was found to be correlated with morphological characteristics of the periodontium.
Keywords: Cluster analysis; Gingiva; Periodontal index; Periodontium; Phenotype; Ultrasonics
INTRODUCTION
The clinical appearance of healthy periodontal tissue is variable. Ochsenbein and Ross [1]
first classified the gingival anatomy as being of a flat or pronounced scalloped biotype, suggesting that a flat gingiva was associated with a square tooth form and that a pronounced scalloped gingiva was associated with a tapered tooth form. Gingival biotype is related to gingival thickness (GT); thin gingivae is ≤1.5 mm thick, whereas thick gingivae are ≥2 mm thick [2]. Later, Seibert and Lindhe [3] proposed the existence of 2 distinct gingival biotypes, which are based on morphological characteristics of the periodontium: the scalloped-thin biotype and the flat-thick biotype.
Research Article
Received: Jun 15, 2020 Revised: Aug 21, 2020 Accepted: Nov 9, 2020
*Correspondence:
Su-Hwan Kim
Department of Periodontics, Asan Medical Center, University of Ulsan College of Medicine, 88 Olympic-ro 43-gil, Songpa-gu, Seoul 05505, Korea.
E-mail: [email protected] Tel: +82-2-3010-5797
Fax: +82-2-3010-6967
†Young-Sung Kim and Ji-Sun Park contributed equally to this study.
Copyright © 2021. Korean Academy of Periodontology
This is an Open Access article distributed under the terms of the Creative Commons Attribution Non-Commercial License (https://
creativecommons.org/licenses/by-nc/4.0/).
ORCID iDs Young-Sung Kim
https://orcid.org/0000-0003-2674-3649 Ji-Sun Park
https://orcid.org/0000-0002-9026-1647 Young-Hun Jang
https://orcid.org/0000-0002-1499-710X Jung-Hun Son
https://orcid.org/0000-0002-2514-0355 Won-Kyung Kim
https://orcid.org/0000-0003-2557-1646 Young-Kyoo Lee
https://orcid.org/0000-0001-7065-282X Su-Hwan Kim
https://orcid.org/0000-0002-3431-453X
Young-Sung Kim 1,†, Ji-Sun Park 2,†, Young-Hun Jang 3, Jung-Hun Son 4, Won-Kyung Kim 1, Young-Kyoo Lee 1, Su-Hwan Kim 1,*
1Department of Periodontics, Asan Medical Center, University of Ulsan College of Medicine, Seoul, Korea
2Seoul S Dental Clinic, Daegu, Korea
3Seoul Smart Dental Clinic, Hwasung, Korea
4Seoul OK Dental Clinic, Uijeongbu, Korea
Accuracy of periodontal probe
visibility in the assessment of gingival thickness
Periodontal Science
Funding
This research was supported by the Basic Science Research Program through the National Research Foundation of Korea (NRF) funded by the Ministry of Education, Science and Technology (NRF-2011-0013306).
Author Contributions
Conceptualization: Won-Kyung Kim, Young- Kyoo Lee, Su-Hwan Kim; Formal analysis:
Young-Sung Kim, Ji-Sun Park; Investigation:
Ji-Sun Park, Young-Hun Jang, Jung-Hun Son;
Methodology: Ji-Sun Park, Young-Hun Jang, Young-Sung Kim; Project administration:
Young-Sung Kim, Su-Hwan Kim; Writing - original draft: Ji-Sun Park, Su-Hwan Kim;
Writing - review & editing: Young-Sung Kim, Su-Hwan Kim.
Conflict of Interest
No potential conflict of interest relevant to this article was reported.
Esthetics has become a central concern for those undergoing dental procedures; therefore, understanding how the periodontium responds to therapy is critical to achieving acceptable outcomes for patients. The thin biotype has been reported to be associated with a relatively high prevalence of gingival recession in studies of periodontal surgery for conventional or implant prostheses. Consequently, it would be clinically helpful to identify a patient's gingival biotype and GT before that patient undergoes dental treatment in highly visible areas of the mouth [4].
In the past, GT was measured directly by inserting a sterile syringe needle marked with an endodontic gauge into the gum or by using calipers after tooth extraction [5].
Understandably, due to the invasiveness of these methods, direct measurements of GT were not commonly performed. Kan et al. [6] suggested an alternative, non-invasive method for estimating GT, namely determination of the gingival biotype. Using this method, the gingival biotype is categorized as either thin or thick according to the visibility of the underlying periodontal probe through the gingival sulcus. This non-invasive method was widely accepted as the easiest and most straightforward means of determining the gingival biotype, which is used as a proxy for GT. In addition, another direct measurement method was introduced, involving an ultrasonic device and the pulse echo principle [7]. In this method, ultrasonic pulses are transmitted through the sound-permeable mucosa and reflected at the surface of hard tissue (i.e., the alveolar bone or tooth). The time delay between pulse transmission and the arrival of the echo enables the thickness of the masticatory mucosa to be estimated at a resolution of 0.1 mm, and the results are displayed [7-10]. The reliability and validity of measurements of mucosal thickness in different parts of the mouth have been found to be acceptable [10-12]. This ultrasonic device is not currently commercially available and is therefore rarely used; nevertheless, it does enable the non-invasive and accurate measurement of GT.
Few reports have been published regarding whether measured GT is associated with probe visibility (PV) as assessed using a periodontal probe [13]. Although gingival biotype classification is closely related to the morphological features of the tooth and periodontium [14], most clinicians prefer to use a periodontal probe to assess GT.
The primary purpose of this study was to assess whether periodontal PV can be used to accurately evaluate the GT around the maxillary central incisors. The secondary aim was to identify the periodontal biotype and related factors using cluster analysis based on various morphological characteristics.
MATERIALS AND METHODS
This observational, cross-sectional study of the relationship between PV and GT was approved by the Institutional Review Board (IRB) of Asan Medical Center and was conducted at the Department of Periodontics at Asan Medical Center (IRB No. 2012-0119). All participants provided written informed consent in accordance with the Declaration of Helsinki.
Participants
The study included 90 Koreans who were 16–40 years of age and had all of their maxillary anterior teeth, with a probing depth (PD) of ≤4 mm. The exclusion criteria were: 1) crown restorations or fillings involving the incisal edge on both maxillary central incisors, 2)
attrition or abrasion of the maxillary central incisors, and 3) use of medications with any known effect on the periodontal soft tissues in the previous year (for example, non-steroidal anti-inflammatory drugs, antibiotics, immunosuppressants, and calcium channel blockers).
Sample size calculation
The minimal sample size required to ensure adequate power was calculated using a method adopted in a previous study involving the same ultrasonic device used in this study (Krupp SDM®, Austenal Medizintechnik, Cologne, Germany) [15]. The standard deviations of the thin and thick groups were 0.25 and 0.30, respectively. An alpha level of 0.05 and a power of 0.9 were used to calculate the sample size needed to detect the difference between the groups. The required minimum sample size was 32 subjects, and the target sample size was set at 90 subjects for cluster analysis.
Clinical examination
Seven clinical parameters for both maxillary central incisors were systematically recorded by a single examiner (J. P.) (Figure 1).
1) Clinical photographs of the maxillary anterior teeth (frontal view) were obtained and stored for the record.
2) PV was evaluated by probing the mid-facial sulcus. We determined whether the outline of the underlying probe (CPU 15UNC, Hu-Friedy, Chicago, IL, USA) at the base of the sulcus was visible through the gingival margin [6]. Each subject was assigned a PV score as follows [14]:
0: visible at both central incisors 1: visible at 1 central incisor
2: not visible at either central incisor
3) PD was measured to the nearest 0.5 mm at the mid-facial point for both central incisors.
4) Gingival width (GW) was measured to the nearest 0.5 mm at the mid-facial point for both central incisors using a periodontal probe. This parameter was defined as the distance from the free gingival margin to the mucogingival junction. The average of the values obtained from both central incisors was used in the analysis.
5) Papilla height (PH) was assessed at the mesial aspect of both central incisors using the same periodontal probe that was used to measure GW. The distance from the top of the
PD PV
PH CW
CL
Figure 1. Measurement of the clinical morphometric characteristics of the maxillary central incisors.
PD: probing depth, PV: probe visibility, PH: papilla height, CW: crown width, CL: crown length.
papilla to a line connecting the mid-facial soft-tissue margin of the 2 central incisors was measured to the nearest 0.5 mm [5].
6) GT was measured with an ultrasonic device at the marginal gingiva of both central incisors, 2 mm apical to the mid-facial gingival margin. The measurement was performed 6 times per site; the highest and lowest values were excluded, and the average of the 4 remaining values was taken and used in the analysis, in accordance with previous studies [10].
7) The ratio of crown width to crown length (CW/CL) for both central incisors was assessed according to the methods described by Olsson and Lindhe [16]. CL was measured from the incisal edge of the crown to the free gingival margin or, if discernible, the cemento- enamel junction at the mid-facial point. Values were recorded to the nearest 0.1 mm using a caliper. The crown was divided into 3 equal portions along its length, and the CW was measured at the junction of the middle and cervical regions.
Intra-examiner repeatability
PT and GT were re-examined by the same clinician after 2 weeks for 1 randomly-selected subject out of every 10 volunteers (n=9 in total). The intra-examiner reliability for GT as measured with the ultrasonic device was assessed using the intraclass correlation coefficient, and repeated measurements of PV were evaluated using the Cohen kappa coefficient.
Statistical analysis
For all continuous variables, means and standard deviations were calculated for each subject. The frequency distribution of GT was analyzed by means of percentile agreement.
Differences in the PV score and GT between male and female participants were tested using analysis of variance (ANOVA), the χ2 test, or the independent-samples t-test. The capacity of PV to estimate GT was assessed via comparison with direct measurements made using an ultrasonic device, and this capacity was reported as the area under the receiver operating characteristic curve (ROC-AUC).
Multivariate analysis using multinomial baseline-category logistic regression was performed to investigate the association between the PV score and the following clinical explanatory variables: sex, GT, PD, PH, GW, and CW/CL.
Hierarchical clustering, widely applied in cluster analysis, was used to classify the gingival biotype of each patient. Several algorithms are available for merging clusters, of which the method described by Ward [17] was chosen. Agglomerative hierarchical cluster analysis was performed to identify groups with similar values for PD, PH, GW, and CW/CL. Before analysis, all parameters were standardized so as not to affect the squared Euclidean distance.
Each case was initially treated as a separate cluster (i.e., equal numbers of clusters and cases), and cases were then combined sequentially into new clusters. This process was repeated until only 1 cluster remained. The similarity measure (squared Euclidean distance) and clustering algorithm (Ward) are both commonly used and known to be efficient at hierarchical clustering. Semi-partial R square, pseudo-F statistics, and pseudo-t2 statistics were used to determine the optimal number of clusters.
Clusters were compared with regard to PD, PH, GW, and CW/CL. Differences between clusters were assessed using ANOVA or the χ2 test. Statistical analyses were performed using SAS 9.2 software (SAS Institute Inc., Cary, NC, USA). A P value <0.05 was considered to indicate statistical significance.
RESULTS
Study subjects
In total, 90 periodontally healthy participants (46 male and 44 female) were recruited for the study. The mean age was 29.7 years (range, 16–40 years).
Intra-examiner repeatability
The reliability of the silent drive motor measurements was consistently very high (intraclass correlation test, P=0.939). The repeatability of the PV assessment was assessed using the Cohen kappa statistic. The reproducibility was verified as substantial, with a kappa value of 0.61 (P=0.026).
Frequency distribution of PV score
With regard to stratification by PV score, 21 subjects (23.3%) had a score of 0, 21 subjects (23.3%) had a score of 1, and 48 subjects (53.3%) had a score of 2 (Table 1).
The distribution of men and women was not equal between the PV groups (Pearson χ2 test, P<0.003). More than half of the men (65%) had a PV score of 2 compared with 41% of women; in addition, 39% of women had a PV score of 0 compared with only 8.7% of men.
Relationships between PV score and morphological parameters
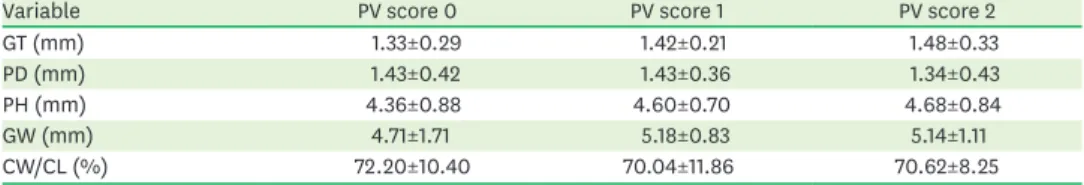
The baseline characteristics of 5 clinical parameters of the study subjects, grouped by PV score, are presented in Table 2. The group with a PV score of 0 had relatively low GT, PH, and GW values and a relatively high CW/CL. However, none of the morphological variables (PD, PH, GW, or CW/CL) were significantly related to the PV score (P>0.05).
Relationships between PV score and GT
The mean GT values in the PV=0, PV=1, and PV=2 groups, respectively, were 1.33 mm, 1.42 mm, and 1.48 mm (total mean, 1.43 mm). No significant difference in GT was found among groups (1-way ANOVA, P=0.152) (Table 2). The mean GT for men was 1.50 mm, while that for women was 1.38 mm; the difference between these values was not statistically significant (Student t-test, P=0.138).
Table 1. Frequency distribution of PV score for 90 subjects
Variable PV score 0 PV score 1 PV score 2
Male 4 (8.7) 12 (26.1) 30 (65.2)
Female 17 (38.6) 9 (20.5) 18 (40.9)
Total 21 (23.3) 21 (23.3) 48 (53.3)
Values are presented as number (%).
PV: probe visibility.
Table 2. Baseline morphological characteristics, grouped by PV score
Variable PV score 0 PV score 1 PV score 2
GT (mm) 1.33±0.29 1.42±0.21 1.48±0.33
PD (mm) 1.43±0.42 1.43±0.36 1.34±0.43
PH (mm) 4.36±0.88 4.60±0.70 4.68±0.84
GW (mm) 4.71±1.71 5.18±0.83 5.14±1.11
CW/CL (%) 72.20±10.40 70.04±11.86 70.62±8.25
Data are shown as mean±standard deviation.
PV: probe visibility, PV score 0: probe visible at both central incisors, PV score 1: probe visible at one central incisor, PV score 2: probe visible at neither central incisor, GT: gingival thickness, PD: probing depth, PH: papilla height, GW: gingival width, CW/CL: ratio of crown width to crown length × 100 (%).
The ROC-AUC for PV as measured using an ultrasonic device was 0.63; a cut-off value of 1.38 yielded 66.7% sensitivity and 59.0% specificity (Figure 2). The low ROC-AUC value indicates the presence of a weak inter-relationship between PV and GT; therefore, the derived cut-off value is barely acceptable.
Multivariate analysis
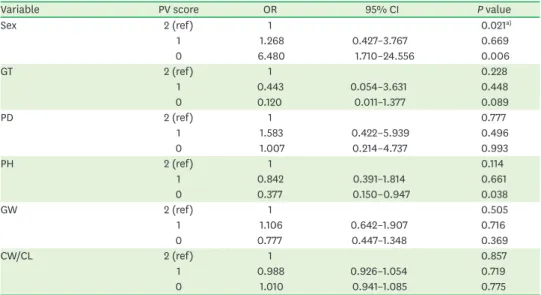
Multivariate analysis was used to model the dependent variable PV score, with sex, GT, PD, PH, GW, and CW/CL as explanatory variables (Table 3). Sex was the only highly significant predictor of PV score (odds ratio, 6.48; 95% CI, 1.71–24.56; P<0.05).
0 0.2 0.4 0.6 0.8 1.0
0.4 0.6 1.0
0.2 0.8
1-Specificity
Sensitivity
Figure 2. ROC curve for the capacity of PV to approximate gingival thickness. The area under the ROC curve for PV using an ultrasonic device was low (0.63).
ROC: receiver operating characteristic, PV: probe visibility.
Table 3. Multivariate multinomial logistic regression analysis
Variable PV score OR 95% CI P value
Sex 2 (ref) 1 0.021a)
1 1.268 0.427–3.767 0.669
0 6.480 1.710–24.556 0.006
GT 2 (ref) 1 0.228
1 0.443 0.054–3.631 0.448
0 0.120 0.011–1.377 0.089
PD 2 (ref) 1 0.777
1 1.583 0.422–5.939 0.496
0 1.007 0.214–4.737 0.993
PH 2 (ref) 1 0.114
1 0.842 0.391–1.814 0.661
0 0.377 0.150–0.947 0.038
GW 2 (ref) 1 0.505
1 1.106 0.642–1.907 0.716
0 0.777 0.447–1.348 0.369
CW/CL 2 (ref) 1 0.857
1 0.988 0.926–1.054 0.719
0 1.010 0.941–1.085 0.775
Baseline category indicated by (ref).
PV: probe visibility, OR: odds ratio, CI: confidence interval, PV score 0: probe visible at both central incisors, PV score 1: probe visible at 1 central incisor, PV score 2: probe visible at neither central incisor, ref: reference, GT:
gingival thickness, PD: probing depth, PH: papilla height, GW: gingival width, CW/CL: ratio of crown width to crown length × 100 (%).
a)Sex was the only significant predictor of PV.
Cluster analysis
Cluster analysis was based on the morphometric parameters of PD, PH, GW, and CW/CL.
Two clusters were created as a result of the clustering procedures. Table 4 presents descriptive features of each cluster. Cluster A comprised 50 participants (28 male and 22 female), whereas cluster B consisted of 40 participants (18 male and 22 female).
Clusters A and B differed significantly in terms of the mean values of PD, PH, GW, and CW/
CL (t-test, P<0.001). Compared with cluster B, cluster A subjects had a more slender tooth form (CW/CL, 65.52% vs. 77.51%), greater PH (4.96 mm vs. 4.11 mm), shallower PD (1.21 mm vs. 1.61 mm), and narrower GW (4.57 mm vs. 5.66 mm). The morphological characteristics of cluster A subjects corresponded to those of what was previously known as the scalloped biotype, whereas those of cluster B subjects corresponded to the flat biotype.
The mean GT of the cluster A (1.36±0.29 mm) subjects was significantly lower than that of the cluster B subjects (1.52±0.29 mm) (Student t-test, P=0.015). However, the PV score was statistically similar between cluster A and B subjects (Student t-test, P=0.583).
DISCUSSION
The present study indicates that the biotype around the maxillary central incisors as assessed by periodontal PV does not accurately reflect GT. Sex was the only significant predictor of periodontal PV. Two morphological periodontal biotypes were identified (scalloped and flat), and these biotypes had different GT values as measured directly using an ultrasonic device.
The finding that periodontal PV does not accurately reflect GT is at odds with results from previous studies in which gingival biotype was determined using this method. Kan et al.
[13] reported that the reliability of a periodontal probe was comparable with that of direct measurements using calipers after tooth extraction, and they suggested gingival biotype classification by millimeters of GT. Differences in measurement procedures, probe color, and study design, along with the absence of a supporting tooth, may explain the discrepancy between our results and those of Kan et al. [13]
The finding that sex was the only significant predictor of periodontal PV is supported by De Rouck et al. [14] Factors including a lighter skin color may explain the greater transparency Table 4. Morphological characteristics of clusters A and B
Variable Cluster P value
A (n=50) B (n=40)
PD 1.21±0.37 1.61±0.35 <0.000
PH 4.96±0.74 4.11±0.66 <0.000
GW 4.57±0.91 5.66±1.30 <0.000
CW/CL 65.52±8.33 77.51±6.47 <0.000
GT 1.36±0.29 1.52±0.29 0.015
PV score 0.583
2 29 (60.42) 19 (39.58)
1 11 (52.38) 10 (47.62)
0 10 (47.62) 11 (52.38)
Data are shown as mean±standard deviation or number (%).
PD: probing depth, PH: papilla height, GW: gingival width, CW/CL: ratio of crown width to crown length × 100 (%), GT: gingival thickness, PV: probe visibility, PV score 0: probe visible at both central incisors, PV score 1:
probe visible at 1 central incisor, PV score 2: probe visible at neither central incisor.
of gum tissue in women than in men. Skin color is affected by the quantity and structure of melanin pigments, blood vessel distribution, and non-melanin pigments such as hemoglobin. The skin color of normal Asian subjects as measured by spectrophotometry, as well as melanin and erythema indexes, are significantly higher in men than in women [18]. Hemoglobin is red, and its concentration is thought to contribute significantly to gingival transparency. Feiner et al. [19] reported that ethnicity and sex were predictive of errors in pulse oximetry, primarily because women tend to have lower hemoglobin levels than men; however, it was not possible to separate the contributions of sex from those of low hemoglobin. From an optical perspective, this may explain our finding of greater PV in female subjects.
Our finding of 2 different morphological groups, scalloped and flat, is consistent with existing knowledge of periodontal biotypes. De Rouck et al. [14] previously reported that 3 clusters (thin-scalloped, thick-scalloped, and thick-flat) encompassed 2 morphologically different groups, the subgroups of which are determined by PV. Interestingly, this study showed that GT, as measured directly using an ultrasonic device, differs significantly between morphological clusters, albeit by the very small amount of 0.2 mm. Therefore, it is not unreasonable to hypothesize that an association exists between GT and tooth morphology.
Cluster analysis based on GT (as measured using an ultrasonic device), GW, and CW/CL in 42 subjects resulted in 3 clusters: normal thickness-normal crown ratio, thick-quadratic tooth, and an unknown combination [7]. The third group was subsequently revised according to GW. This finding supports the proposed hypothesis of an association between GT and tooth morphology. However, in the current study, it was found that periodontal PV is unrelated to patient group clustered by morphological characteristics, suggesting that PV does not always correspond to gingival biotype.
Several groups have measured GT around the maxillary central incisors using an ultrasonic device [7,11,15,20,21]. The mean GT in the current study (1.43 mm) was greater than that reported previously; for example, 1.28 mm was reported in a study conducted in Germany [7], and 1.2 mm was reported in a Korean population [20]. However, our measured value is comparable to that acquired previously using a syringe needle (1.46 mm) [5]. Variations in pressure applied to the gingiva when taking measurements, in the angle formed between the rounded gingival surface and the measuring probe, and in the amount of water used as a medium are all potential sources of variability that may account for the discrepancies between studies.
Recently, gingival biotypes have been assessed radiographically using cone-beam computed tomography (CBCT) scans [22,23]; the results were used to evaluate whether any association exists between periodontal treatment outcome and anatomical characteristics [24,25].
However, these studies also acknowledged the limitations and paucity of data regarding the accuracy of the various techniques used to measure tissue thickness, including CBCT.
The present study does have some limitations. First, GT may vary within subjects at different sites in the mouth, as indicated by the high proportion of subjects with a PV score of 1. This implies that the gingival biotype determined at 1 specific site is not necessarily representative of the overall gingival biotype. Second, our periodontal PV observations may be affected by relatively weak intra-examiner measurement repeatability. For a number of subjects, PV was difficult to determine because the probe was only recognizable in the coronal part of the sulcus. PV was determined when the outline of the probe, including the apex, could be
identified; therefore, gingival biotype determination using a periodontal probe is affected by each examiner's subjective decision-making [26]. To counteract this, Cook et al. [27] limited the classification of PV into just 2 groups: thin and thick/average.
In conclusion, periodontal PV is not related to GT as measured directly using an ultrasonic device. Sex was the only highly significant predictor of periodontal PV. The presence of a significant correlation between GT and morphological characteristics of the periodontium was confirmed. Clinically, measuring the more accurate GT instead of PV and considering the relevant morphological features can enable the proper determination of gingival biotype.
ACKNOWLEDGEMENTS
The authors would like to thank Min-Ju Kim (Department of Clinical Epidemiology and Biostatistics, Asan Medical Center) for the valuable help with statistical analyses.
REFERENCES
1. Ochsenbein C, Ross S. A reevaluation of osseous surgery. Dent Clin North Am 1969;13:87-102.
PUBMED
2. Claffey N, Shanley D. Relationship of gingival thickness and bleeding to loss of probing attachment in shallow sites following nonsurgical periodontal therapy. J Clin Periodontol 1986;13:654-7.
PUBMED | CROSSREF
3. Seibert JS, Lindhe J. Esthetics and periodontal therapy. In: Lindhe J, editor. Textbook of clinical periodontology. 2nd ed. Copenhagen: Munksgaard; 1989. p.477-514.
4. Kao RT, Pasquinelli K. Thick vs. thin gingival tissue: a key determinant in tissue response to disease and restorative treatment. J Calif Dent Assoc 2002;30:521-6.
PUBMED
5. Olsson M, Lindhe J, Marinello CP. On the relationship between crown form and clinical features of the gingiva in adolescents. J Clin Periodontol 1993;20:570-7.
PUBMED | CROSSREF
6. Kan JY, Rungcharassaeng K, Umezu K, Kois JC. Dimensions of peri-implant mucosa: an evaluation of maxillary anterior single implants in humans. J Periodontol 2003;74:557-62.
PUBMED | CROSSREF
7. Müller HP, Eger T. Gingival phenotypes in young male adults. J Clin Periodontol 1997;24:65-71.
PUBMED | CROSSREF
8. Müller HP, Eger T, Schorb A. Gingival dimensions after root coverage with free connective tissue grafts. J Clin Periodontol 1998;25:424-30.
PUBMED | CROSSREF
9. Müller HP, Schaller N, Eger T. Ultrasonic determination of thickness of masticatory mucosa: a methodologic study. Oral Surg Oral Med Oral Pathol Oral Radiol Endod 1999;88:248-53.
PUBMED | CROSSREF
10. Chang MT, Kim HS, Lee KW. A study on the reliability of an ultrasonic measurement device(SDM). J Korean Acad Periodontol 2000;30:483-8.
11. Müller HP, Barrieshi-Nusair KM, Könönen E. Repeatability of ultrasonic determination of gingival thickness. Clin Oral Investig 2007;11:439-42.
PUBMED | CROSSREF
12. Eghbali A, De Bruyn H, Cosyn J, Kerckaert I, Van Hoof T. Ultrasonic assessment of mucosal thickness around implants: validity, reproducibility, and stability of connective tissue grafts at the buccal aspect.
Clin Implant Dent Relat Res 2016;18:51-61.
PUBMED | CROSSREF
13. Kan JY, Morimoto T, Rungcharassaeng K, Roe P, Smith DH. Gingival biotype assessment in the esthetic zone: visual versus direct measurement. Int J Periodontics Restorative Dent 2010;30:237-43.
PUBMED
14. De Rouck T, Eghbali R, Collys K, De Bruyn H, Cosyn J. The gingival biotype revisited: transparency of the periodontal probe through the gingival margin as a method to discriminate thin from thick gingiva. J Clin Periodontol 2009;36:428-33.
PUBMED | CROSSREF
15. Müller HP, Heinecke A, Schaller N, Eger T. Masticatory mucosa in subjects with different periodontal phenotypes. J Clin Periodontol 2000;27:621-6.
PUBMED | CROSSREF
16. Olsson M, Lindhe J. Periodontal characteristics in individuals with varying form of the upper central incisors. J Clin Periodontol 1991;18:78-82.
PUBMED | CROSSREF
17. Ward JH Jr. Hierarchical grouping to optimize an objective function. J Am Stat Assoc 1963;58:236-44.
CROSSREF
18. Yun IS, Lee WJ, Rah DK, Kim YO, Park BY. Skin color analysis using a spectrophotometer in Asians. Skin Res Technol 2010;16:311-5.
PUBMED | CROSSREF
19. Feiner JR, Severinghaus JW, Bickler PE. Dark skin decreases the accuracy of pulse oximeters at low oxygen saturation: the effects of oximeter probe type and gender. Anesth Analg 2007;105:S18-23.
PUBMED | CROSSREF
20. Kang CH, Chang MT, Ryu SH, Kim HS. A study on keratinized gingival thickness in healthy Korean adults. J Korean Acad Periodontol 2000;30:179-85.
21. Eger T, Müller HP, Heinecke A. Ultrasonic determination of gingival thickness. Subject variation and influence of tooth type and clinical features. J Clin Periodontol 1996;23:839-45.
PUBMED | CROSSREF
22. Fu JH, Yeh CY, Chan HL, Tatarakis N, Leong DJ, Wang HL. Tissue biotype and its relation to the underlying bone morphology. J Periodontol 2010;81:569-74.
PUBMED | CROSSREF
23. Han JY, Jung GU. Labial and lingual/palatal bone thickness of maxillary and mandibular anteriors in human cadavers in Koreans. J Periodontal Implant Sci 2011;41:60-6.
PUBMED | CROSSREF
24. Kim JH, Cho YJ, Lee JY, Kim SJ, Choi JI. An analysis on the factors responsible for relative position of interproximal papilla in healthy subjects. J Periodontal Implant Sci 2013;43:160-7.
PUBMED | CROSSREF
25. Sin YW, Chang HY, Yun WH, Jeong SN, Pi SH, You HK. Association of gingival biotype with the results of scaling and root planing. J Periodontal Implant Sci 2013;43:283-90.
PUBMED | CROSSREF
26. Eghbali A, De Rouck T, De Bruyn H, Cosyn J. The gingival biotype assessed by experienced and inexperienced clinicians. J Clin Periodontol 2009;36:958-63.
PUBMED | CROSSREF
27. Cook DR, Mealey BL, Verrett RG, Mills MP, Noujeim ME, Lasho DJ, et al. Relationship between clinical periodontal biotype and labial plate thickness: an in vivo study. Int J Periodontics Restorative Dent 2011;31:345-54.
PUBMED