Developmental venous anomaly (DVA), which is also called venous angioma, is the most common cerebral vascular malformation (1, 2). DVA exhibits radially arranged, dilated veins (so-called caput medusae) that drain into an enlarged transcortical or a subependymal collecting vein (3). DVA is usually asymptomatic and it’s often incidentally found on contrast-enhanced (CE) CT or MR imaging. Recent investigations have reported that parenchymal signal abnormality on T2/FLAIR MR imaging could be
INTRODUCTION
�Received; May 15, 2014�Revised; August 5, 2014
�Accepted; September 11, 2014
Corresponding author : Dae Seob Choi, M.D.
Department of Radiology, Gyeongsang National University Hospital, Gyeongsang National University School of Medicine, 90 Chilam-dong, Jinju 660-702, Korea.
Tel. 82-55-750-8211, Fax. 82-55-758-1568 E-mail : [email protected]
This is an Open Access article distributed under the terms of the Creative Commons Attribution Non-Commercial License (http://creativecommons.org/licenses/by- nc/3.0/) which permits unrestricted non-commercial use, distribution, and reproduction in any medium, provided the original work is properly cited.
Susceptibility-Weighted MR Imaging for the Detection of Developmental Venous Anomaly: Comparison with T2 and FLAIR Imaging
Soo Bueum Cho1, Dae Seob Choi1,2, Hyeon Gyu Ryu1, Hwa Seon Shin1, Ji-Eun Kim1, Hye Young Choi1, Mi Jung Park1, Ho Cheol Choi1, Seungnam Son3
1Department of Radiology, 2Gyeongsang Institute of Health Science, and 3Department of Neurology, Gyeongsang National University School of Medicine, Jinju, Korea
Purpose : We evaluated the diagnostic value of susceptibility-weighted imaging (SWI) for the detection of developmental venous anomaly (DVA).
Materials and Methods: Retrospective review of 1068 brain MR examinations found 28 DVAs in 28 patients (2.6%) on contrast-enhanced T1-weighted images. SWI, T2, and FLAIR images of 28 patients with DVA and 28 sex- and age- matched control patients without DVA were analyzed by blinded readers on each type of sequences. All images were independently reviewed by two radiologists who were blinded to other MR imaging finding. In cases of discrepancy, two reviewers reached a consensus later. The sensitivity, specificity, positive predictive value (PPV), and negative predictive value (NPV) of each MR sequence for the detection of DVA were determined. Statistical analysis was performed by using the Mcnemar test. The significance level was p < 0.05.
Results: The sensitivity, specificity, PPV, and NPV of SWI for the detection of DVA were 85.7%, 92.9%, 92.3%, and 86.7%, respectively. T2 and FLAIR images showed sensitivity of 35.7% and 35.7%, specificity of 92.9% and 96.4%, PPV of 83.3% and 90.9%, and NPV of 59.1% and 60.0%, respectively. On SWI, the sensitivity and NPV for the detection of DVAs were significantly higher than those of T2 and FLAIR images (p < 0.05).
Conclusion: SWI was sensitive and specific for the detection of DVA.
Index words : Cerebral developmental venous anomaly∙Magnetic resonance (MR) Susceptibility-weighted imaging (SWI)
Original Article
associated in 7.8-54.1% of DVAs (4-6). Most of the brain lesions usually show parenchymal signal abnormalities on T2/FLAIR MR imaging, CE study is needed for the characterization of the lesions.
However, the CE study increases scan time and cost.
Because the gadolinium MR contrast agent may also result in complications such as nephrogenic systemic fibrosis, the CE MR examination is contraindicated in patients with severe renal dysfunction (7). At many institutions, CE study is performed in the limited cases, in which neoplastic or inflammatory lesions are suspected. If we can detect most of the DVAs with MR sequences without CE, CE study may be omitted.
Susceptibility-weighted imaging (SWI) is a highly sensitive MR technique for the visualization of the cerebral veins and venous anatomy and it is also useful for the detection and demonstration of the prominent veins in various pathologic conditions (8- 10, 11). By using paramagnetic deoxy-Hb in the cerebral veins as an intrinsic contrast agent, SWI can depict the normal cerebral veins and cerebral venous pathology (10, 12, 13). However, as we know, the usefulness of SWI for the demonstration of DVA was mentioned only in the pictorial essays or review articles and there has been no original article only for the DVAs.
The goal of this study was to evaluate the diagnostic value of SWI compared with T2-weighted and FLAIR images for the detection of DVA.
Patients
Between January 2012 and December 2012, 1068
patients underwent brain MR examinations with SWI and contrast enhancement. With a retrospective review of their MR imaging, DVAs were identified in 28 patients (2.6%) on CE T1-weighted images. There were 17 males and 11 females, aged from 19 to 92 years (mean, 59.1 years). Sex and age-matched 28 patients without DVA were chosen as a control group [17 males and 11 females, aged from 19 to 92 years (mean, 59.1 years)].
MR imaging protocol
All MR examinations were performed at a 1.5 Tesla MR scanner (Magnetom Avanto, Siemens Medical solutions, Erlangen, Germany). MR protocol consisted of T2-weighted imaging, fluid-attenuated inversion recovery (FLAIR), T1-weighted imaging, SWI, and CE T1-weighted imaging, respectively (Table 1).
SWI was acquired by using a fully velocity-compen- sated (with gradient moment nulling in all three
MATERIALS AND METHODS
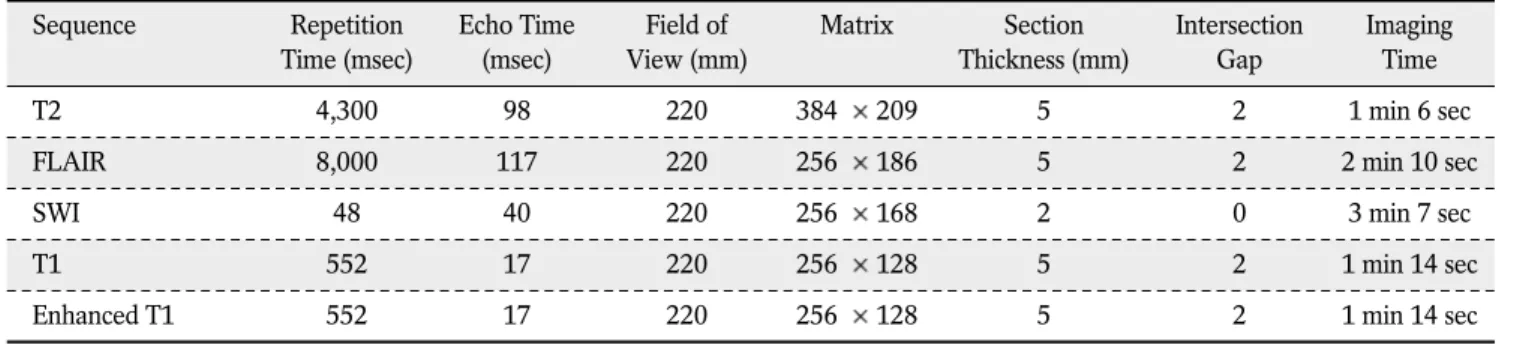
Table 1. MR Imaging Protocol
Sequence Repetition Echo Time Field of Matrix Section Intersection Imaging
Time (msec) (msec) View (mm) Thickness (mm) Gap Time
T2 4,300 98 220 384 209 5 2 1 min 6 sec
FLAIR 8,000 117 220 256 186 5 2 2 min 10 sec
SWI 48 40 220 256 168 2 0 3 min 7 sec
T1 552 17 220 256 128 5 2 1 min 14 sec
Enhanced T1 552 17 220 256 128 5 2 1 min 14 sec
Note. DWI = diffusion-weighted image, FLAIR = fluid-attenuated inversion recovery, SWI = susceptibility-weighted image.
Table 2. SWI, T2WI and FLAIR for the detection of DVAs
Sequences Enhanced T1 (+) Enhanced T1 (-) Total
SWI (+) 24 02 26
SWI (-) 04 26 30
Total 28 28 56
T2WI (+) 10 02 12
T2WI (-) 18 26 44
Total 28 28 56
FLAIR (+) 10 01 11
FLAIR (-) 18 27 45
Total 28 28 56
Note. SWI = susceptibility-weighted image, T2WI = T2- weighted image, FLAIR = fluid-attenuated inversion recovery.
orthogonal directions), three-dimensional, GRE sequence with the following parameters: repetition time (TR) = 48 ms, echo time (TE) = 40 ms, flip angle (FA) = 15 , bandwidth = 80 kHz, slice thickness = 2 mm, with 64 slices in a single slab, matrix size = 256 168. The acquisition time was 3 minutes and 7 seconds with the use of iPAT factor 2. All images were obtained in the same axial plane. Subsequently, 2-mm minIP images were generated. The sequence, along with entire image processing, was automated on Siemens MR scanner platforms. The SWI and minIP images were uploaded and made available on the picture archiving and communication (PACS) system.
Image analysis
SWI, T2, and FLAIR images of the patients and control groups were analyzed by blinded readers on each type of sequences. All images were reviewed independently by two radiologists who were blinded to other MR imaging. In cases of discrepancy, two reviewers reached a consensus later. The diagnostic criteria of DVA were radially arranged, dilated veins that drain into an enlarged transcortical or a subependymal collecting vein.
Statistical analysis
The sensitivity, specificity, positive predictive value (PPV), and negative predictive value (NPV) of each
a b
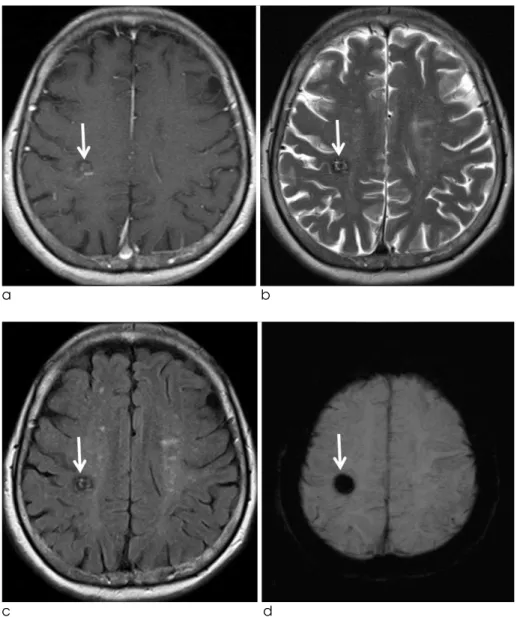
Fig. 1. A 45-years-old male patient with DVA. Enhanced T1-weighted image (a) and SWI (b) show a DVA in the right frontal lobe (arrow). On T2 (c) and FLAIR (d) images, there is no definite abnormality in the right frontal lobe.
c d
MR sequence for the detection of DVA were determined. Statistical analysis was performed by using the Mcnemar test. The significance level was p <
0.05.
In the 28 patients group, 24 (85.7%) DVAs were in any lobes of the supratentorial brain and four (14.3%) were in the cerebellum.
Among 28 DVAs, 24 (85.7%) were detected on SWI (Figs. 1, 2). In 28 control patients without DVA, SWI showed true negative in 26 (92.9%) and false positive in two (Table 2). T2-weighted images detected 10 (35.7%) of 28 DVAs (Fig. 2). Among 28 control patients, T2-weighted images showed true negative in 26 (92.9%). There were two false positive and two false negative cases for the detection of DVAs on T2- weighted images (Table 2). On the other hand, FLAIR images showed true positive in 10 (35.7%) (Fig. 2), false positive in one, true negative in 27 (96.4%), and RESULTS
a b
Fig. 2. A 48-years-old male patient with DVA. Enhanced T1 (a), SWI (b), T2 (c), and FLAIR (d) images show a DVA in the right temporal lobe (arrow).
However, the lesion is less clearly demonstrated on T2 (c) and FLAIR (d) images than on SWI.
c d
false negative in 18, respectively (Table 2).
The sensitivity, specificity, PPV, and NPV of SWI for the detection of DVA were 85.7%, 92.9%, 92.3%, and 86.7%, respectively. T2 and FLAIR images showed sensitivity of 35.7% and 35.7%, specificity of 92.9% and 96.4%, PPV of 83.3% and 90.9%, NPV of 59.1% and 60.0%, respectively. On SWI, sensitivity and NPV for the detection of DVAs were significantly higher than those of T2 and FLAIR images (p < 0.05).
In the initial assessment for the detection of DVA, each reader showed the same result in 51 patients for T2, 48 for FLAIR, and 47 for SWI, respectively. Inter- observer agreement rate between each reader was 91.1% for T2, 85.7% for FLAIR, and 83.9% for SWI, respectively.
Four categories are classified in the cerebral vascular malformations: arteriovenous malformation, capillary telangiectasia, DVA, and cavernous angioma (CA) (14-16). Of these, DVA is the most common, with a 2.6% incidence in 4069 brain autopsies (2). In our study, DVAs were demonstrated in 28 (2.6%) of 1068 patients, which is similar to those of the previous reports (2, 17).
In the present study, SWI sensitively detected DVA with high sensitivity (85.7%) and high specificity (92.9%). The sensitivity of SWI for the detection of DVA was superior to those of T2 and FLAIR images (35.7%, respectively) (Table 2). Regarding the
DISCUSSION
a b
Fig. 3. A 77-years-old female patient with mixed angioma (DVA and cavernous angioma). Enhanced T1 (a), T2 (b), FLAIR (c), and SWI (d) images show a hemorrhagic lesion with heterogeneous signal intensity (suggestive of cavernous angioma) in the right parietal lobe (arrow). On enhanced T1-weighted image (a), there is also an enhancing DVA adjacent to the hemorrhagic lesion. However, the DVA is not demonstrated on other MR sequences.
c d
specificity, all of SWI, T2 and FLAIR images showed high specificity (92.9%, 92.9%, and 96.4%, respec- tively) (Table 2). There have been several reports that SWI was used for the evaluation of cerebral vascular malformations. Several types of vascular malforma- tions with slow venous flow are better visualized with SWI, including DVA, CA, and capillary telangiectasia (18-20). SWI is a high-spatial resolution, three- dimensional, gradient-echo (GRE) MR technique which maximizes sensitivity to magnetic susceptibility effects (12, 13). Deoxyhemoglobin (deoxy-Hb) in the cerebral vein, being paramagnetic with four unpaired electrons, generates magnetic fields that are additively combined with the external magnetic field (12, 13, 21). SWI uses paramagnetic deoxy-Hb in the cerebral vein as an intrinsic contrast agent, and it is useful for the demonstration of the cerebral venous anatomy
(10, 12). Because DVA is a normal variation of the transmedullary vein, it usually shows similar flow velocity and deoxy-Hb concentration to the normal cerebral vein. On SWI, DVA is demonstrated as a signal void lesion with the normal cerebral veins (Figs.
1, 2).
DVAs can be associated with CAs in 13% to 40% of cases in which CA is typically located in the region of the caput medusae (15, 22). CA is a low pressure and slow-flow vascular malformation associated with intralesional hemorrhages at various stages of evolution. On MR, a typical CA appears as a well circumscribed lesion of mixed signal intensity on T1- and T2-weighted sequences, with a hypointense rim corresponding to hemosiderin deposition and charac- teristic “blooming effect” resulting from the suscepti- bility dephasing effect caused by hemosiderin.
a b
Fig. 4. A 61-years-old female patient with parenchymal hemorrhage. SWI (a) shows a tubular signal void lesion in the right frontal lobe (arrow). On enhanced T1 (b), T2 (c), and FLAIR (d) images, the lesion is shown as linear signal abnormality (arrow).
c d
According to the recent reports, SWI could sensitively detect CA compared to T2-weighted spin-echo and GRE images (23, 24). In our study, four CAs were associated within the region of DVAs (14.3%) and they were most prominently demonstrated on SWI (Fig. 3).
Although DVAs are usually asymptomatic and there was no symptomatic case in our study, DVAs can be symptomatic. A prospective study by McLaughlin et al. showed that symptomatic hemorrhagic risk was 0.34% per year in their patients with DVAs (25).
Associated CAs may cause symptomatic hemorrhage.
Ischemic or hemorrhage infarction is also associated with DVAs (15-17). Venous hypertension due to thrombosis or stenosis of the collecting vein is the underlying mechanism leading to symptomatic infarc- tion or asymptomatic parenchymal signal abnormali- ties in DVAs. In cases of no demonstrable stenosis, partial thickening of the veins forming the DVA may also contribute to the development of venous hypertension by reducing the size and compliance of the vessel lumen, increasing the resistance to flow, and diminishing the vessel’s capacity to adapt to pressure modifications (15). In a recent study that evaluated diffusion and perfusion-weighted MR imaging in patients with parenchymal signal abnormalities associ- ated with DVAs, the signal abnormalities around DVAs showed increased ADC, increased cerebral blood volume, and delayed mean transit time and time-to- peak to those of the contralateral normal portions, respectively. They concluded that the parenchymal signal abnormalities associated with DVA were caused by vasogenic edema with congestion and delayed perfusion (26). In our study. The parenchymal signal abnormalities in the DVA drainage area were associ- ated in seven patients (25.0%), which is similar to those of the previous reports (4-6). Among the seven DVAs with parenchymal signal abnormalities, six (85.7%) were detected on SWI. We think that SWI has potential for the detection of DVAs in patients who have hemorrhagic lesions or parenchymal signal abnormalities associated with DVAs without CE study.
In our study, SWI showed false positive in two cases.
In the retrospective review, a prominent normal cerebral vein was misdiagnosed as a DVA in one and a linear parenchymal hemorrhage in the other, respec- tively (Fig. 4).
Limitation of the present study is that there may have been selection and verification biases because our study was a retrospective study.
In conclusion, SWI was sensitive and specific for the detection of DVA.
References
1. Lasjaunias P, Burrows P, Planet C. Developmental venous anomalies (DVA): the so-called venous angioma. Neurosurg Rev 1986;9:233-242
2. Sarwar M, McCormick WF. Intracerebral venous angioma. Case report and review. Arch Neurol 1978;35:323-325
3. Truwit CL. Venous angioma of the brain: history, significance, and imaging findings. AJR Am J Roentgenol 1992;159:1299- 1307
4. Takasugi M, Fujii S, Shinohara Y, Kaminou T, Watanabe T, Ogawa T. Parenchymal hypointense foci associated with developmental venous anomalies: evaluation by phase-sensitive MR imaging at 3T. AJNR Am J Neuroradiol 2013;34:1940- 1944
5. Santucci GM, Leach JL, Ying J, Leach SD, Tomsick TA. Brain parenchymal signal abnormalities associated with developmen- tal venous anomalies: detailed MR imaging assessment. AJNR Am J Neuroradiol 2008;29:1317-1323
6. San Milla′n Ru′lz D, Delavelle J, Yilmaz H, et al. Parenchymal abnormalities associated with developmental venous anomalies.
Neuroradiology 2007;49:987-995
7. Daftari Besheli L, Aran S, Shaqdan K, Kay J, Abujudeh H.
Current status of nephrogenic systemic fibrosis. Clin Radiol 2014;69:661-668
8. Huang P, Chen CH, Lin WC, Lin RT, Khor GT, Liu CK. Clinical applications of susceptibility weighted imaging in patients with major stroke. J Neurol 2012;259:1426-1432
9. Santhosh K, Kesavadas C, Thomas B, Gupta AK, Thamburaj K, Kapilamoorthy TR. Susceptibility weighted imaging: a new tool in magnetic resonance imaging of stroke. Clin Radiol 2009;64:74-83
10. Haacke EM, Xu Y, Cheng YC, Reichenbach JR. Susceptibility weighted imaging (SWI). Magn Reson Med 2004;52:612-618 11. Mittal S, Wu Z, Neelavalli J, Haacke EM. Susceptibility-
weighted imaging: technical aspects and clinical applications, part 2. AJNR Am J Neuroradiol 2009;30:232-252
12. Tsui YK, Tsai FY, Hasso AN, Greensite F, Nguyen BV.
Susceptibility-weighted imaging for differential diagnosis of cerebral vascular pathology: a pictorial review. J Neurol Sci 2009;287:7-16
13. Haacke EM, Mittal S, Wu Z, Neelavalli J, Cheng YC.
Susceptibility-weighted imaging: technical aspects and clinical applications, part 1. AJNR Am J Neuroradiol 2009;30:19-30 14. McCormick WF, Boulter TR. Vascular malformations
(“angiomas”) of the dura mater. J Neurosurg 1966;25:309-311 15. Ruiz DS, Yilmaz H, Gailloud P. Cerebral developmental venous
anomalies: current concepts. Ann Neurol 2009;66:271-283 16. San Millan Ruiz D, Gailloud P. Cerebral developmental venous
anomalies. Childs Nerv Syst 2010;26:1395-1406
17. Garner TB, Curling OD Jr, Kelly DL Jr, Laster DW. The natural
history of intracranial venous angiomas. J Neurosurg 1991;75:715-722
18. Lee BC, Vo KD, Kido DK, et al. MR high-resolution blood oxygenation level dependent venography of occult (low-flow) vascular lesions. AJNR Am J Neuroradiol 1999;20:1239-1242 19. Sehgal V, Delproposto Z, Haacke EM, et al. Clinical applications
of neuroimaging with susceptibility-weighted imaging. J Magn Reson Imaging 2005;22:439-450
20. Tong KA, Ashwal S, Obenaus A, Nickerson JP, Kido D, Haacke EM. Susceptibility-weighted MR imaging: a review of clinical applications in children. AJNR Am J Neuroradiol 2008;29:9-17 21. Thomas B, Somasundaram S, Thamburaj K, et al. Clinical
applications of susceptibility weighted imaging of brain-A pictorial review. Neuroradiology 2008;50:105-116
22. Huber G, Henkes H, Hermes M, et al. Regional association of developmental venous anomalies with angiographically occult vascular malformations. Eur Radiol 1996;6:30-37
23. de Souza JM, Domingues RC, Cruz LC Jr, et al. Susceptibility- weighted imaging for the evaluation of patients with familial cerebral cavernous malformations: a comparison with T2- weighted fast spin-echo and gradient-echo sequences. AJNR Am J Neuroradiol 2008;29:154-158
24. de Champfleur NM, Langlois C, Ankenbrandt WJ, et al.
Magnetic resonance imaging evaluation of cerebral cavernous malformations with susceptibility-weighted imaging.
Neurosurgery 2011;68:641-647
25. McLaughlin MR, Kondziolka D, Flickinger JC, Lunsford S, Lunsford LD. The prospective natural history of cerebral venous malformations. Neurosurgery 1998;43:195-200
26. Jung HN, Kim ST, Cha J, et al. Diffusion and perfusion MRI findings of the signal-intensity abnormalities of brain associated with developmental venous anomaly. AJNR Am J Neuroradiol 2014 Mar 20 [Epub ahead of print]
통신저자 : 최대섭, (660-702) 경남 진주시 칠암동 92, 경상대학교병원 영상의학과
Tel. (055) 750-8211, Fax. (055) 758-1568, E-mail: [email protected]
자화율강조 MR영상을 이용한 뇌정맥 기형의 진단:
T2강조영상과 FLAIR영상과의 비교
1경상대학교 의학전문대학원 영상의학교실
2경상대학교 의학전문대학원 건강과학연구원
3경상대학교 의학전문대학원 신경과학교실
조수범1∙최대섭1, 2∙유현규1∙신화선1∙김지은1∙최혜영1∙박미정1∙ 최호철1∙손승남3
목적: 뇌정맥 기형의 발견에 있어 자화율강조 MR영상의 진단적 가치를 평가하고자 하였다.
대상과 방법: 1068명의 뇌MR영상의 후향적 분석에서 조영증강 T1강조영상을 기준으로 28명(2.6%)에서 28개의 뇌정맥 기형이 발견 되었다. 이들과 성별 및 나이가 일치하는 뇌정맥 기형이 없었던 28명을 대조군으로 선정하였다.
모두 48명의 환자군과 대조군의 MR영상을 무작위로 제시하면서 2명의 영상의학과 의사가 독립적으로 분석하였다.
자화율강조영상, T2강조영상, FLAIR영상을 분리하여 각 영상에서 뇌정맥 기형의 존재유무를 판정하였다. 판정에 불 일치가 있는 경우 나중에 합의하여 최종 판단하였다. 뇌정맥 기형의 진단에 있어 각 영상의 민감도, 특이도, 양성예견 율, 음성예견율을 구하였으며, Mcnemar test를 이용하여 통계적 차이를 검정하였다.
결과: 뇌정맥 기형의 발견에 있어 자화율강조 MR영상은 85.7%의 민감도, 92.9%의 특이도, 92.3%의 양성예견율, 86.7%의 음성예견율을 보였다. T2강조영상과 FLAIR영상은 35.7% 와 35.7%의 민감도, 92.9%와 96.4%의 특 이도, 83.3%와 90.9%의 양성예견율, 59.1%와 60.0%의 음성예견율을 각각 보였다. 통계분석에서 자화율강조 MR영상은 T2강조영상과 FLAIR영상과 비교하여 유의하게 높은 민감도와 음성예견율를 보였다.
결론: 뇌정맥 기형의 발견에 있어 자화율강조 MR영상은 높은 민감도와 특이도를 보였다.
대한자기공명의과학회지 18:200-207(2014)