This is an Open Access article distributed under the terms of the Creative Commons At- tribution Non-Commercial License (http://creativecommons.org/licenses/by-nc/3.0/) which permits unrestricted non-commercial use, distribution, and reproduction in any medium, provided the original work is properly cited.
Effects of Aerobic Exercise on Abdominal Fat,
Thigh Muscle Mass and Muscle Strength in Type 2 Diabetic Subject
Hwi Ryun Kwon1, Kyung Wan Min2, Hee Jung Ahn1, Hee Geum Seok1, Bo Kyung Koo3, Ho Chul Kim4, Kyung Ah Han2
1Diabetes Center, Eulji Hospital, Seoul,
2Department of Internal Medicine, Eulji University College of Medicine, Daejeon,
3Department of Internal Medicine, Seoul National University College of Medicine, Seoul,
4Kim Ho Chul Radiology Clinic, Seoul, Korea
Background: Aerobic exercise can effectively reduce visceral fat. However, few studies have examined the effect of daily physical activity on obesity and cardiopulmonary function in the subjects with diabetes. We examined the effect of moderate intensity of walking in obese diabetes patients by monitoring of daily activity and measuring the change in abdominal fat area, muscle are and maximal muscle strength.
Methods: We randomly assigned 27 obese women with type 2 diabetes to an aerobic exercise group (AG, n = 13) and control group (CG, n = 14). The AG performed moderate intensity walking for 60 minutes per exercise, 5 times per week, and for 12 weeks.
The activity energy expenditure was monitored by a multi-record accelerometer. The CG maintained routine daily activities. At the time of the initiation of the study and after 12 weeks of exercise, the aerobic exercise capacity was assessed using oxygen con- sumption rate at anaerobic threshold (VO2-AT). The abdominal fat area and the quadriceps muscle area were measured by com- puted tomography, and the maximum muscle strength of the upper and lower limbs was measured by a chest press and a leg press, respectively.
Results: The mean age of the study subjects was 56.6 ± 8.0 years, the mean duration of diabetes was 6.3 ± 6.0 years, and the body weight index (BMI) was 27.3 ± 2.7 kg/m2. The BMI of the AG was significantly decreased (P = 0.003). In the AG, the visceral fat area and subcutaneous fat area were also significantly decreased (P = 0.018 and P < 0.001, respectively) but not in CG. VO2-AT of the AG was significantly improved, while that of the CG did not change (P = 0.009 and P = 0.115, respectively). The quadriceps muscle mass and the maximal muscle strength of the AG did not change, however, the CG showed a significant decrease. Dura- tion of moderate intensity exercise was correlated with the decrease in total abdominal fat area (r = -0.484; P = 0.011) and that of high intensity exercise was correlated with improvement of cardiopulmonary function (r = 0.414; P = 0.032).
Conclusion: Daily moderate intensity aerobic exercise is effective at reducing abdominal fat mass, while high intensity exercise improves cardiopulmonary function.
Keywords: Abdominal fat; Exercise; Muscle strength; Diabetes mellitus, type 2
Corresponding author: Kyung Ah Han
Department of Internal Medicine, Eulji University College of Medicine, 280-1 Hagye 1-dong, Nowon-gu, Seoul 139-872, Korea
E-mail: [email protected]
pISSN 1976-9180 · eISSN 2093-2650
INTRODUCTION
A daily life pattern of insufficient physical activity can cause obesity, which is a serious worldwide health threat [1]. While
fat accumulates in any part of the body, the associated risks de- pend on the area of the accumulation. In particular, fat in the abdominal organs is closely associated with diabetes, cardio- vascular diseases and other metabolic diseases [2,3]. In males,
abdominal fat increases with age, and in females, it increases noticeably after menopause [4], and the most important cause of accumulation of visceral fat is the lack of exercise and west- ernized diet pattern according to the change in lifestyle [5].
For the prevention and treatment of the type 2 diabetes, the American Diabetes Association (ADA) emphasizes the advan- tage of regular physical activity. The ADA recommends mod- erate physical activity for longer than 30 minutes every day [6], and particularly, for the control of blood glucose, maintenance of body weight (BW), and for the reduction of the risk of car- diovascular diseases, aerobic exercise with the moderate inten- sity of 50 - 70% of the maximal heart beat for longer than 150 minutes per week, and a minimum of more than three times per week has been recommended [7].
Numerous studies have examined the effect of aerobic exer- cise through exercise training. In the study reported by An et al., in obese type 2 diabetes patients who performed aerobic exercise of low intensity at 25 - 39% of the maximal heart rate for 60 minutes, 5 times per week and for 12 weeks, the body fat index was lowered, and cardiopulmonary function was im- proved [8]. In a study conducted on non-obese type 2 diabetes patients, 45 - 60 minutes of walking exercise 5 times per week for 12 weeks significantly improved cardiopulmonary function, but did not have a significant effect on grip strength [9]. In the study reported by Gan et al., obese type 2 diabetes patients who performed 40 minutes of aerobic exercise at an intensity of 55 - 70% of maximal oxygen intake amount, 4 - 5 times per week, had significantly decreased visceral fat mass, and improved car- diopulmonary function [10].
Thus, aerobic exercise can decrease visceral fat more effec- tively than other exercise methods [11]. However, most studies investigated the effect of trained aerobic exercise and few stud- ies have analyzed the effect of aerobic exercise and physical ac- tivity in the daily lives. It is necessary to examine the effect of aerobic exercise, such as walking, in the daily lives of patients.
In the study reported by Kumahara et al. [12], physical activ- ity was monitored with a multi-record accelerometer to obtain objective information and to evaluate the associated energy ex- penditure. In addition, the accelerometer can monitor the ac- tivity intensity, duration and frequency over a long period of time. Therefore, we used a multi-record accelerometer to mon- itor the daily physical activity of obese type 2 diabetes patients who performed daily aerobic exercise of moderate intensity walking and we analyzed the effect of exercise on visceral fat mass, femoral muscle mass and maximal muscle strength.
METHODS
The study subjects
The study subjects were 45- to 65-year-old women with type 2 diabetes treated with metformin monotherapy. Only the pa- tients whose glycosylated hemoglobin (HbA1c) less than 9%
and taking metformin 1,000 mg/day or less for recent 3 months prior to the initiation of the study were included. Exclusion cri- teria were patients with gestational diabetes mellitus, malignant tumor or secondary diabetes mellitus or advanced diabetes complication. Patients who switched medication or refused the tests during the study were also excluded. Patients who could not be followed, patients refusing the tests, and patients who switched medication. The subjects provided written informed consent before the initiation of any trial-related activities.
Measurement categories and methods The exercise method
We randomly assigned 32 patients to the aerobic exercise group (AG) and the control group (CG). The AG was prescribed to perform an anaerobic threshold (AT) intensity exercise for 60 minutes, 5 times per week, and for 12 weeks. For the initial 4 weeks, the subjects visited the clinic once a week, and were mon- itored by a multi-record accelerometer. For the remaining 8 weeks, the subjects visited the clinic every 2 weeks, and the ex- ercise amount was monitored. The CG did not receive exercise education for the study period, but they maintained routine ac- tivity, visited the clinic every 4 weeks, and their exercise amount was monitored.
Physical measurement and biochemical test
Upon initiation of the study and after 12 weeks, the height, BW and waist circumference of the subjects were measured. Height and weight were measured with the patients wearing only thin clothes and no outer clothing. Body mass index (BMI) was cal- culated by dividing BW (kg) by square height (m2). The waist circumference was measured in the comfortably exhaled state using a ruler, and the thinnest area between the lower costa and the iliac crest was measured. Blood pressure was measured after 10 minutes of rest in the seated position using a mercury blood pressure manometer (Yamasu, Tokyo, Japan).
For the biochemical tests, venous blood was collected after fasting for longer than 10 hours and the serum was separated by centrifugation at 3,000 rpm for 15 minutes and then stored at -70°C until needed for analysis. Fasting blood glucose was
measured by the glucose oxidation method, and HbA1c was measured by the cation exchange resin high performance liquid chromatography (HPLC) method. Cholesterol, triglyceride, HDL-cholesterol, and LDL-cholesterol were analyzed by an au- tomated biochemical analyzer (Hitachi 7170; Hitachi Co., Tokyo, Japan) using measurement kits based on enzyme reactions.
Insulin sensitivity was measured by the insulin tolerance test. The subjects fasted for longer than 10 hours and visited the clinic on the day of test under fasting conditions. A 20- gauge catheter was inserted into the side of a vein in the hand and used for blood collection. To the contralateral antecubital vein, another 20-gauge catheter was inserted and used for the injection of insulin and the injection of glucose after the com- pletion of tests. Under resting condition, insulin was diluted in advance (Humulin R; Eli Lilly & Co., Indianapolis, IN, USA) to 0.1 U/kg and injected to the antecubital vein and the glucose concentration was measured after 0, 3, 6, 9, 12, and 15 minutes.
Using the 3 - 15 minute values, the slope of the regression line was calculated, and from this, the t1/2 at which the basal blood glucose decreased to half was obtained, and the rate constant for plasma glucose disappearance (KITT) was calculated by the following formula:
KITT = 0.693/ t1/2 × 100 (%/min)
Assessment of physical activity amount
To assess the physical activity amount of each individual, a multi-record accelerometer (Lifecorder; Suzuken Co., Nagoya, Japan) was used, which was worn for 10 days except during sleep or bathing. The accelerometer receives the acceleration of the vibration caused by the up and down movement of the body at the 4- second unit signal. The accelerometer recognized 11 levels of exercise intensity: 0 is without movement, 0.5 is fine movement, 1 - 3 is low intensity, 4 - 6 is moderate intensity, 7 - 9 is high intensity, and the maximal value during 2 minutes is recorded and stored as the exercise intensity of 11 steps.
Physical activity-associated energy expenditure (PAEE) was calculated from sum of energy expenditure during an activity higher than level 4 intensity presented by accelerometer. The total energy expenditure (TEE) was defined as energy expen- diture from basal metabolism and light activity plus PAEE. In addition, PAEE or TEE divided by BW was considered to be the rate of energy expenditure per unit weight.
Assessment of meal calorie
For the assessment of the food intake, a 3-day food record (2
weekdays, 1 weekend day) was maintained for the two groups and the subjects visited the clinic every 4 weeks to discuss food consumption issues. For the food record, the subjects were ed- ucated briefly on the food record method, and then they were asked to fill out the food intake questionnaire for every meal by recording the amount of all consumed food and food mate- rials, including all health supplement food, snacks, etc.
When the food intake questionnaires were completed, nu- trition specialists directly interviewed the subjects to raise the accuracy of the food record, and the recorded items were dis- cussed using a real size food model (Korean Mirage model), measuring cups, measuring spoons, and portion sizes demon- strated in photographs (Korean Nutritionist Association, 1999).
The meal record information was analyzed by the computer- aided nutritional analysis program (CAN-Pro version 2.0; Ko- rean Nutrition Society, Seoul, Korea) and converted to the nu- trition intake amount.
Assessment of aerobic exercise capacity
The aerobic exercise capacity was assessed using oxygen con- sumption rate at anaerobic threshold (VO2-AT) during the graded exercise test (GXT). For the GXT, a bicycle (ER900, D- 72475 Bits; JAGER, Wuerzburg, Germany) was used. Work load was increased by 20 watts every 2 minutes until the pa- tient could not continue to exercise anymore. AT was defined as ventilator threshold which was the point at which the rela- tionship between ventilation and oxygen consumption deviate from linearity. The heart beat per minute, oxygen consump- tion rate, activity rate, and respiration number were automati- cally recorded and stored as numbers and graphed every 15 seconds during exercise and the recovery period. Blood pres- sure was measured every 2 minutes using an automated blood pressure manometer.
Assessment of muscle strength
To measure the one repetition maximum (1RM) of the upper limbs, the muscle strength of the deltoids, triceps, and the pec- toralis muscle was measured using a chest press. For the lower limbs, the muscle strength of the gluteal group, hamstring, and quadriceps muscle was measured by leg pressure (Keiser, Fres- no, CA, USA). For the 1RM, first, the patient was warmed up by light exercise at 50% of the intensity of the anticipated max- imal weight (50% of BW for upper limbs and BW for lower limbs), and the patient performed the press 8-10 times. After- wards, the patient performed light stretching for 3 minutes,
and then rested for approximately 1 minute. The examinees performed one set and repeated it 3 - 5 times with approxi- mately 75% of the maximum weight. After 1 minute, the max- imum muscle strength was tested with the weight increased by 1.25 - 4.5 kg. This was continued until the examinees could not lift the weight any more, and the last successful weight that could be lifted was selected as the maximum muscle strength, which generally was determined within 3 - 5 times trials [13].
Assessment of fat and muscle area
Computed tomography (CT) (GE, Milwaukee, WI, USA) was used for the assessment of abdominal fat area and quadriceps muscle mass. For abdominal fat area, the area belonging to the housefield unit (HU) from -150 to -50 was measured with the cross-sectional image of the 4 - 5 level of the lumbar vertebra.
The visceral fat area (VFA) was obtained by measuring the in- ner area of the boundary of the abdominal and dorsal perito- neum and the subcutaneous fat area was calculated from [total abdominal fat area (TFA) - visceral fat area (VFA)]. The quad- riceps muscle area (MA) was measured from the area of the HU 0 - 100 at the middle thigh level.
Statistical analysis
For statistical analysis, the average value of each item and stan- dard deviation were obtained by SPSS for Windows, version 15.0 (SPSS Inc., Chicago, IL, USA). To determine the differ- ences in glucose level, VFA, SFA, MA and 1RM between mea- surements before and after the 12 weeks between the groups was analyzed by independent t-test and those for each group were by paired t-test. The correlations between exercise inten- sity, abdominal fat area, and exercise ability were analyzed us- ing Pearson’s correlation analysis. Using the variables confirmed by these statistical analyses, we performed a linear regression analysis. A P value less than 0.05 was considered statistically significant.
RESULTS
The general characteristic of the study subjects
At the end of the 12-week study period, 13 patients remained in the AG and 14 patients in the CG. Of them, 20 were post- menopausal women (10 for AG and 10 for CG). The two groups did not differ significantly in BMI (AG: 27.0 ± 2.5 kg/m2; CG:
27.5 ± 3.0 kg/m2; P = 0.657). Duratino of diabetes, age, lipid profile and HbA1c were not different between group (Table 1).
However, KITT of the AG was significantly higher than that of the CG (AG: 2.9 ± 1.0%/min; CG: 2.1 ± 0.8%/min; P = 0.022) (Table 1).
The change in physical measurements and biochemical markers
The BMI of the AG after 12 weeks of exercise was significantly decreased from 27.4 ± 2.4 kg/m2 to 26.5 ± 2.2 kg/m2 (P = 0.003), and the waist circumference was also significantly decreased (P = 0.001). Such changes were not detected in the CG. KITT was not significantly changed in either group (Table 2).
Changes in energy expenditure and calorie intake
The calorie intake of the AG decreased from 1,906.5 ± 138.4 kcal/day to 1,614.8 ± 15.3 kcal/day, and that in the CG decreased from 1,937.7 ± 206.3 kcal/day to 1,805.2 ± 189.3 kcal/day. The decreases in calorie intake rate were significant in both groups (P < 0.001 and P = 0.005, respectively), but there was not a sig- nificant difference between the groups (P = 0.032).
The TEE, PAEE, and the total amount of walking in the AG significantly increased (P = 0.003, P = 0.003 and P = 0.003, re- spectively), but these differences were not detected in the CG.
When the data were divided according to exercise intensity and then analyzed, the results showed that in the AG, the low intensity (intensity level 1-3 from the accelerometer) exercise time decreased significantly (P = 0.004), and the moderate in- tensity (intensity level 4 - 6 from the accelerometer) and high intensity (intensity level 7 - 9 from the accelerometer) exercise time increased significantly (P = 0.028 and P = 0.036, respec- tively). The low intensity, moderate intensity and high intensity exercise time of the CG did not change statistically. The mod- erate intensity and high intensity exercise time of the AG was significantly increased in comparison to the CG (P = 0.016 and P = 0.020, respectively) (Table 2).
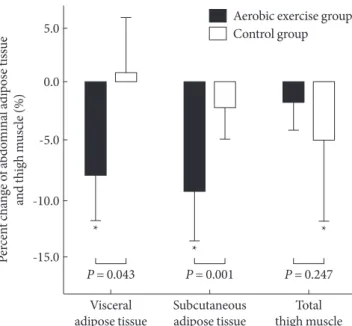
The change in abdominal fat area
After 12 weeks of exercise, only the AG showed significant re- duction of TFA, VFA and SFA (P = 0.001, P = 0.018, and P <
0.001, respectively): 8.4 % in VFA and 9.0 % in SFA (Fig. 1).
Those of the CG were not significantly changed: 0.9 % in VFA and 1.7 % in SFA (Table 3, Fig. 1).
The change in aerobic exercise capacity, quadriceps MA and maximal muscle strength
The VO2-AT increased significantly in the AG (P = 0.009).
Table 1. Baseline characteristics
Characteristics AG (n = 13) CG (n = 14) P value
Age, yr 55.5 ± 7.5 57.5 ± 8.6 0.536
DM duration, yr 6.6 ± 5.6 6.0 ± 6.5 0.796
Weight, kg 66.3 ± 6.5 68.0 ± 7.9 0.548
Body mass index, kg/m2 27.0 ± 2.5 27.5 ± 3.0 0.657
Waist, cm 89.4 ± 5.6 89.4 ± 13.0 0.991
HbA1c, % 7.7 ± 1.1 7.3 ± 0.7 0.345
Fasting c-peptide, ng/mL 1.5 ± 0.4 1.7 ± 0.6 0.370
Total Cholesterol, mg/dL 158.0 ± 35.6 156.0 ± 41.0 0.933
Triglyceride, mg/dL 127.0 ± 78.9 179.4 ± 161.0 0.298
HDL-C, mg/dL 46.0 ± 8.8 38.6 ± 11.9 0.078
LDL-C, mg/dL 99.7 ± 35.8 95.6 ± 34.4 0.767
KITT, %/min 2.9 ± 1.0 2.1 ± 0.8 0.022a
Dietary energy intake, kcal/day 1906.5 ± 138.4 1932.7 ± 206.3 0.704
Total energy expenditure, kcal/day 1903.1 ± 70.4 1815.5 ± 177.2 0.109
Activity energy expenditure, kcal/day 314.8 ± 52.3 246.3 ± 60.8 0.004a
Upper extremities, kg 16.7 ± 2.5 18.2 ± 6.5 0.440
Lower extremities, kg 89.2 ± 24.1 84.6 ± 33.8 0.695
The values were presented as mean ± standard deviation.
AG, aerobic exercise group; CG, control group; HbA1c, glycosylated hemoglobin; HDL-C, high density lipoprotein cholesterol; LDL-C, low density lipoprotein cholesterol.
aP values < 0.05 for comparison between the AG and the CG.
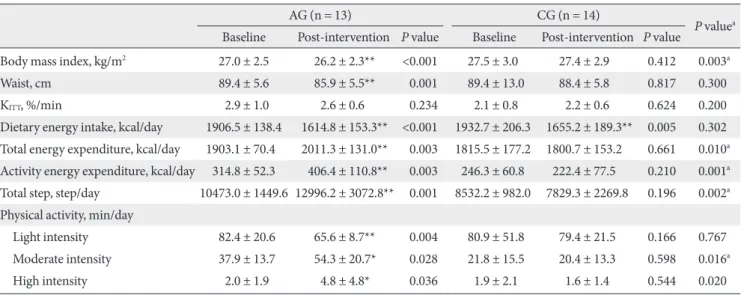
Table 2. Changes in anthropometric, insulin sensitivity, dietary energy intake, energy expenditure and physical activity
AG (n = 13) CG (n = 14)
P valuea Baseline Post-intervention P value Baseline Post-intervention P value
Body mass index, kg/m2 27.0 ± 2.5 26.2 ± 2.3** <0.001 27.5 ± 3.0 27.4 ± 2.9 0.412 0.003a
Waist, cm 89.4 ± 5.6 85.9 ± 5.5** 0.001 89.4 ± 13.0 88.4 ± 5.8 0.817 0.300
KITT, %/min 2.9 ± 1.0 2.6 ± 0.6 0.234 2.1 ± 0.8 2.2 ± 0.6 0.624 0.200
Dietary energy intake, kcal/day 1906.5 ± 138.4 1614.8 ± 153.3** <0.001 1932.7 ± 206.3 1655.2 ± 189.3** 0.005 0.302 Total energy expenditure, kcal/day 1903.1 ± 70.4 2011.3 ± 131.0** 0.003 1815.5 ± 177.2 1800.7 ± 153.2 0.661 0.010a Activity energy expenditure, kcal/day 314.8 ± 52.3 406.4 ± 110.8** 0.003 246.3 ± 60.8 222.4 ± 77.5 0.210 0.001a Total step, step/day 10473.0 ± 1449.6 12996.2 ± 3072.8** 0.001 8532.2 ± 982.0 7829.3 ± 2269.8 0.196 0.002a Physical activity, min/day
Light intensity 82.4 ± 20.6 65.6 ± 8.7** 0.004 80.9 ± 51.8 79.4 ± 21.5 0.166 0.767
Moderate intensity 37.9 ± 13.7 54.3 ± 20.7* 0.028 21.8 ± 15.5 20.4 ± 13.3 0.598 0.016a
High intensity 2.0 ± 1.9 4.8 ± 4.8* 0.036 1.9 ± 2.1 1.6 ± 1.4 0.544 0.020
The values were presented as mean ± standard deviation. Light intensity was defined as intensity level 1-3 from the accelerometer, moderate intensity from level 4-6 and high intensity from level 7-9.
AG, aerobic exercise group; CG, control group.
aP values for comparisons between the AG and the CG, *P-values < 0.05, **P-values < 0.01 for comparison between baseline and intervention within group.
Within the CG, a statistical difference was not detected (Table 3). The 1RM of the upper and lower limbs of subjects in the AG did not significantly change, but maximal muscle strength did decreased significantly in the upper and lower limbs in the
CG (P = 0.029, P = 0.035, respectively) (Table 3). The quadri- ceps MA in the AG did not significantly change, however, it did significantly decrease in the CG (P = 0.045): -1.4% during the intervention in the AG and -4.6 % in the CG (Fig.1).
The relationships among exercise intensity abdominal fat mass and aerobic exercise capacity
We examined the effect of exercise intensity on the abdominal fat. The exercise time consumed by low intensity or high inten- sity had no correlation with the change in abdominal fat area.
However, we did observe that the changes in TFA and SFA were significantly correlated with time spent in moderate intensity exercise (r = -484, P = 0.011 and r = -0.531, P = 0.004, respec- tively) (Table 4).
In addition, VO2-AT was significantly correlated with time spent in high intensity exercise (r = 0.414, P = 0.032), but not with that of low or moderate intensity exercise (Table 4).
DISCUSSION
Walking is an aerobic exercise that can be performed anytime and anywhere without causing strains to the body, and thus it is a suitable initial exercise for diabetes patients. It was most widely performed by diabetes patients in Korea [14]. Never- theless, there are few studies examining the effect of aerobic
Table 3. Changes in regional fat, thigh muscle, aerobic capacity and muscle strength
AG (n = 13) CG (n = 14)
P valuea Baseline Post-intervention P value Baseline Post-intervention P value
Regional fat
TFA, mm2 40183.5 ± 9774.3 36486.4 ± 8029.8** 0.001 42357.4 ± 7891.2 41880.9 ± 7898.0 0.217 0.001a VFA, mm2 16291.5 ± 4808.5 14682.7 ± 3494.7* 0.018 17204.5 ± 4674.4 17216.3 ± 4560.8 0.981 0.043a SFA, mm2 23891.9 ± 6439.1 21803.7 ± 6153.7** <0.001 25152.9 ± 5839.3 24664.6 ± 5580.4 0.075 0.001a Thigh muscle
MA, mm2 10442.9 ± 1015.5 10273.5 ± 842.7 0.192 11215.1 ± 2132.3 10720.3 ± 2486.5* 0.045 0.247 Aerobic capacity
VO2-AT, mL/min/kg 9.1 ± 3.5 13.6 ± 5.7** 0.009 8.8 ± 2.8 11.3 ± 3.9 0.115 0.341
Muscle strength
Upper extremities, kg 16.7 ± 2.5 16.1 ± 2.7 0.264 18.2 ± 6.5 17.1 ± 6.8* 0.029 0.440
Lower extremities, kg 89.2 ± 24.1 82.5 ± 25.1 0.116 86.4 ± 32.9 75.3 ± 24.1* 0.035 0.809 The values were presented as mean ± standard deviation.
AG, aerobic exercise group; CG, control group; TFA, total fat area; VFA, visceral fat area; SFA, subcutaneous fat area; MA, muscle area; VO2-AT, oxygen consumption rate at the anaerobic threshold.
aP values for comparisons between the AG and the CG, *P values < 0.05, **P values < 0.01 compared to baseline and intervention within group.
Fig. 1. Percent changes of regional fat and thigh muscle.
*P values < 0.05 compared to baseline and intervention within group.
Aerobic exercise group Control group
Percent change of abdominal adipose tissue and thigh muscle (%)
Visceral adipose tissue
P = 0.043
*
* P = 0.001 Subcutaneous adipose tissue
*
P = 0.247 Total thigh muscle -10.0
-15.0 0.0 -5.0 5.0
exercise in daily life on cardiopulmonary function and abdom- inal fat mass in the subjects with diabetes. It is necessary to com- pare the physical activity of the diabetic subjects with that of non-diabetic individuals. Give that there are have been a lack of studies in Korea, the effects of aerobic exercise for Korean diabetes patients is largely unknown. Yim [15] examined the physical activity in the daily life of 60- to 79-year-old obese fe- males, and with age, the average TEE and PAEE decreased, with a statistically significant decrease in women older than 65 years.
The TEE for the 60 to 64-year-old age subject group was 1,724.2 kcal/day, and the PAEE was 239.9 kcal/day. The average age of the subjects in our study was 56.6 years old, TEE was 1,857.6 kcal/day and PAEE was 279.3 kcal/day, which was not lower than that of normal individuals.
Moderate level exercise intensity implies that the metabolic equivalent task (MET) is within the 3.0 - 6.0 range [16]. Paffen- barger et al. [17] reported that physical activity with an exer- cise intensity higher than 4.5 MET is effective for patients with chronic diseases. Kumahara et al. [12], who converted the in- tensity of the multi-record accelerometer to MET reported that physical activity lower than low intensity (< level 4) was less than 3.5 MET, the moderate level (level 4 - 6) exercise intensity corresponds to 3.6 - 6.0 MET intensity, and the high intensity (>level 7) exercise corresponds to an intensity higher than 6.1 MET. In our study, the exercise time with moderate intensity was 29.5 ± 16.5 minutes which was comparable to 28.9 ± 23.4 minutes of the above Yim’s study.
The probability that individuals with abdominal obesity will develop vascular diseases is 10.8 times higher than that for nor- mal individuals [18]. When obesity is controlled, the mortality rate of cardiovascular diseases is also decreased [19]. Continu- ous aerobic exercise training has been reported to reduce body fat in both obese and normal weight individuals. Recent stud-
ies have been conducted to determine the maximal fat burning exercise intensity for different exercises [20,21].
Lee and Lee [22] analyzed exercise at 40%, 57%, and 75%
intensity of the maximum oxygen consumption rate according to the Bruce’s graded exercise method to determine the exer- cise intensity for the maximum fat burning. According to the results, exercise performed at 57% of the maximal oxygen con- sumption rate produced the lowest lactic acid concentration, and minimized the effect of anti-lipolysis due to the accumu- lation of lactic acid. Thus, the triglyceride and free fatty acid levels in the blood increased resulting in a high fat consump- tion rate during the exercise. Lee et al. [23] reported that mod- erate level exercise at 60% maximal oxygen consumption rate for 60 minutes, 5 times per week, and for 1 week resulted in a significant decrease in abdominal visceral fat mass and subcu- taneous fat mass. As shown in Table 4, our data show a high correlation between the abdominal total fat area and moderate level exercise duration, and thus moderate intensity exercise is more effective at reducing abdominal fat than low intensity or high intensity exercise.
Obesity deteriorates cardiopulmonary function [24]. How- ever, regular exercise has been reported to improve cardiopul- monary function and reduce the risk factors of cardiovascular diseases [25]. In the AG in our study, the mean age of the pa- tients was 55.5 years and the body mass index was 27.0 kg/m2. In these patients, VO2-AT increased and thus cardiopulmonary function improved. However, the quadriceps muscle mass pri- or to and after aerobic exercise was not significantly different.
The muscle strength of the upper and lower limbs also did not change significantly with exercise. Nonetheless, our research re- sults are identical to those of the study reported by Weiss et al.
[26], and in the CG, the quadriceps muscle mass was significant- ly reduced. While the meal consumption amount was not pre- Table 4. Correlations between duration of physical activity, regional fat and aerobic capacity
TFA VFA SFA VO2-AT
r P value r P value r P value r P value
Duration of physical activity, min/day
Light intensity -0.184 0.358 -0.183 0.361 -0.096 0.635 0.134 0.507
Moderate intensity -0.484 0.011* 0.305 0.122 -0.531 0.004* 0.343 0.080
High intensity -0.115 0.568 -0.052 0.797 -0.144 0.474 0.414 0.032*
TFA, total fat area; VFA, visceral fat area; SFA, subcutaneous fat area; MA, muscle area; VO2-AT, oxygen consumption rate at the anaerobic threshold.
*P values < 0.05.
scribed, there was a significant reduction in the meal amounts at the end of the study in comparison with the initiation of the study, so that, there was a reduction in the total fat mass and the muscle mass also decreased.
An [8] conducted a study of a group of obese type 2 diabetes patients (mean age 56.5 years old and mean BMI of 24.7 kg/m2), and trained the patients on a treadmill or ergometer. They re- ported results similar to those of our study; cardiopulmonary function was improved, but the muscle mass did not change.
Together with the reduction in total abdominal fat mass, aerobic exercise can improve cardiopulmonary function. Most studies on aerobic exercise involve exercise training using a treadmill or a bicycle, which is not easy to apply to many patients. In our study, we monitored the daily physical activity of patients using a multi-record accelerometer, and we found that a moderate level of exercise significantly reduced the abdominal fat mass and improved cardiopulmonary function.
Based on our results, we strongly recommend prescribing moderate aerobic exercise for type 2 diabetes patients and mon- itoring their physical activity with a multi-record accelerometer.
A limitation of our study is that despite the random assign- ment of study subjects to the intervention group, the AG con- sisted of patients who had a previous intent to exercise, and thus the average exercise consumption rate was high, so the insulin sensitivity index was significantly higher. Therefore, despite the increase in exercise amount, there was no positive effect on in- sulin sensitivity. In addition, we included both premenopausal and postmenopausal women. In female cases, the incidence of metabolic syndrome associated with obesity after menopause increases rapidly, primarily because of the accumulation of ab- dominal body fat due to the sudden reduction in estrogen se- cretion caused by menopause [27]. However, there was no dif- ference in the proportion of postmenopausal women between groups; menopause status of our subjects should not have any effect on the observed differences between the two groups.
REFERENCES
World Health organization. Obesity: preventing and managing 1.
the global epidemic. Report of a WHO Consultation on Obe- sity. Geneva: World Health organization; 1997.
Hunter GR, Kekes-Szabo T, Snyder SW, Nicholson C, Nyikos I, 2.
Berland L. Fat distribution, physical activity, and cardiovascu- lar risk factors. Med Sci Sports Exerc 1997;29:362-9.
Williams MJ, Hunter GR, Kekes-Szabo T, Snyder S, Treuth 3.
MS. Regional fat distribution in women and risk of cardiovas- cular disease. Am J Clin Nutr 1997;65:855-60.
Kotani K, Tokunaga K, Fujioka S, Kobatake T, Keno Y, Yoshida 4.
S, Shimomura I, Tarui S, Matsuzawa Y. Sexual dimorphism of age-related changes in whole-body fat distribution in the obese. Int J Obes Relat Metab Disord 1994;18:207-12.
Fujioka S, Matsuzawa Y, Tokunaga K, Tarui S. Contribution of 5.
intra-abdominal fat accumulation to the impairment of glucose and lipid metabolism in human obesity. Metabolism 1987;36:
54-9.
Klein S, Sheard NF, Pi-Sunyer X, Daly A, Wylie-Rosett J, Kulkar- 6.
ni K, Clark NG; American Diabetes Association; North Amer- ican Association for the Study of Obesity; American Society for Clinical Nutrition. A statement of the American Diabetes Asso- ciation, the North American Association for the Study of Obe- sity, and the American Society for Clinical Nutrition. Weight management through lifestyle modification for the prevention and management of type 2 diabetes: rationale and strategies.
Diabetes Care 2004;27:2067-73.
Sigal RJ, Kenny GP, Wasserman DH, Castaneda-Sceppa C, 7.
White RD. Physical activity/exercise and type 2 diabetes: a con- sensus statement from the American Diabetes Association.
Diabetes Care 2006;29:1433-8.
An KH. Effect of low intensity aerobic exercise in type 2 dia- 8.
betic patients. Korea Sport Res 2005;16:421-9.
An KH, Min KW, Han KA. The effects of aerobic training ver- 9.
sus resistance training in non-obese type 2 diabetics. J Korean Diabetes Assoc 2005;29:486-94.
Gan SK, Kriketos AD, Ellis BA, Thompson CH, Kraegen EW, 10.
Chisholm DJ.Changes in aerobic capacity and visceral fat but not myocyte lipid levels predict increased insulin action after exercise in overweight and obese men. Diabetes Care 2003;
26:1706-13.
Mourier A, Gautier JF, De Kerviler E, Bigard AX, Villette JM, 11.
Garnier JP, Duvallet A, Guezennec CY, Cathelineau G. Mobili- zation of visceral adipose tissue related to the improvement in insulin sensitivity in response to physical training in NIDDM.
Effects of branched-chain amino acid supplements. Diabetes Care 1997;20:385-91.
Kumahara H, Schutz Y, Ayabe M, Yoshioka M, Yoshitake Y, 12.
Shindo M, Ishii K, Tanaka H. The use of uniaxial accelerome- try for the assessment of physical-activity-related energy ex- penditure: a validation study against whole-body indirect calo- rimetry. Br J Nutr 2004;91:235-43.
Baechle TR, Earle RW. Essentials of strength training and con- 13.
ditioning. 2nd ed. Champaign: Human Kinetics; 2000.
Min KW, An KH, Sohn TS, Park YM, Hong YS, Kim YS, Park 14.
YB, Park KS, Lee GW, Kim IJ, Han KA, Yu JM, Son HS, Baik SH, Lee WC, Cho CG, Lee HW, Park SW. The study of physical activity in the Korean with type 2 diabetes. J Korean Diabetes Assoc 2005;29:517-25.
Yim MJ. The study of daily physical activity in old women us- 15.
ing pedometer with accelerometer. Korean J Obes 2004;13:
195-203.
Pate RR, Pratt M, Blair SN, Haskell WL, Macera CA, Bouchard 16.
C, Buchner D, Ettinger W, Heath GW, King AC. Physical activ- ity and public health: a recommendation from the Centers for Disease Control and Prevention and the American College of Sports Medicine. JAMA 1995;273:402-7.
Paffenbarger RS Jr, Blair SN, Lee IM, Hyde RT. Measurement 17.
of physical activity to assess health effects in free-living popu- lations. Med Sci Sports Exerc 1993;25:60-70.
Fujimoto WY, Bergstrom RW, Boyko EJ, Leonetti DL, Newell- 18.
Morris LL, Wahl PW. Susceptibility to development of central adiposity among populations. Obes Res 1995;3 Suppl 2:179S- 86S.
Björntorp P. Hazards in subgroups of human obesity. Eur J Clin 19.
Invest 1984;14:239-41.
Achten J, Jeukendrup AE. The effect of pre-exercise carbohy- 20.
drate feedings on the intensity that elicits maximal fat oxida- tion. J Sports Sci 2003;21:1017-24.
Astorino TA. Is the ventilatory threshold coincident with 21.
maximal fat oxidation during submaximal exercise in women?
J Sports Med Phys Fitness 2000;40:209-16.
Lee SH, Lee YS. Comparison of maximal and minimal Fat oxi- 22.
dation exercise intensity and physiological and metabolic vari- ables by treadmill graded maximal exercise test protocols. Ko- rean J Sport Sci 2005;16:42-55.
Lee S, Kuk JL, Katzmarzyk PT, Blair SN, Church TS, Ross R.
23.
Cardiorespiratory fitness attenuates metabolic risk indepen- dent of abdominal subcutaneous and visceral fat in men. Dia- betes Care 2005;28:895-901.
Jung YJ, Shin JH, Yum KS, Song CH, Choi WS, Kim KS, Park 24.
JH. The association between obesity indices and physical fit- ness. J Korean Acad Fam Med 2003;24:271-8.
Kemi OJ, Haram PM, Loennechen JP, Osnes JB, Skomedal T, 25.
Wisløff U, Ellingsen Ø. Moderate vs. high exercise intensity:
differential effects on aerobic fitness, cardiomyocyte contractil- ity, and endothelial function. Cardiovasc Res 2005;67:161-72.
Weiss EP, Racette SB, Villareal DT, Fontana L, Steger-May K, 26.
Schechtman KB, Klein S, Ehsani AA, Holloszy JO; Washington University School of Medicine CALERIE Group. Lower extrem- ity muscle size and strength and aerobic capacity decrease with caloric restriction but not with exercise-induced weight loss. J Appl Physiol 2007;102:634-40.
Jeong SK, Seo MW, Kim YH, Kweon SS, Nam HS. Does waist 27.
indicate dyslipidemia better than BMI in Korean adult popula- tion? J Korean Med Sci 2005;20:7-12.