ISSN 2234-3806 • eISSN 2234-3814
http://dx.doi.org/10.3343/alm.2013.33.4.233
Is Prostate-Specific Antigen Effective for Population Screening of Prostate Cancer? A Systematic Review
Yoon Jae Lee, O.M.D.1,2, Ji Eun Park, M.S.1,3, Byung Ryul Jeon, M.D.4, Sang Moo Lee, M.D.1, Soo Young Kim, M.D.1,5, and You Kyoung Lee, M.D.4
Department of Health Technology Assessment Research1, National Evidence-based Healthcare Collaborating Agency, Seoul; Department of Oriental Gynecology2, Bundang CHA Medical Center, CHA University, Seongnam; Department of Health Policy and Management3, School of Public Health, Seoul National University, Seoul; Department of Laboratory Medicine and Genetics4, Soonchunhyang University College of Medicine, Bucheon; Department of Family Medicine5, College of Medicine, Hallym University, Seoul, Korea
Background: The effectiveness of prostate-specific antigen (PSA) for population screening has presented controversial results in large trials and prior reviews. We investigated the ef- fectiveness of PSA population screening in a systematic review.
Methods: The study was conducted using existing systematic reviews. We searched Ovid MEDLINE, Embase, Cochrane library, and the major Korean databases. The quality of the systematic reviews was assessed by two reviewers independently using AMSTAR. Ran- domized controlled trials were assessed using the risk of bias tool in the Cochrane group.
Meta-analyses were conducted using Review Manager. The level of evidence of each out- come was assessed using GRADE.
Results: Prostate-cancer-specific mortality was not reduced based on similar prior reviews (relative risk [RR] 0.93; 95% confidence interval [CI], 0.81-1.07, P =0.31). The detection rate of stage 1 prostate cancer was not greater, with a RR of 1.67 (95% CI, 0.95-2.94) and high heterogeneity. The detection rate of all cancer stages in the screening group was high, with a RR of 1.45 (95% CI, 1.13-1.85). No difference in all-cause mortality was ob- served between the screening and control groups (RR, 0.99; 95% CI, 0.98-1.01, P =0.50).
Prostate-cancer-specific mortality, all-cause mortality, and diagnosis of prostate cancer at stages 3-4 showed moderate levels of evidence.
Conclusions: Differently from prior studies, our review included updated Norrköping data and assessed the sole effect of PSA testing for prostate cancer screening. PSA screening alone did not increase early stage prostate cancer detection and did not lower mortality.
Key Words: Prostatic neoplasm, Mass screening, Mortality, Prostate specific antigen, Re- view, Meta-analysis
Received: April 16, 2013 Revision received: May 6, 2013 Accepted: May 16, 2013
Corresponding author: You Kyoung Lee Department of Laboratory Medicine and Genetics, Soonchunhyang University College of Medicine, 170 Jomaru-ro, Wonmi-gu, Bucheon 420-767, Korea Tel: +82-32-621-5941
Fax: +82-32-621-5944 E-mail: youklee@gmail.com
© The Korean Society for Laboratory Medicine.
This is an Open Access article distributed under the terms of the Creative Commons Attribution Non-Commercial License (http://creativecom- mons.org/licenses/by-nc/3.0) which permits unrestricted non-commercial use, distribution, and reproduction in any medium, provided the original work is properly cited.
INTRODUCTION
Prostate cancer (Pca) is the second most common cancer in males and ranks sixth in terms of cancer-related mortality [1].
The global incidence of Pca is increasing steadily, except in a few high-income countries [2]. In general, mortality caused by cancer can be reduced by early detection and treatment. Early detection through screening is recommended, but whether Pca
screening lowers Pca mortality remains controversial. In particu- lar, the effectiveness of population screening using prostate- specific antigen (PSA) rather than opportunistic screening per- formed for well-informed males in clinical situations is contro- versial, fueled by the discrepant results of the Prostate, Lung, Colorectal and Ovarian (PLCO) and the European Randomized study of Screening for Prostate Cancer (ERSPC), large-scale randomized controlled trials (RCTs) [3, 4].
Numerous reviews of the effectiveness of Pca population screening have reported disparate results. Djulbegovic et al. [5] and Ilic et al. [6] reviewed the effect of PSA with/without a digital rectal exam (DRE) and transrectal ultrasound (TRUS) in a meta- analysis. According to their results, such screening did not lower Pca-specific mortality but did increase diagnosis of stage 1 Pca (relative risk [RR], 1.95; 95% confidence interval [CI], 1.22-3.13).
Lumen et al. [7] reported that PSA and DRE screening has no significant effect on Pca-specific mortality but did have a signifi- cant effect on the diagnosis of localized cancer (RR, 1.81; 95% CI, 1.15-2.86). PSA with/without DRE/TRUS has been evaluated as a screening tool in prior reviews. Although DRE is an impor- tant tool for Pca screening, 73% of patients report pain and dis- comfort while undergoing DRE, which leads to an increased rate of refusal to undergo screening [8]. PSA is simple and more relevant for screening than DRE or TRUS. Furthermore, a num- ber of guidelines consider PSA to be a major screening test [9- 11]. Therefore, the effectiveness of PSA screening alone should be assessed.
The accuracy of PSA in population-based screening has not been investigated and so no reference data are available for comparison, but the sensitivity of total PSA (tPSA) in typical clinical situations is 0.78-1. The specificity of tPSA is 0.06-0.66, depending on the cut-off used [12]. Despite such differences in accuracy, tPSA has the advantage of simplicity compared with other tests, making it the most commonly used Pca tumor marker [13].
In the present study, we assessed Pca-specific mortality and detection rate by systematic review and meta-analysis of prior systematic reviews to determine the effect on Pca screening of PSA without DRE and TRUS.
METHODS
We systematically reviewed the methods of using existing sys- tematic reviews to replace de novo by White et al. [14] to study the effectiveness of PSA for population-based Pca screening.
We selected the most relevant reviews and conducted additional literature searches to identify the most recent studies.
1. Search strategy and selection criteria
We determined PICOTS-SD (population, intervention, compara- tor, outcome, setting, and study design) in advance, and then searched databases to identify relevant systematic reviews. Pre- determined PICOTS-SD was as follows.
Participants: asymptomatic males >40 yr who underwent PSA
population screening; no restrictions on region or race.
Intervention: tPSA.
Comparison: no screening or current practice.
Outcomes: overall mortality, Pca-specific mortality, diagnosis of Pca, stage of Pca at diagnosis.
We searched using the systematic review filter that was devel- oped by the Scottish Intercollegiate Guideline Network. We re- stricted our search to the studies published in English or Ko- rean. The following databases were searched: Cochrane Data- base of Systematic review, Ovid MEDLINE, Ovid EMBASE, and Centre of Reviews and Dissemination. Details of the search strategies are available as a supplemental data (Table S1 and Table S2) on the ALM online (www.annlabmed.org).
Inclusion criteria were systematic reviews of high quality or health technology assessment reports or meta-analyses as- sessed using AMSTAR, including recently published large RCTs.
We excluded narrative reviews and primary studies.
All studies were independently reviewed and selected by two researchers (YJ Lee and JE Park). Titles and abstracts were re- viewed in duplicate and inappropriate studies were excluded. If a title or abstract appeared to meet the eligibility criteria for in- clusion in the review, or we could not determine its eligibility, the full text of the article was obtained and evaluated to determine whether it met the inclusion criteria. Discrepancies between the reviewers were resolved by discussion.
The updated search for screening new RCTs was conducted until 1 yr prior, the last searching date for relevant systematic re- views (since January 2009). Indexing by PubMed-MEDLINE was noticeably more rapid, so we also searched PubMed. The searched databases were Ovid Medline, Ovid Embase, Cochrane Central Register of Controlled Trials, and PubMed. Participants, interventions, comparisons, and outcomes were as listed above.
All randomized, quasi-randomized, and controlled trials were el- igible for this review. Inclusion criteria were population screen- ing trials using PSA. Trials of screening a symptomatic popula- tion were excluded.
All RCT articles were reviewed independently by two of the five researchers (SY Kim, YK Lee, BR Jeon, YJ Lee, and JE Park). Titles and abstracts were first reviewed, and inappropriate literature was excluded. The full text of each potentially eligible study was reviewed twice. All disagreements were resolved by discussion.
2. Quality assessment of the systematic review and risk of RCT bias
The quality of the systematic reviews was assessed by two re-
viewers (YJ Lee and JE Park) who independently used the as- sessment of multiple systematic reviews (AMSTAR) tool of Shea et al. [15]. The RCTs were assessed using the risk of bias tool developed by the Cochrane group. Risk of bias was also inde- pendently assessed by two reviewers (each article was assigned to two of the four reviewers, SY Kim, YK Lee, BR Jeon, and JE Park).
3. RCT data extraction
Data were extracted by two independent reviewers (each article was assigned to two of the five reviewers, SY Kim, YK Lee, BR Jeon, YJ Lee, and JE Park) using a standardized data extraction form. Any discrepancies were resolved by consensus or in con- sultation with a third reviewer. General information (including the name of the trial, the yr of publication, and country), such as mean age, inclusion criteria, PSA test method, reference standard, biopsy method, total number of participants, study period, follow-up period, and Pca diagnostic method were ex- tracted from all trials.
4. Data synthesis
Screening effectiveness was analyzed statistically by means of RR. If frequencies were provided by the RCTs, the Mantel- Haenszel method was used for statistical synthesis with a ran- dom effects model. If no frequencies were provided, inverse variance methods were used for the analysis. Results are pre- sented as RRs and CIs. The Review Manager software (version 5.1, 2011; The Nordic Cochrane Center, the Cochrane Collabo- ration, Copenhagen, Denmark) was used for the synthesis.
5. Assessment of heterogeneity and sensitivity analysis Heterogeneity between studies was assessed using Cochrane’s Q and I2 statistics. Publication bias could not be assessed using Egger’s method [16] because <10 trials were included. Sub- group analyses were conducted according to age (age ≥55 yr or all ages), follow-up period (PLCO 7 yr of follow-up or 10 yr), and overall risk of bias (only those with a low risk of bias or all), tak- ing into consideration the characteristics of the included stud- ies.
6. Level of evidence
The tool of Grading of Recommendations Assessment, Develop- ment and Evaluation (GRADE) was used to assess the level of evidence and summarize each outcome. The GRADEprofiler software (Version 3.6 for Windows, 2008: The Cochrane Collabo- ration, Copenhagen, Denmark) was used.
RESULTS
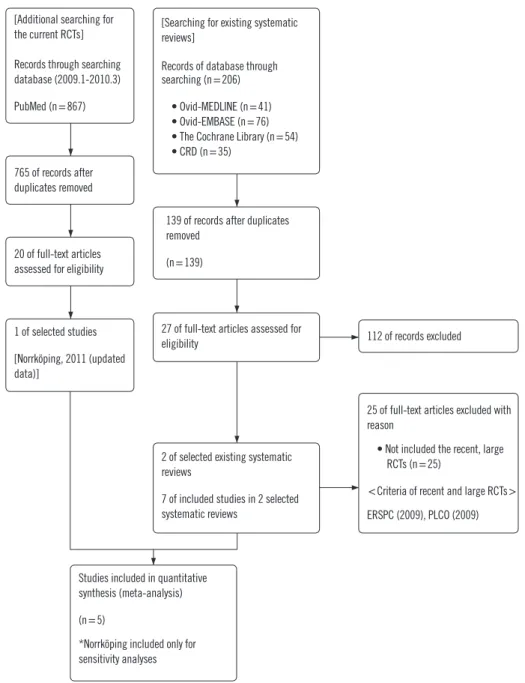
1. RCTs includedThe identification and selection procedure for the systematic re- views is shown in a flow diagram (Fig. 1). We selected RCTs us- ing existing systematic reviews. A total of 206 publications were identified by searching the databases; however only two of these were eligible for systematic review [5, 6]; these were of high quality as assessed by AMSTAR. Seven RCTs were reviewed in these two systematic reviews [3, 4, 17-21]. An updated search was performed, which took as its starting point the end of the search periods of the two included systematic reviews. We in- cluded a new article from this updated search, the Norrköping trial, which incorporated a long-duration follow-up period [22].
We included six of the eight RCTs (Table 1). The Stockholm trial was excluded because it did not investigate the effect of PSA screening [20]. The 2004 Norrköping study was not in- cluded due to inclusion of the more up-to-date version of that study. Because unlike in other trials, fine-needle aspiration was used for biopsy in the Norrköping study, this trial was included only in the sensitivity analysis. The characteristics of the individ- ual trials are shown in Table 2.
2. Risk of bias of the included RCTs
The RCTs were assessed using the Cochrane’s risk of bias tool (Fig. 2). Three studies had a low risk of bias due to their random sequence generation domain. The risks of bias of the other three studies were unclear. Predetermined outcomes were objective, given the mortality and diagnosis. Thus, we assessed low risks of bias for all outcomes in the blinding domain.
3. Effect on mortality
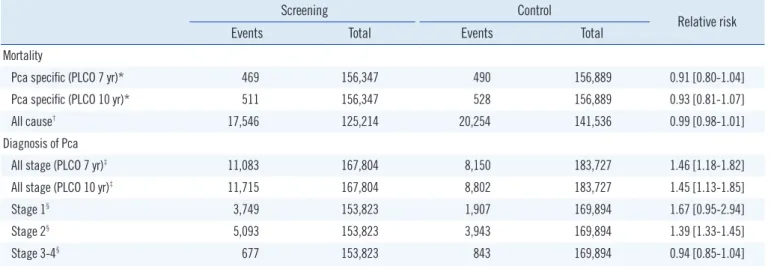
The Pca-specific mortality rate did not differ between the screen- ing and the control groups (Table 3). The Göteborg trial included duplicate data with the ERSPC, so we included only data from the 60-64-yr age group in the Göteborg trial [17]. The PLCO trial reported Pca-specific mortality rates after 7 and 10 yr [3]. We analyzed both data sets but found little difference. The RR was 0.91 (95% CI, 0.80-1.04, P =0.17) for the 7-yr PLCO follow-up and 0.93 (95% CI, 0.81-1.07, P =0.31) for the 10-yr PLCO follow- up.
All-cause mortality data were available in the Göteborg, PLCO, and ERSPC trials (ERSPC was quoted from the study by Ilic [6];
data for only the 60-64 yr age group were extracted from the Göteborg trial). No difference in all-cause mortality was observed between the screening and control groups (RR, 0.99; 95% CI,
0.98-1.01, P =0.50).
4. Effect on diagnosis
Four trials, which included 351,531 randomized participants, contributed information on the Pca diagnosis. In the meta-anal- ysis, the screening group was 46% more likely to be diagnosed with Pca in the 7-yr PLCO follow-up data. The screening group in the 10-yr PLCO follow-up data was 45% more likely to be di- agnosed with Pca.
Diagnostic data according to stage were extracted from three available trials: the ERSPC, French ERSPC, and the PLCO [3, 4,
19]. A total of 3,749 early cancers were detected in 153,823 screening participants, and 1,907 early cancers were detected in 169,894 control participants. Pca diagnosis at stages 1, 2, and all other stages showed marked heterogeneity, I2>90%.
Pca diagnosis at stage 1 in the screening and control groups was not different (RR, 1.67; 95% CI, 0.95-2.94, P =0.07); how- ever, the diagnosis of Pca at stage 1 presented the same direc- tion of effect in all trials, despite the marked heterogeneity.
The screening group was 39% more likely to be diagnosed with stage 2 Pca than the control group (RR, 1.39; 95% CI, 1.33- 1.45, P <0.001) in the three trials, but with marked heterogene- [Additional searching for
the current RCTs]
Records through searching database (2009.1-2010.3) PubMed (n=867)
765 of records after duplicates removed
20 of full-text articles assessed for eligibility
1 of selected studies [Norrköping, 2011 (updated data)]
27 of full-text articles assessed for
eligibility 112 of records excluded
25 of full-text articles excluded with reason
• Not included the recent, large RCTs (n=25)
<Criteria of recent and large RCTs>
ERSPC (2009), PLCO (2009) 2 of selected existing systematic
reviews
7 of included studies in 2 selected systematic reviews
Studies included in quantitative synthesis (meta-analysis) (n=5)
*Norrköping included only for sensitivity analyses
139 of records after duplicates removed
(n=139)
[Searching for existing systematic reviews]
Records of database through searching (n=206) • Ovid-MEDLINE (n=41) • Ovid-EMBASE (n=76) • The Cochrane Library (n=54) • CRD (n=35)
Fig. 1. Flow diagram.
Abbreviations: RCT, Randomized controlled trial; CRD, Centre for Reviews and Dissemination.
ity.
Pca screening did not increase the number of subjects diag- nosed with stages 3 or 4 Pca. A random-effects model for the meta-analysis showed a RR of 0.94 (95% CI, 0.85-1.04, P =0.24).
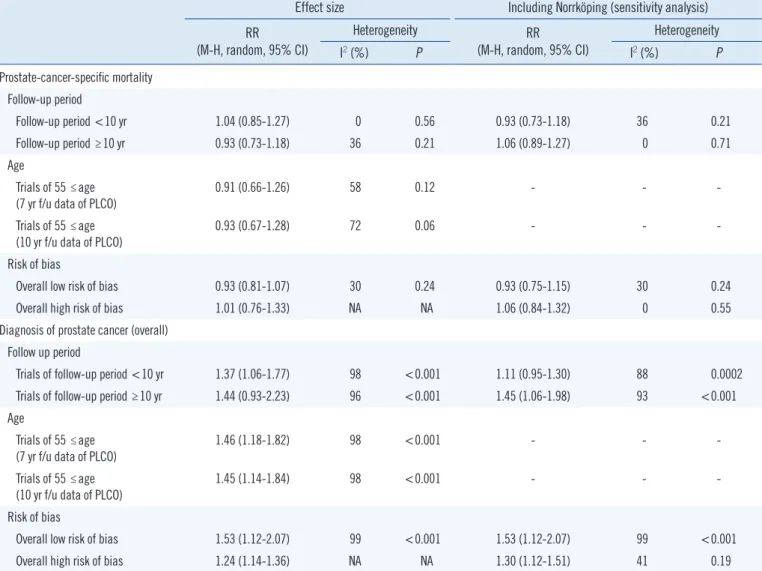
5. Subgroup analysis
A subgroup analysis was performed according to age, follow-up period, and risk of bias. The outcomes were Pca-specific mor- tality and diagnosis of Pca at all stages. Other factors did not af- fect the results significantly (Table 4).
6. Level of evidence
The levels of evidence as determined by GRADE were from very low to moderate (Table 5). None of the studies reported the ran- domization sequence or allocation concealment methods, so all outcomes were initially downgraded. The inconsistency domain was downgraded at the outcome of Pca diagnosis, diagnosis of stage 1 Pca, and diagnosis of stage 2 Pca. In addition, the im- precision domain was downgraded at the diagnosis of stage 2 Pca with a wide CI for the effect size.
DISCUSSION
The ERSPC, a recent large-scale clinical PSA screening study, reported the results of 11 yr of follow-up [23]. The PLCO re- ported updated results of 13 yr of follow-up [24]. However, these two large-scale studies showed inconsistent results. The PLCO reported a RR of 1.09 (95% CI, 0.87-1.36) for Pca-specific mor- tality after 13 yr of follow-up and the ERSPC reported a RR of 0.79 (95% CI, 0.68-0.91) after 11 yr of follow-up. Controversies over the effectiveness of screening are found not only in clinical Tabl
e 2. Characteristics of the included randomized controlled trials (RCTs) Trial Participants with random allocationAge of inclu- sion criteria (yr, range)
Follow up period (yr, median) Screening methods
PSA reference standard (ng/mL)
Risk of bias on random sequence generation Risk of bias on allocation conceal- ment Risk of bias on blinding of participants and personnelBlinding of outcome assessment Risk of bias on incom- plete out- come data Risk of bias on selective reporting
Contamination of control groupScreening groupControl group ERSPC, 2009 [4]82,816 72,89099,184 89,35350-74 (all)9PSA+DRE≤3 (varies by country)LowUnclearLowLowLowLowLow, 20% French ERSPC, 2009 [19]42,59042,19155-69 (all)4PSA3UnclearUnclearLowUnclearUnclearUnclearUnclear Göteborg, 2010 [17]9,952 4,0559,952 4,00250-64 (all) Analysis age range: 1940-1944
14PSA (DRE per- formed only in abnormal PSA participants)
3.4→2.9 →20.5LowUnclearLowLowUnclearLowLow PLCO, 2009 [3]38,34338,35055-74 (all)11.5PSA+DRE4LowLowLowLowHighLowHigh, 40-52% Quebec, 2004 [18]31,13315,35345-80 (all)11PSA+DRE3UnclearUnclearLowLowLowUnclearLow Norrköping, 2011 [22]1,4947,53250-69 (all)Diagnosis: 13 Mortality: 20 Early: DRE 1993-: DRE+PSA
4UnclearUnclearLowLowHighLowUnclear ERSPC: Included duplicate Göteborg data (those born in 1930-939), but used only part of the Göteborg data (those born in 1940-1944); ERSPC: Inclusion criteria age was 50-74 yr, but only those 55-64 yr were included in the study. Both data extracted in this study; PLCO: each reported data of 7-and 10-yr follow-up; Norrköping trial: Included only in the sensitivity analysis. Abbreviations: NA, Not assessed; PSA, Prostate specific antigen; DRE, digital rectal exam.
Table 1. Comparison of the included randomized controlled trials (RCTs)
Ilic
(2010) [6] Djulbegovic
(2010) [5] RCTs included in this study
ERSPC, 2009 [4] O O O
Norrköping, 2011 [22] X X O
(only sensitivity analyses)
Norrköping, 2004 [21] O O X
PLCO, 2009 [3] O O O
Quebec, 2004 [18] O O O
Stockholm, 2009 [20] O X X
(not for effectiveness of PSA)
French ERSPC, 2009 [19] X O O
Göteborg, 2010 [17] X O O
studies but also in related guidelines. While the European Asso- ciation of Urology does not recommend population screening, the Japanese Urological Association (JUA) recommends PSA as a Pca screening test for males age >50 yr [9, 10]. JUA recom- mends PSA screening because the screening rate in Japan is very low. Some observational studies have reported a high mor- tality-reduction effect; however, these had limitations in that they
failed to consider the results of large-scale clinical trials [9]. In the midst of these controversies, USPSTF commented that PSA-based screening does not affect Pca-specific mortality much and may even inflict unnecessary harm. Therefore, Pca screening should be discouraged as Grade D [25].
The detection rate of early Pca stages was high in the screen- ing group, with a RR of 1.95 (95% CI, 1.22-3.13), and Pca-spe- cific mortality was not significantly lower, according to the review by Djulbegovic et al. [5]. However, our findings indicate that screening did not increase early stage detection of Pca and did not lower the risk of death. The rate of detection of early stage cancer by population screening was not significantly higher (RR =1.67; 95% CI, 0.95-2.94). This difference could be ex- plained in several ways. In contrast to prior studies, we reviewed the effect of PSA screening only; thus, the included studies were distinguished from prior systematic reviews. Among DRE, PSA, and TRUS as common screening tools, PSA was considered more suitable due to its simplicity. DRE and TRUS can cause pain and discomfort to examinees, reducing the rate of partici- pation in screening. Population-based screening for five cancers is conducted in Korea. The rate of participation in liver cancer screening in Korea was 32.6% in 2008 and 37.9% in 2009 using a simple approach such as blood sampling [26]. The rate of participation in gastric cancer screening using an invasive method such as endoscopy was 20.5% from 2005 to 2006 [27].
Despite the high rates of mortality and disease burden due to gastric cancer in Korea, the method of screening influences the participation rate, so we investigated the effectiveness of PSA as a screening tool. This systematic review was conducted using Fig. 2. Risks of bias in the prostate-specific antigen (PSA) trials.
ERSPC (50-74 yr) 2009
Random sequence generation (selection bias) Allocation concealment (selection bias) Blinding of participants and personnel (performance bias) Blinding of outcome assessment (detection bias) Incomplete outcome data (attrition bias) Selective reporting (reporting bias) Other bias Contamination (of control group)
FrenchERSPC (55-69 yr) 2009 Göteborg (60-64 yr) 2010 Norrköping (50-69 yr) 2011 PLCO (55-74 yr) 2009 Quebec (45-80 yr) 2004
Table 3. Effects of total prostate-specific antigen (tPSA) screening on mortality and diagnosis
Screening Control
Relative risk
Events Total Events Total
Mortality
Pca specific (PLCO 7 yr)* 469 156,347 490 156,889 0.91 [0.80-1.04]
Pca specific (PLCO 10 yr)* 511 156,347 528 156,889 0.93 [0.81-1.07]
All cause† 17,546 125,214 20,254 141,536 0.99 [0.98-1.01]
Diagnosis of Pca
All stage (PLCO 7 yr)‡ 11,083 167,804 8,150 183,727 1.46 [1.18-1.82]
All stage (PLCO 10 yr)‡ 11,715 167,804 8,802 183,727 1.45 [1.13-1.85]
Stage 1§ 3,749 153,823 1,907 169,894 1.67 [0.95-2.94]
Stage 2§ 5,093 153,823 3,943 169,894 1.39 [1.33-1.45]
Stage 3-4§ 677 153,823 843 169,894 0.94 [0.85-1.04]
*ERSPC (50-74 yr) 2009 [4], Göteborg (60-64 yr) 2010 [17], PLCO (55-74 yr) 2009 [3], Quebec (45-80 yr) 2004 [18]; †ERSPC (50-74 yr) 2009 [4], Göte- borg (60-64 yr) 2010 [17], PLCO (55-74 yr) 2009 [3]; ‡ERSPC (50-74 yr) 2009 [4], French ERSPC (55-69 yr) 2009 [19], Göteborg (60-64 yr) 2010 [17], PLCO (55-74 yr) 2009 [3]; §ERSPC (50-74 yr) 2009 [4], French ERSPC (55-69 yr) 2009 [19], PLCO (55-74 yr) 2009 [3].
Abbreviation: Pca, Prostate cancer.
existing systematic reviews. We examined five trials of the effec- tiveness of PSA-based population screening in existing system- atic reviews and additional literature searches. This method fa- cilitated cross-checking of the omitted studies and acquisition of data from unpublished reports [14]. The detection rate hetero- geneity between a previous review and our findings was high, although the direction of effect was identical, indicating that the results should be interpreted with caution.
Pca-specific mortality had a RR of 0.88 (95% CI, 0.71-1.09) in Djulbegovic et al. [5], and a RR of 0.95 (95% CI, 0.85-1.07) in Ilic et al. [6]; the difference was not significant. Similarly, PSA- based population screening did not reduce specific mortality and all-cause mortality in this study. In contrast, the rate of de- tection of all Pca stages was 45% higher in the screening group than in the non-screening group. This result was similar to that when the PLCO was switched from 7 to 10 yr of follow-up data, Table 4. Results of subgroup analysis
Effect size Including Norrköping (sensitivity analysis) RR
(M-H, random, 95% CI)
Heterogeneity RR
(M-H, random, 95% CI)
Heterogeneity
I2 (%) P I2 (%) P
Prostate-cancer-specific mortality Follow-up period
Follow-up period <10 yr 1.04 (0.85-1.27) 0 0.56 0.93 (0.73-1.18) 36 0.21
Follow-up period ≥10 yr 0.93 (0.73-1.18) 36 0.21 1.06 (0.89-1.27) 0 0.71
Age
Trials of 55 ≤age (7 yr f/u data of PLCO)
0.91 (0.66-1.26) 58 0.12 - - -
Trials of 55 ≤age
(10 yr f/u data of PLCO) 0.93 (0.67-1.28) 72 0.06 - - -
Risk of bias
Overall low risk of bias 0.93 (0.81-1.07) 30 0.24 0.93 (0.75-1.15) 30 0.24
Overall high risk of bias 1.01 (0.76-1.33) NA NA 1.06 (0.84-1.32) 0 0.55
Diagnosis of prostate cancer (overall) Follow up period
Trials of follow-up period <10 yr 1.37 (1.06-1.77) 98 <0.001 1.11 (0.95-1.30) 88 0.0002
Trials of follow-up period ≥10 yr 1.44 (0.93-2.23) 96 <0.001 1.45 (1.06-1.98) 93 <0.001
Age
Trials of 55 ≤age (7 yr f/u data of PLCO)
1.46 (1.18-1.82) 98 <0.001 - - -
Trials of 55 ≤age
(10 yr f/u data of PLCO) 1.45 (1.14-1.84) 98 <0.001 - - -
Risk of bias
Overall low risk of bias 1.53 (1.12-2.07) 99 <0.001 1.53 (1.12-2.07) 99 <0.001
Overall high risk of bias 1.24 (1.14-1.36) NA NA 1.30 (1.12-1.51) 41 0.19
Abbreviations: NA, not applicable; f/u, follow up; RR, Relative risk; M-H, Mantel–Haenszel.
Table 5. Level of evidence assessed by GRADE
Level of evidence
All-cause mortality Moderate
Prostate cancer-specific mortality Moderate
Prostate cancer diagnosis Low
Diagnosis of Pca on stage 1 Low
Diagnosis of Pca on stage 2 Very low
Diagnosis of Pca on stages 3-4 Moderate
High: Further research is very unlikely to change our confidence in the esti- mate of effect.
Moderate: Further research is likely to have an important impact on our confidence in the estimate of effect and my change the estimate.
Low: Further research is very likely to have an important impact on our con- fidence in the estimate of effect and is likely to change the estimate.
Very low quality: We are very uncertain about the estimate.
Abbreviations: Pca, Prostate cancer; GRADE, Grading of Recommendations Assessment, Development and Evaluation.
and when the Göteborg research data for the 50-64-yr age group were included [3, 17]. In addition, no significant differ- ence was observed in the sub-group analysis when studies were divided into those with a follow-up period >10 yr and those with a follow-up <10 yr, into those including all age groups and those including only the >55-yr age group, and into those with high risk of bias and those without. The results of long-term follow-up in the ERSPC and PLCO trials were published in 2012 [23, 24].
These were not included because our search was conducted in 2011. Although not presented here, the detection rates of all- stage and Pca-specific mortality updated with data in 2012 (RR, 1.39; 95% CI, 1.13-1.72 and RR, 0.96; 95% CI, 0.79-1.15) were not significantly different from these results (RR, 1.45; 95% CI, 1.13-1.85 and RR 0.93; 95% CI, 0.81-1.07, respectively).
These results suggest overdiagnosis because the progress of Pca is in many cases slow, particularly during the early stage [28]. A larger number of patients with cancer should be quali- fied in the screening group in a random allocation, compared to a clinical trial of screening, to demonstrate the presence of over- diagnosis. After the end of the clinical trial, more patients with cancer should be present in the control group; thus the differ- ence between the control and screening groups should be re- duced (catch-up cancer). This has been demonstrated for breast and lung cancers, indicating overdiagnosis. The existence of overdiagnosis of Pca is unclear due to the short follow-up pe- riods [28]. Although calculating the accuracy of overdiagnosis of Pca is difficult, some studies have estimated the rate based on data from representative clinical trials. The overdiagnosis rate estimated in the study quoted most frequently (ERSPC) was 66% [29]. Another possible explanation is that the actual benefit of screening might not be found due to the short follow-up peri- ods. If the early detection period of Pca is 5.4-6.4 yr, as esti- mated by some studies [29], the follow-up period in studies published to-date may be somewhat short. However, the mean follow-up period in a number of studies was >10 yr (Quebec, Norrköping, PLCO, and Göteborg) [3, 17, 18, 22]. Indeed, addi- tion of 11 yr of follow-up in the ERSPC had no effect on the re- sults (data not shown) [23]. Therefore, it is unlikely that a short follow-up period leads to a lack of benefit. In contrast to our finding that screening increased the Pca detection rate but did not lower the risk of death, a recent study concluded that screening increases the detection rate and lowers the risk of death [7]. Lumen et al. conducted an adjusted analysis, exclud- ing studies with a follow-up period <8 yr and those in the con- trol group with a degree of contamination >33.3% [7]. As the possibility of contamination in most studies is high, although not
reported, and there are no established criteria for an acceptable degree of contamination, analysis of contamination excluding the PLCO trial is difficult. Furthermore, the ERSPC follow-up pe- riod differed among countries. In 2012, follow up was <8 yr in some centers. Thus, caution should be used when interpreting the results of an adjusted analysis.
The level of evidence for all-cause and Pca-specific mortality was moderate, as assessed using the GRADE method. The level of evidence for the diagnosis of Pca was also low. An important reason for the low level of evidence for Pca is heterogeneity.
That is, the heterogeneity of the studies was not problematic, with the exception of Pca diagnosis. The variability in the Pca diagnosis results was high (I2=98%), but should be accepted because the direction of effect was identical, the effect size was relatively large, and the CI was narrow.
Three studies (PLCO, ESRPC, and Göteborg) were rated to have a low risk of bias, while the French ERSPC and Quebec studies had a high or uncertain risk of bias [3, 4, 17-19]. The risk of bias was uncertain in the Norrköping trial, which was in- cluded in the sensitivity analysis [22]. Among the risks of bias, the degree of contamination, which indicates the screening test rate in the control group, can be an important issue in screen- ing. The degree of contamination was circa twice as high in the PLCO than in the ERSPC trials [3, 30]. Other studies did not mention the degree of contamination; however, it is highly likely that most studies had a contamination problem. Because con- tamination negates the benefit of screening, it can be an impor- tant source of bias. As it is not reported by many studies, we could not conduct a sub-group analysis based on the degree of contamination.
Caution should be used when interpreting our results, as we ex- amined the effectiveness of screening asymptomatic subjects who participated in population screening programs rather than the effectiveness of screening among high-risk groups or of hospital-based screening by physicians. Moreover, the inci- dence of Pca varies among races and countries. Although the studies were not limited to specific races, they were conducted in Europe and the US. Therefore, if our results are to be used as a basis for a screening recommendation in Asia, a number of factors should be considered. A large RCT with Asian popula- tion is required to determine the effectiveness of PSA screening.
CONCLUSIONS
PSA screening did not increase early detection of Pca and did not lower the risk of death. Thus PSA screening was ineffective
but did indicate risks caused by overdiagnosis. Thus, the neces- sity of a national PSA screening program should be reviewed carefully with due consideration of the results of future studies.
Authors’ Disclosures of Potential Conflicts of Interest
No potential conflicts of interest relevant to this article were re- ported.
Acknowledgments
This study was supported by a grant from the National R & D Program for Cancer Control, Ministry for Health and Welfare, Republic of Korea (1020430).
REFERENCES
1. Ferlay J, Shin HR, Bray F, Forman D, Mathers C, Parkin DM. Estimates of worldwide burden of cancer in 2008: GLOBOCAN 2008. Int J Cancer 2010;127:2893-917.
2. Center MM, Jemal A, Lortet-Tieulent J, Ward E, Ferlay J, Brawley O, et al. International Variation in Prostate Cancer Incidence and Mortality Rates. Eur Urol 2012;61:1079-92.
3. Andriole GL, Crawford ED, Grubb RL 3rd, Buys SS, Chia D, Church TR, et al. Mortality results from a randomized prostate-cancer screening tri- al. N Engl J Med 2009;360:1310-9.
4. Schröder FH, Hugosson J, Roobol MJ, Tammela TLJ, Ciatto S, Nelen V, et al. Screening and prostate-cancer mortality in a randomized Europe- an study. N Engl J Med 2009;360:1320-8.
5. Djulbegovic M, Beyth RJ, Neuberger MM, Stoffs TL, Vieweg J, Djulbe- govic B, et al. Screening for prostate cancer: systematic review and me- ta-analysis of randomised controlled trials. BMJ 2010;341:c4543. 6. Ilic D, O’Connor D, Green S, Wilt TJ. Screening for prostate cancer. Co-
chrane Database Syst Rev, 2010;11.
7. Lumen N, Fonteyne V, De Meerleert G, Ost P, Villeirs G, Mottrie A, et al.
Population screening for prostate cancer: an overview of available stud- ies and meta‐analysis. Int J Urol 2012;19:100-8.
8. Romero FR, Romero AW, Brenny Filho T, Bark NM, Yamazaki DS, de Oliveira FC. Patients’ perceptions of pain and discomfort during digital rectal exam for prostate cancer screening. Arch Esp Urol 2008;61:850-4. 9. Hamashima C, Nakayama T, Sagawa M, Saito H, Sobue T. The Japa- nese guideline for prostate cancer screening. Jpn J Clin Oncol 2009;39: 339-51.
10. Heidenreich A, Bellmunt J, Bolla M, Joniau S, Mason M, Matveev V, et al. EAU guidelines on prostate cancer. Part 1: screening, diagnosis, and treatment of clinically localised disease. Eur Urol 2011;59:61-71. 11. Wolf AM, Wender RC, Etzioni RB, Thompson IM, D’Amico AV, Volk RJ,
et al. American Cancer Society guideline for the early detection of pros- tate cancer: update 2010. CA Cancer J Clin 2010;60:70-98.
12. Harvey P, Basuita A, Endersby D, Curtis B, Iacovidou A, Walker M. A systematic review of the diagnostic accuracy of prostate specific anti- gen. BMC Urol 2009;9:14.
13. Crawford ED and Abrahamsson PA. PSA-based screening for prostate cancer: how does it compare with other cancer screening tests? Eur
Urol 2008;54:262-73.
14. White CM, Ip S, McPheeters M, Cary TS., Chou R, Lohr KN, et al. Using existing systematic reviews to replace de novo processes in conducting comparative effectivenss reviews. In. Methods guide for comparative ef- fectiveness reviews. Rockville: Agency for Healthcare Research and Quality, 2009.
15. Shea BJ, Grimshaw JM, Wells GA, Boers M, Andersson N, Hamel C, et al. Development of AMSTAR: a measurement tool to assess the meth- odological quality of systematic reviews. BMC Med Res Methodol 2007; 7:10.
16. Deeks JJ, Higgins JPT, Altman DG. Chapter 9: Analysing data and ud- ertaking meta-analyses. In. Higgins JPT, Green S, eds. Cochrane hand- book for systematic reviews of interventions (updated March 2011). The Cochrane Collaboration, 2011.
17. Hugosson J, Carlsson S, Aus G, Bergdahl S, Khatami A, Lodding P, et al. Mortality results from the Göteborg randomised population-based prostate-cancer screening trial. Lancet Oncol 2010;11:725-32.
18. Labrie F, Candas B, Cusan L, Gomez JL, Bélanger A, Brousseau G, et al. Screening decreases prostate cancer mortality: 11‐year follow‐up of the 1988 Quebec prospective randomized controlled trial. Prostate 2004;59:311-8.
19. Jegu J, Tretarre B, Grosclaude P, Rebillard X, Bataille V, Malavaud B, et al. Results and participation factors to the European Randomized study of Screening for Prostate Cancer (ERSPC) with Prostate Specific Antigen:
French departments of Tarn and Hérault. Prog Urol 2009;19:487-98. 20. Kjellman A, Akre O, Norming U, Törnblom M, Gustafsson O. 15-year
followup of a population based prostate cancer screening study. J Urol 2009;181:1615-21.
21. Sandblom G, Varenhorst E, Löfman O, Rosell J, Carlsson P. Clinical consequences of screening for prostate cancer: 15 years follow-up of a randomised controlled trial in Sweden. Eur Urol 2004;46:717-23. 22. Sandblom G, Varenhorst E, Rosell J, Löfman O, Carlsson P. Ran-
domised prostate cancer screening trial: 20 year follow-up. BMJ 2011;342:d1539.
23. Schröder FH, Hugosson J, Roobol MJ, Tammela TL, Ciatto S, Nelen V, et al. Prostate-cancer mortality at 11 years of follow-up. N Engl J Med 2012;366:981-90.
24. Andriole GL, Crawford ED, Grubb RL 3rd, Buys SS, Chia D, Church TR, et al. Prostate cancer screening in the randomized Prostate, Lung, Colorectal, and Ovarian Cancer Screening Trial: mortality results after 13 years of follow-up. J Natl Cancer Inst 2012;104:125-32.
25. Moyer VA; U.S. Preventive Services Task Force. Screening for prostate cancer: U.S. Preventive Services Task Force recommendation state- ment. Ann Intern Med 2012;157:120-34.
26. Lee EH, Han MA, Lee HY, Jun JK, Choi KS, Park EC. Liver cancer screening in Korea: a report on the 2008 National Cancer Screening Programme. Asian Pac J Cancer Prev 2010;11:1305-10.
27. Hahm MI, Choi KS, Lee HY, Jun JK, Oh D, Park EC. Who participates in the gastric cancer screening and on-time rescreening in the National Cancer Screening Program? A population-based study in Korea. Cancer Sci 2011;102:2241-7.
28. Welch HG and Black WC. Overdiagnosis in cancer. J Natl Cancer Inst 2010;102:605-13.
29. Draisma G, Etzioni R, Tsodikov A, Mariotto A, Wever E, Gulati R, et al.
Lead time and overdiagnosis in prostate-specific antigen screening: im- portance of methods and context. J Natl Cancer Inst 2009;101:374-83. 30. Roobol MJ, Kerkhof M, Schröder FH, Cuzick J, Sasieni P, Hakama M,
et al. Prostate cancer mortality reduction by prostate-specific antigen- based screening adjusted for nonattendance and contamination in the European Randomised Study of Screening for Prostate Cancer (ER- SPC). Eur Urol 2009;56:584-91.
![Table 1. Comparison of the included randomized controlled trials (RCTs) Ilic (2010) [6] Djulbegovic(2010) [5] RCTs included in this study ERSPC, 2009 [4] O O O Norrköping, 2011 [22] X X O](https://thumb-ap.123doks.com/thumbv2/123dokinfo/5190304.114127/5.892.468.802.136.1096/comparison-included-randomized-controlled-djulbegovic-included-erspc-norrköping.webp)