Background and Purpose Diabetes mellitus (DM) has been proposed as a risk factor for car- pal tunnel syndrome (CTS), but this remains controversial. We investigated the association be- tween DM and CTS using both ultrasonography (US) and nerve conduction study (NCS) data.
Methods We analyzed a prospectively recruited database of neuromuscular US and medical re- cords of subjects who had undergone NCSs and electromyography for symptoms suggestive of CTS. Subjects were assigned to the follow groups: Group I, CTS with DM; Group II, CTS with- out DM; Group III, no CTS with DM; and Group IV, no CTS without DM. US cross-sectional area (CSA) and NCS measurements at the median nerve (MN) were compared among groups.
We used a general linear mixed model to adjust for statistically significant covariates.
Results The 230 participants comprised 22, 83, 19, and 106 in Groups I–IV, respectively. In multivariate analyses, the MN action potential amplitude in females was the only variable that was significantly associated with DM (p<0.001). Groups with DM tended to have a longer la- tency, smaller amplitude, and lower conduction velocity in the NCSs compared to groups without DM. The measured US CSA values did not differ significantly among the groups.
Conclusions NCS measurements of the MN tended to differ between DM and non-DM pa- tients regardless of the presence or absence of CTS. However, US did not reveal any statistically significant relationship between CTS and DM.
Key Words diabetes mellitus, carpal tunnel syndrome, ultrasonography.
Does Diabetes Mellitus Influence Carpal Tunnel Syndrome?
INTRODUCTION
Carpal tunnel syndrome (CTS) is a common clinical condition caused by entrapment of the median nerve (MN) at the flexor retinaculum of the wrist. Various factors including repeti- tive wrist movements, obesity, hypothyroidism, pregnancy, diabetes mellitus (DM), and rheumatoid arthritis are considered to be risk factors for CTS.1-3
Several studies have examined whether DM influences the development of CTS,4-6 but their results have been inconsistent. The pathomechanism underlying how DM affects the MN is unclear. Furthermore, the exact cause and pathogenesis of CTS are still unclear,7 and the nature of diabetic neuropathy is also controversial since it might be axonal and/or demye- linating.8 In addition, most studies have performed statistical analyses that did not consider important covariates such as the side of the hand.9,10 Although DM might systemically affect the peripheral nervous system, it is uncertain how much DM influences focal peripheral neuropathies such as CTS.
A nerve conduction study (NCS) is one of the most sensitive and specific tools for diag- nosing CTS,11 and is therefore widely used. However, the NCS criteria for discriminating CTS from other disorders of the MN have not been standardized. Moreover, the severity of Yoo Hwan Kima,b
Kyung-Sook Yangc Hanjun Kima Hung Youl Seoka Jung Hun Leed Myeong Hun Sond Byung-Jo Kima,e
a Department of Neurology, Korea University Anam Hospital, Korea University College of Medicine, Seoul, Korea
b Department of Neurology, Hangang Sacred Heart Hospital, Hallym University Medical Center, Seoul, Korea
c Department of Biostatistics, Korea University College of Medicine, Seoul, Korea
d Neurophysiology Laboratory, Korea University Anam Hospital, Seoul, Korea
e Brain Convergence Research Center, Korea University Anam Hospital, Seoul, Korea
pISSN 1738-6586 / eISSN 2005-5013 / J Clin Neurol 2017;13(3):243-249 / https://doi.org/10.3988/jcn.2017.13.3.243
Received February 24, 2017 Revised April 28, 2017 Accepted April 28, 2017 Correspondence Byung-Jo Kim, MD, PhD Department of Neurology, Korea University Anam Hospital, Korea University College of Medicine, 73 Inchon-ro, Seongbuk-gu, Seoul 02841, Korea Tel +82-2-920-6619 Fax +82-2-925-2472 E-mail [email protected]
cc This is an Open Access article distributed under the terms of the Creative Commons Attribution Non-Com- mercial License (http://creativecommons.org/licenses/by-nc/4.0) which permits unrestricted non-commercial use, distribution, and reproduction in any medium, provided the original work is properly cited.
JCN
Open Access ORIGINAL ARTICLEImpact of DM on CTS
JCN
symptoms is not always correlated with NCS findings.12 Ul- trasonography (US) cross-sectional area (CSA) measurement of the MN has recently been suggested as a complementary method for diagnosing CTS.13 However, previous studies that have used US to investigate CTS in patients with DM did not consider the effect of diffuse polyneuropathy on CTS.14,15
We performed this study with the aim of determining the relationship between DM and CTS. We used US CSA as a variable in addition to NCSs to investigate both electrophysi- ologic and morphologic changes of the MN in patients with DM.13,16 We applied a strict statistical design in order to min- imize the effects of confounding factors.
METHODS
Subjects
We searched a prospectively recruited neuromuscular US database of a university-affiliated neurology clinic to identify patients who had undergone NCSs and electromyography (EMG) in an upper extremity or in both upper and lower ex- tremities for localized sensory disturbance in the palm of the lateral hand between April 2013 and June 2016. A thorough medical record review was applied to exclude patients with any medical conditions other than DM that could cause pe- ripheral neuropathy. The exclusion criteria also included a history consistent with any cervical spine-related problem, muscle disease, neuromuscular junction disorder, or chronic alcohol intake.
The NCS and EMG results were reviewed to exclude pa- tients who had any abnormal findings except CTS. The pa- tients were then subdivided into two subgroups: 1) those who met the electrodiagnostic criteria for CTS17 and 2) those who had NCS and EMG values within the normal ranges.
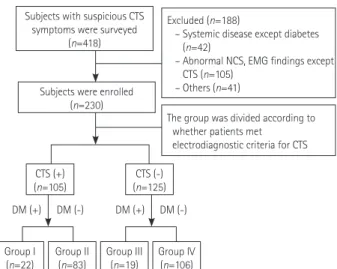
Only patients with CTS in both hands were included in or- der to make the statistical analysis more rigorous. The two patient groups were further subgrouped into the following four groups according to the medical history of DM as diag- nosed based on the current diagnostic criteria:18 Group I, CTS with DM; Group II, CTS without DM; Group III, no CTS with DM; and Group IV, no CTS without DM (Fig. 1).
Demographic data such as age, sex, height, weight, body mass index (BMI), and blood glucose level were collected at the time of the study. The Institutional Review Board of our in- stitution approved the study protocol.
Electrophysiology study
NCSs and EMG were performed using standard electrodiag- nostic equipment (Viking IV, Nicolet Biomedical, Madison, WI, USA). The preparation of all patients and all equipment settings and stimulations followed standard protocols.19-21
The findings of NCSs and EMG performed on four muscles in each extremity were reviewed.
Only data of the MN from the NCS were used in this study.
The MN motor study was performed with stimulation at the wrist, antecubital fossa, and axilla, with recording at the ab- ductor pollicis brevis. The onset latency, amplitude of the compound muscle action potential (CMAP), and conduction velocity (CV) were collected. Using the orthodromic method, sensory studies were performed for the amplitude of the sen- sory-nerve action potential (SNAP), peak latency, and CV. If the MN sensory NCS results were normal, a comparison test was performed to compare the sensory conduction values of the MN and ulnar nerve (UN) between the wrist and ring fingers. The MN and UN were stimulated at the ring finger using a ring electrode and recorded at 14 cm from the ring finger at the wrist. Differences between the MN and UN laten- cies of ≥0.5 ms were considered abnormal.22 CTS was classi- fied into six grades based on a Canterbury electrophysiologic grading scale.17
US study
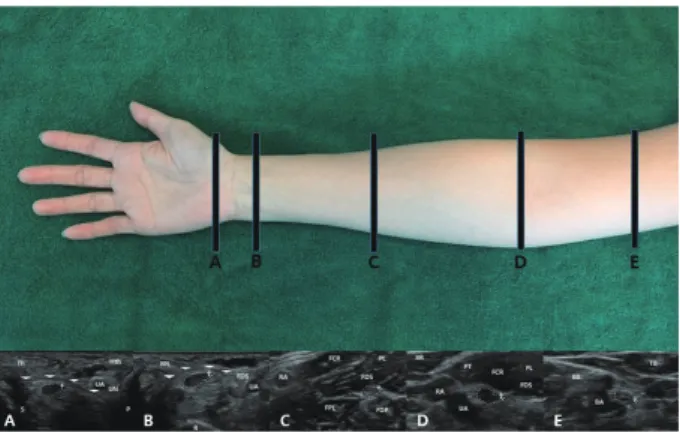
US was performed bilaterally using a 5–12 MHz linear array transducer (HD15 system, Philips Ultrasound, Bothell, WA, USA). The US evaluations followed a previously described methodology.23,24 CSA values of the MN were measured at the following five points with anatomical or clinical signifi- cance considering the location of the stimulation points in NCSs: location A, the mid-flexor retinaculum (outlet of the carpal tunnel); location B, the proximal flexor retinaculum (inlet of the carpal tunnel); location C, the mid-forearm; lo- cation D, the antecubital fossa; and location E, the mid-por- tion of the upper arm. US tests were performed by tracing nerves from the distal to the proximal region. The CSA at the
Subjects with suspicious CTS symptoms were surveyed
(n=418)
Excluded (n=188)
– Systemic disease except diabetes (n=42)
– Abnormal NCS, EMG findings except CTS (n=105)
– Others (n=41)
The group was divided according to whether patients met
electrodiagnostic criteria for CTS Subjects were enrolled
(n=230)
DM (+) DM (-) DM (+) DM (-)
Group I
(n=22) Group II
(n=83) Group III
(n=19) Group IV (n=106) CTS (+)
(n=105) CTS (-)
(n=125)
Fig. 1. Flow chart of subject selection. CTS: carpal tunnel syndrome, DM: diabetes mellitus, EMG: electromyography, NCS: nerve conduc- tion study.
Kim YH et al.
JCN
relevant point of each nerve was measured by manually trac- ing just inside the hyperechoic rim of the nerve (Fig. 2).
Statistical analyses
Continuous variables are reported as mean±standard devia-
tion and median values, and categorical values are reported as counts (percentages). The Kolmogorov-Smirnov test showed that none of the continuous variables except for the CMAP amplitude and the SNAP CV of the MN conformed to a nor- mal distribution.
In univariate analyses, Kruskal-Wallis tests were used to evaluate the significance of mean differences in CSA values and NCS parameters between the four groups. Mann-Whit- ney tests were also used for multiple comparisons between groups with Bonferroni correction, with p<0.0083 (=0.05/6) considered indicative of statistical significance. Pearson’s chi- square test was used to analyze associations between pairs of categorical variables.
Dependent variables were measured repeatedly on the right- and left-hand sides for all participants. We fitted gener- al linear mixed models with unstructured covariance structures for all dependent variables except the MN CMAP amplitude to determine whether the effects of groups were statistically sig- nificant after adjusting for the effects of covariates such as sex, age, side (left and right), location of US, site of the NCS, and group (Groups I, II, III, and IV), and for sex×site, sex×side, site×side, and site×group. We fitted a general linear mixed model with an autoregressive (order-1) covariance structure for the MN CMAP amplitude in the same way.
Probability values with Bonferroni correction were used Table 1. Baseline characteristics of the 230 participants
Group I CTS (+), DM (+)
(n=22)
Group II CTS (+), DM (–)
(n=83)
Group III CTS (–), DM (+)
(n=19)
Group IV CTS (–), DM (–)
(n=106)
p
Sex, male (%) 6 (27.3) 12 (14.5) 16 (84.2) 47 (44.3) <0.001
Age, years 62.3±9.6 (62.5) 56.6±1.5 (57.0) 53.8±9.8 (52.0) 47.7±12.9 (48.5) <0.001
Height, m 164.8±7.3 (166.0) 155.6±5.7 (154.7) 166.4±10.4 (168.0) 163.1±6.6 (161.0) 0.257
Weight, kg 66.7±9.7 (61.3) 64.7±3.8 (66.8) 75.4±9.2 (72.0) 64.4±12.0 (67.0) 0.281
BMI, kg/m2 24.5±2.1 (24.7) 26.9±3.4 (27.9) 27.3±3.6 (26.5) 24.7±3.2 (25.0) 0.333
Glucose, mg/dL 145.7±33.2 (123.0) 101.4±16.1 (97.0) 138.0±31.1 (133.0) 102.9±16.0 (101.0) <0.001 CTS grade (%)
Grade 1
Right/left 2 (9.1)/1 (4.5) 9 (10.8)/6 (7.2) 0.820/0.954
Grade 2
Right/left 8 (36.4)/12 (54.7) 37 (44.6)/41 (49.5) Grade 3
Right/left 6 (27.3)/5 (22.7) 15 (18.1)/20 (24.1) Grade 4
Right/left 2 (9.1)/1 (4.5) 11 (13.3)/8 (9.6) Grade 5
Right/left 3 (13.6)/2 (9.1) 6 (7.2)/5 (6.0) Grade 6
Right/left 1 (4.5)/1 (4.5) 5 (6.0)/3 (3.6) Data are n (%) or mean±standard deviation (median) values.
BMI: body mass index, CTS: carpal tunnel syndrome, DM: diabetes mellitus.
Fig. 2. Ultrasonography cross-sectional area measurements at five lo- cations of the median nerve. A: Mid-flexor retinaculum. B: Proximal flexor retinaculum. C: Mid-forearm. D: Antecubital fossa. E: Mid-por- tion of the upper arm. White arrows: flexor retinaculum; dotted lines, median nerve. BA: brachial artery, BB: biceps brachii, BR: brachioradia- lis, FCR: flexor carpi radialis, FDP: flexor digitorum profundus, FDS:
flexor digitorum superficialis, FPL: flexor pollicis longus, Hth: hypothe- nar muscle, P: pisiform, PL: palmaris longus, PT: pronator teres, R: radi- us, RA: radial artery, S: scaphoid, TB: triceps brachii, Th: thenar muscle, UA: ulnar artery.
Impact of DM on CTS
JCN
for multiple comparisons. When we fitted the general linear mixed models, a natural-logarithm transformation was ap- plied to the dependent variables except for the MN CMAP amplitude and MN SNAP CV to improve that fit of the data to a normal distribution.
Statistical analyses were performed using IBM SPSS Sta- tistics for Windows (version 22.0, IBM, Armonk, NY, USA), MedCalc for Windows (version 16.4, MedCalc Software, Os- tend, Belgium), and SAS (version 9.4, SAS Institute, Cary, NC, USA). p<0.05 was considered statistically significant (except with Bonferroni correction), and p<0.1 was consid- ered to indicate a tendency that was marginally significant.
RESULTS
Subject characteristics
In total, 230 patients were finally selected for analysis and as- signed to the 4 study groups as follows: 22 in Group I, 83 in Group II, 19 in Group III, and 106 in Group IV. The propor-
tion of patients with CTS was 53.7% (22/41) in the two groups with DM (Groups I and III) versus 43.9% (83/189) in the two groups without DM (Groups II and IV). The proportion of males was higher in Groups III and IV (without CTS) than in the two groups with CTS. The median age also differed significantly among the four groups. The demographic char- acteristics of the four groups are presented in Table 1.
US data
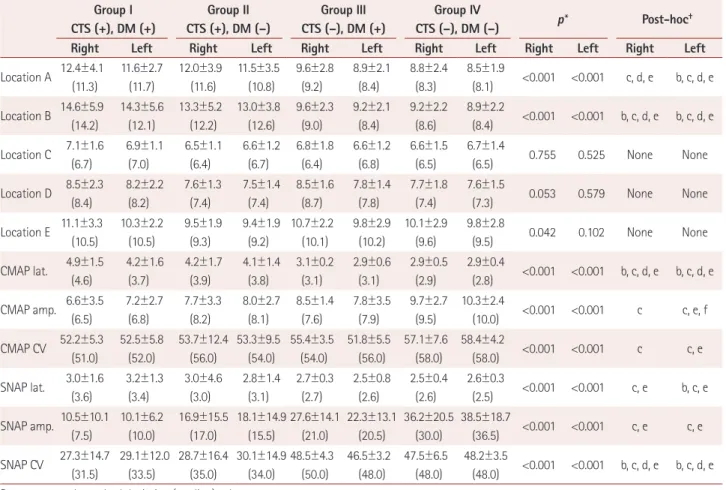
CSA values of the MN measured at each location for the four groups and the results of univariate analyses are listed in Ta- ble 2. In pairwise comparisons, the median CSA values at the outlet (location A) and inlet (location B) of the carpal tunnel in both wrists were significantly larger in Groups I and II than in Group IV (p<0.001). These CSA values were also sig- nificantly larger in Group II than Group III (p<0.001) and significantly larger in Group I than in Group III (p=0.002) at location B. However, the median CSA values did not differ significantly between Groups I and II at any location, between
Table 2. US CSA measurement at five locations and electrophysiology studies of the MN in the four study groups Group I
CTS (+), DM (+)
Group II CTS (+), DM (–)
Group III CTS (–), DM (+)
Group IV
CTS (–), DM (–) p* Post-hoc†
Right Left Right Left Right Left Right Left Right Left Right Left
Location A 12.4±4.1 (11.3)
11.6±2.7 (11.7)
12.0±3.9 (11.6)
11.5±3.5 (10.8)
9.6±2.8 (9.2)
8.9±2.1 (8.4)
8.8±2.4 (8.3)
8.5±1.9
(8.1) <0.001 <0.001 c, d, e b, c, d, e Location B 14.6±5.9
(14.2)
14.3±5.6 (12.1)
13.3±5.2 (12.2)
13.0±3.8 (12.6)
9.6±2.3 (9.0)
9.2±2.1 (8.4)
9.2±2.2 (8.6)
8.9±2.2
(8.4) <0.001 <0.001 b, c, d, e b, c, d, e Location C 7.1±1.6
(6.7)
6.9±1.1 (7.0)
6.5±1.1 (6.4)
6.6±1.2 (6.7)
6.8±1.8 (6.4)
6.6±1.2 (6.8)
6.6±1.5 (6.5)
6.7±1.4
(6.5) 0.755 0.525 None None
Location D 8.5±2.3 (8.4)
8.2±2.2 (8.2)
7.6±1.3 (7.4)
7.5±1.4 (7.4)
8.5±1.6 (8.7)
7.8±1.4 (7.8)
7.7±1.8 (7.4)
7.6±1.5
(7.3) 0.053 0.579 None None
Location E 11.1±3.3 (10.5)
10.3±2.2 (10.5)
9.5±1.9 (9.3)
9.4±1.9 (9.2)
10.7±2.2 (10.1)
9.8±2.9 (10.2)
10.1±2.9 (9.6)
9.8±2.8
(9.5) 0.042 0.102 None None
CMAP lat. 4.9±1.5 (4.6)
4.2±1.6 (3.7)
4.2±1.7 (3.9)
4.1±1.4 (3.8)
3.1±0.2 (3.1)
2.9±0.6 (3.1)
2.9±0.5 (2.9)
2.9±0.4
(2.8) <0.001 <0.001 b, c, d, e b, c, d, e CMAP amp. 6.6±3.5
(6.5)
7.2±2.7 (6.8)
7.7±3.3 (8.2)
8.0±2.7 (8.1)
8.5±1.4 (7.6)
7.8±3.5 (7.9)
9.7±2.7 (9.5)
10.3±2.4
(10.0) <0.001 <0.001 c c, e, f CMAP CV 52.2±5.3
(51.0)
52.5±5.8 (52.0)
53.7±12.4 (56.0)
53.3±9.5 (54.0)
55.4±3.5 (54.0)
51.8±5.5 (56.0)
57.1±7.6 (58.0)
58.4±4.2
(58.0) <0.001 <0.001 c c, e SNAP lat. 3.0±1.6
(3.6)
3.2±1.3 (3.4)
3.0±4.6 (3.0)
2.8±1.4 (3.1)
2.7±0.3 (2.7)
2.5±0.8 (2.6)
2.5±0.4 (2.6)
2.6±0.3
(2.5) <0.001 <0.001 c, e b, c, e SNAP amp. 10.5±10.1
(7.5)
10.1±6.2 (10.0)
16.9±15.5 (17.0)
18.1±14.9 (15.5)
27.6±14.1 (21.0)
22.3±13.1 (20.5)
36.2±20.5 (30.0)
38.5±18.7
(36.5) <0.001 <0.001 c, e c, e SNAP CV 27.3±14.7
(31.5)
29.1±12.0 (33.5)
28.7±16.4 (35.0)
30.1±14.9 (34.0)
48.5±4.3 (50.0)
46.5±3.2 (48.0)
47.5±6.5 (48.0)
48.2±3.5
(48.0) <0.001 <0.001 b, c, d, e b, c, d, e Data are mean±standard deviation (median) values.
*p values in Kruskal-Wallis tests, †Letters from a to f indicate significant differences in groupwise pairwise comparisons in the Mann-Whitney test with Bonferroni correction as follows: a: I vs. II, b: I vs. III, c: I vs. IV, d: II vs. III, e: I vs. IV, and f: III vs. IV.
amp.: amplitude, CMAP: compound muscle action potential, CSA: cross-sectional area, CTS: carpal tunnel syndrome, CV: conduction velocity, DM: dia- betes mellitus, lat.: latency, MN: median nerve, SNAP: sensory-nerve action potential, US: ultrasonography.
Kim YH et al.
JCN
Groups III and IV at locations A and B, or between any of the groups for the MN at locations C, D, and E.
Comparison of NCS results
Descriptive statistics of the results of univariate analyses of NCS data for the MN on both sides are provided in Table 2.
There were marginally significant differences in several NCS values. The right MN CMAP CV and the SNAP latency tend- ed to be lower and longer, respectively, in Group I than Group II (p<0.1). The left MN amplitude and the CV of CMAP also tended to be smaller and lower in Group III than Group IV.
Multivariate comparison of US and electrophysiology data
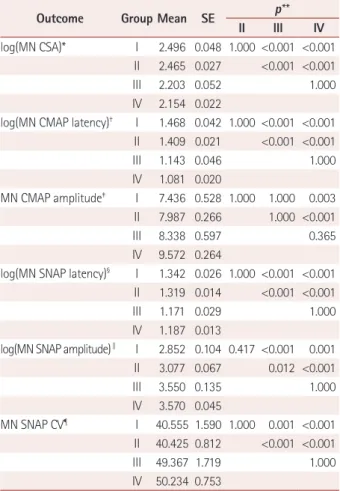
Table 3 presents the results of multiple comparisons of mean values among groups obtained by fitting general linear mixed models adjusted for statistically significant covariates. There were significant differences among the following covariates:
sex, group, age, and location in the model for log(MN CSA);
and sex, site, side, age, group, sex×site, sex×side, site×group, and side×group in the model for MN SNAP CV.
The mean difference in the estimated log(MN CSA) was 0.293 between Groups I and III (p<0.001), 0.342 between Groups I and IV (p<0.001), 0.262 between Groups II and III (p<0.001), and 0.311 between Groups II and IV (p<0.001). The mean difference in the estimated log(MN CSA) was calculated by subtracting the mean of the estimated CSA for Group III from the mean for Group I, which yielded exp(0.293)=1.34;
this value represents the actual CSA difference between Groups I and III. The mean difference in the estimated log(MN CSA) did not differ significantly between Groups I and II or between Groups III and IV.
The mean difference in the estimated log(MN CMAP la- tency) was 0.325 between Groups I and III (p<0.001), 0.387 between Groups I and IV (p<0.001), 0.266 between Groups II and III (p<0.001), and 0.328 between Groups II and IV (p<0.001). Pairwise comparisons of log(MN SNAP latency) and MN SNAP CV were similar to pairwise comparisons of log(MN CSA) and log(MN SNAP latency). The mean differ- ence in the estimated MN CMAP amplitude was only signif- icant for Groups I and II compared to Group IV.
The only significant difference in the estimated mean dif- ference for log(MN SNAP amplitude) was between females in Groups I and II after fitting a general linear mixed model (p<0.001).
DISCUSSION
Multivariate analysis revealed that the MN SNAP amplitude in NCSs of females was the only variable significantly asso- ciated with DM (p<0.001). Groups with DM tended to have a longer latency, smaller amplitude, and a lower CV compared to groups without DM, but these differences were only mar- ginally significant (p<0.1). The measured US CSA values did not differ between groups with and without DM except at sites related to CTS.
Many studies have investigated the relationship between DM and CTS based on the assumption that DM makes pe- ripheral nerves susceptible to entrapment.25,26 A population- based cohort study revealed that the prevalence of CTS was higher in patients with diabetes.7 A meta-analysis found DM to be one of the risk factors for CTS.27 In contrast, a retrospec- Table 3. Multiple comparisons of means among groups obtained by
fitting general linear mixed models to US and electrophysiology find- ings
Outcome Group Mean SE p**
II III IV
log(MN CSA)* I 2.496 0.048 1.000 <0.001 <0.001 II 2.465 0.027 <0.001 <0.001
III 2.203 0.052 1.000
IV 2.154 0.022
log(MN CMAP latency)† I 1.468 0.042 1.000 <0.001 <0.001 II 1.409 0.021 <0.001 <0.001
III 1.143 0.046 1.000
IV 1.081 0.020
MN CMAP amplitude‡ I 7.436 0.528 1.000 1.000 0.003 II 7.987 0.266 1.000 <0.001
III 8.338 0.597 0.365
IV 9.572 0.264
log(MN SNAP latency)§ I 1.342 0.026 1.000 <0.001 <0.001 II 1.319 0.014 <0.001 <0.001
III 1.171 0.029 1.000
IV 1.187 0.013
log(MN SNAP amplitude)∥ I 2.852 0.104 0.417 <0.001 0.001 II 3.077 0.067 0.012 <0.001
III 3.550 0.135 1.000
IV 3.570 0.045
MN SNAP CV¶ I 40.555 1.590 1.000 0.001 <0.001 II 40.425 0.812 <0.001 <0.001
III 49.367 1.719 1.000
IV 50.234 0.753
*Adjustment for sex, location, side, group, and sex×location in the gen- eral linear mixed model, †Adjustment for side, group, and age in the general linear mixed model, ‡Adjustment for group and age in the gen- eral linear mixed model, §Adjustment for sex, site, age, group, sex×site, and site×group,∥Adjustment for sex, site, age, group, sex×site, sex×group, and site×group, ¶Adjustment for sex, site, side, age, group, sex×side, and site×group, **Bonferroni-corrected p values for pairwise comparisons.
CMAP: compound muscle action potential, CSA: cross-sectional area, CV: conduction velocity, MN: median nerve, SE: standard error, SNAP:
sensory-nerve action potential, US: ultrasonography.
Impact of DM on CTS
JCN
tive case–control study found that type-2 DM was not asso- ciated with CTS in multivariate analyses after adjusting for sex, age, and BMI.28 A similar case–control study suggested that being female, obese, and older were independent risk fac- tors for CTS, but that DM was not significantly associated with CTS.29 A study involving a Dutch population with matched age and sex groups also did not find a relationship between DM and CTS.1
The discrepancies among studies mean that it remains un- clear whether DM is a real risk factor for CTS. These discrep- ancies may be due to the limitations of using NCSs to diag- nose CTS. Although an NCS is one of the most sensitive and specific tools for diagnosing CTS,11,30 the severity of symptoms is not always correlated with NCS findings,12 and morphologic changes of the MN that occur in CTS are not well reflected in an NCS. In addition, the exact pathogenic mechanisms under- lying CTS and diabetic neuropathy are unclear. Several mech- anisms including mechanical compression and microvascular insufficiency have been suggested to cause CTS.6,31 It is also unclear whether diabetic neuropathy is axonal and/or demy- elinating.8,32 Another reason for the discrepant findings among previous studies may be that most of them have assigned pa- tients to groups by simply counting the total numbers of hands on both sides or the hand from only one side, without consid- ering the effects of various covariates like in the present study, such as side (left and right), site of the NCS, group, sex×site, sex×side, site×side, and site×group.9,10,15,33 This could have in- troduced errors into the analyses. Lastly, previous studies have investigated CTS without considering whether or not polyneu- ropathy is superimposed, and so CTS by entrapment and polyneuropathy due to systemic metabolic disturbance were not clearly discriminated in the statistical analyses.
We addressed some of these issues by strictly controlling the group compositions. Subjects with any systemic disease other than DM were excluded. To exclude diabetic polyneu- ropathy, which may be a confounding variable when analyz- ing the influence of DM on CTS, only patients with complete- ly normal NCS and EMG results (other than for CTS) were enrolled. Moreover, most previous studies have focused pri- marily on the relationship between DM and CTS, whereas our study design made it possible to determine the impact of DM in non-CTS patients as well.
We added US data to overcome some of the limitations of the NCS. US is an easily available noninvasive method that can be used to evaluate detailed nerve structures, morphologies, and CSA values. The combination of NCSs and US was pre- viously suggested to increase the accuracy of diagnosing CTS in patients with DM.10 To avoid statistical errors, we consid- ered multiple interactions among covariates to evaluate the isolated effect of DM on CTS. Instead of counting the total
number of hands on either side or dividing patients into groups based on hand, we divided groups based on patients taking into account side (left and right) effects as covariates.
This study was subject to several limitations. First, we did not consider prediabetes or the duration of DM, which might be confounding factors for the risk of CTS. Second, the sam- ple was small. However, we decreased bias by selecting sub- jects using a strict statistical design.
In this study–which applied rigorous statistical analyses to overcome some of the limitations of previous studies–there appeared to be more changes in NCS findings for the MN in DM patients than non-DM patients regardless of the pres- ence or absence of CTS. However, US did not reveal a signifi- cant relationship between CTS and DM. Further large-scale studies of US and NCS findings in CTS among diabetic pa- tients are needed for further clarification.
Conflicts of Interest
The authors have no financial conflicts of interest.
Acknowledgements
This work was supported by a National Research Foundation of Korea (NRF) grant funded by the Korean Government (MSIP; no. NRF-2015 R1A5A70 37674).
REFERENCES
1. de Krom MC, Kester AD, Knipschild PG, Spaans F. Risk factors for carpal tunnel syndrome. Am J Epidemiol 1990;132:1102-1110.
2. Silverstein BA, Fine LJ, Armstrong TJ. Occupational factors and car- pal tunnel syndrome. Am J Ind Med 1987;11:343-358.
3. Atroshi I, Gummesson C, Johnsson R, Ornstein E, Ranstam J, Rosén I.
Prevalence of carpal tunnel syndrome in a general population. JAMA 1999;282:153-158.
4. Wilbourn AJ. Diabetic entrapment and compression neuropathies.
In: Dyck PJ, Thomas PK, editors. Diabetic Neuropathy. 2nd ed. Phila- delphia: Saunders, 1999;481-508.
5. Gulliford MC, Latinovic R, Charlton J, Hughes RA. Increased inci- dence of carpal tunnel syndrome up to 10 years before diagnosis of di- abetes. Diabetes Care 2006;29:1929-1930.
6. Aroori S, Spence RA. Carpal tunnel syndrome. Ulster Med J 2008;77:
6-17.
7. Chen LH, Li CY, Kuo LC, Wang LY, Kuo KN, Jou IM, et al. Risk of hand syndromes in patients with diabetes mellitus: a population-based cohort study in Taiwan. Medicine (Baltimore) 2015;94:e1575.
8. Valls-Canals J, Povedano M, Montero J, Pradas J. Diabetic polyneurop- athy. Axonal or demyelinating? Electromyogr Clin Neurophysiol 2002;
42:3-6.
9. Chen SF, Huang CR, Tsai NW, Chang CC, Lu CH, Chuang YC, et al.
Ultrasonographic assessment of carpal tunnel syndrome of mild and moderate severity in diabetic patients by using an 8-point measure- ment of median nerve cross-sectional areas. BMC Med Imaging 2012;
12:15.
10. Watanabe T, Ito H, Morita A, Uno Y, Nishimura T, Kawase H, et al.
Sonographic evaluation of the median nerve in diabetic patients: com- parison with nerve conduction studies. J Ultrasound Med 2009;28:
727-734.
11. Bland JD. Do nerve conduction studies predict the outcome of carpal tunnel decompression? Muscle Nerve 2001;24:935-940.
12. Chan L, Turner JA, Comstock BA, Levenson LM, Hollingworth W,
Kim YH et al.
JCN
Heagerty PJ, et al. The relationship between electrodiagnostic findings and patient symptoms and function in carpal tunnel syndrome. Arch Phys Med Rehabil 2007;88:19-24.
13. Cartwright MS, Hobson-Webb LD, Boon AJ, Alter KE, Hunt CH, Flores VH, et al. Evidence-based guideline: neuromuscular ultrasound for the diagnosis of carpal tunnel syndrome. Muscle Nerve 2012;46:
287-293.
14. Hassan A, Leep Hunderfund AN, Watson J, Boon AJ, Sorenson EJ.
Median nerve ultrasound in diabetic peripheral neuropathy with and without carpal tunnel syndrome. Muscle Nerve 2013;47:437-439.
15. Kim LN, Kwon HK, Moon HI, Pyun SB, Lee HJ. Sonography of the median nerve in carpal tunnel syndrome with diabetic neuropathy.
Am J Phys Med Rehabil 2014;93:897-907.
16. Visser LH, Smidt MH, Lee ML. High-resolution sonography versus EMG in the diagnosis of carpal tunnel syndrome. J Neurol Neurosurg Psychiatry 2008;79:63-67.
17. Bland JD. A neurophysiological grading scale for carpal tunnel syn- drome. Muscle Nerve 2000;23:1280-1283.
18. Kumar R, Nandhini LP, Kamalanathan S, Sahoo J, Vivekanadan M.
Evidence for current diagnostic criteria of diabetes mellitus. World J Diabetes 2016;7:396-405.
19. Koo YS, Cho CS, Kim BJ. Pitfalls in using electrophysiological studies to diagnose neuromuscular disorders. J Clin Neurol 2012;8:1-14.
20. Jablecki CK, Andary MT, Floeter MK, Miller RG, Quartly CA, Ven- nix MJ, et al. Practice parameter: electrodiagnostic studies in carpal tunnel syndrome. Report of the American Association of Electrodi- agnostic Medicine, American Academy of Neurology, and the Ameri- can Academy of Physical Medicine and Rehabilitation. Neurology 2002;58:1589-1592.
21. Kim BJ, Date ES, Park BK, Choi BY, Lee SH. Physiologic changes of compound muscle action potentials related to voluntary contraction and muscle length in carpal tunnel syndrome. J Electromyogr Kinesiol 2005;15:275-281.
22. Werner RA, Andary M. Electrodiagnostic evaluation of carpal tunnel
syndrome. Muscle Nerve 2011;44:597-607.
23. Kim JS, Seok HY, Kim BJ. The significance of muscle echo intensity on ultrasound for focal neuropathy: the median- to ulnar-innervated muscle echo intensity ratio in carpal tunnel syndrome. Clin Neuro- physiol 2016;127:880-885.
24. Jang JH, Cho CS, Yang KS, Seok HY, Kim BJ. Pattern analysis of nerve enlargement using ultrasonography in chronic inflammatory demye- linating polyneuropathy. Clin Neurophysiol 2014;125:1893-1899.
25. Gilliatt RW, Willison RG. Peripheral nerve conduction in diabetic neuropathy. J Neurol Neurosurg Psychiatry 1962;25:11-18.
26. Mulder DW, Lambert EH, Bastron JA, Sprague RG. The neuropathies associated with diabetes mellitus. A clinical and electromyographic study of 103 unselected diabetic patients. Neurology 1961;11Pt 1:275- 27. Spahn G, Wollny J, Hartmann B, Schiele R, Hofmann GO. [Metaanal-284.
ysis for the evaluation of risk factors for carpal tunnel syndrome (CTS) part I. General factors]. Z Orthop Unfall 2012;150:503-515.
28. Hendriks SH, van Dijk PR, Groenier KH, Houpt P, Bilo HJ, Kleefstra N. Type 2 diabetes seems not to be a risk factor for the carpal tunnel syndrome: a case control study. BMC Musculoskelet Disord 2014;15:
29. Becker J, Nora DB, Gomes I, Stringari FF, Seitensus R, Panosso JS, et 346.
al. An evaluation of gender, obesity, age and diabetes mellitus as risk factors for carpal tunnel syndrome. Clin Neurophysiol 2002;113:1429- 1434.
30. Werner RA, Andary M. Carpal tunnel syndrome: pathophysiology and clinical neurophysiology. Clin Neurophysiol 2002;113:1373-1381.
31. Viikari-Juntura E, Silverstein B. Role of physical load factors in carpal tunnel syndrome. Scand J Work Environ Health 1999;25:163-185.
32. Nukada H, McMorran PD. Perivascular demyelination and intramy- elinic oedema in reperfusion nerve injury. J Anat 1994;185:259-266.
33. Moon HI, Kwon HK, Kim L, Lee HJ, Lee HJ. Ultrasonography of palm to elbow segment of median nerve in different degrees of diabetic polyneuropathy. Clin Neurophysiol 2014;125:844-848.