Background and Purpose Elevated postprandial blood glucose is a critical risk factor for stroke. The dietary glycemic load (GL) and glycemic index (GI) are frequently used as markers of the postprandial blood glucose response to estimate the overall glycemic effect of diets. We hypothesized that high dietary GL, GI, or total carbohydrate intake is associated with a poor functional outcome in patients with acute ischemic stroke.
Methods We prospectively included 263 first-ever ischemic stroke patients who completed a semiquantitative food-frequency questionnaire. The dietary GL, GI, and total carbohydrate in- take were investigated by examining the average frequency of intake during the previous year based on reference amounts for various food items. Poor functional outcome was defined as a score on the modified Rankin Scale (mRS) of ≥3 at 3 months after stroke.
Results The patients were aged 65.4±11.7 years (mean±standard deviation), and 58.2% of them were male. A multivariate analysis adjusted for age, sex, marital status, prestroke mRS score, diabetes mellitus, hyperlipidemia, body mass index, triglycerides, low-density lipopro- tein, hemoglobin A1c, stroke classification, and National Institutes of Health Stroke Scale score, early neurological deterioration, and high-grade white-matter hyperintensities revealed that the dietary GL and total carbohydrate intake were associated with a poor functional outcome, with odds ratios for the top quartile relative to the bottom quartile of 28.93 (95% confidence interval=
2.82–296.04) and 36.84 (95% confidence interval=2.99–453.42), respectively (p for trend=0.002 and 0.002, respectively). In contrast, high dietary GI was not associated with a poor functional outcome (p for trend=0.481).
Conclusions Increased dietary GL and carbohydrate intake were associated with a poor short- term functional outcome after an acute ischemic stroke.
Key Words glycemic load, glycemic index, carbohydrate intake, stroke, outcome.
High Dietary Glycemic Load is Associated with Poor Functional Outcome in Patients with Acute Cerebral Infarction
INTRODUCTION
Elevated postprandial blood glucose is a critical risk factor for stroke regardless of the pres- ence of diabetes mellitus,1, 2 and increased postprandial blood glucose is mostly impacted by the dietary carbohydrate intake.3 Because carbohydrates vary in size, fiber content, and chemical structure, the increase in postprandial blood glucose may vary depending on type of carbohydrate ingested.4 The dietary glycemic load (GL) and glycemic index (GI) are frequently used as markers of the postprandial blood glucose response to estimate the overall impact of dietary carbohydrate intake.5
Previous epidemiological cohort studies have revealed that high GL and GI are associated with the risk of stroke.6-8 An increased GI predicted a greater risk of mortality after stroke in Tae-Jin Songa*
Yoonkyung Changa* Min-Young Chuna Chan-Young Leea A-Ram Kimb Yuri Kimb,c Yong-Jae Kima
a Stroke Center, Department of Neurology, Ewha Womans University
School of Medicine, Seoul, Korea
b Department of Clinical Nutrition, The Graduate School of Converging Clinical & Public Health, Seoul, Korea
c Department of Nutritional Science and Food Management,
Ewha Womans University, Seoul, Korea
pISSN 1738-6586 / eISSN 2005-5013 / J Clin Neurol 2018;14(2):165-173 / https://doi.org/10.3988/jcn.2018.14.2.165
Received June 23, 2017 Revised October 25, 2017 Accepted October 27, 2017 Correspondence Yong-Jae Kim, MD, PhD
Stroke Center, Department of Neurology, Ewha Womans University
School of Medicine, 1071 Anyangcheon-ro,
Yangcheon-gu, Seoul 07985, Korea Tel +82-2-2650-5649
Fax +82-2-2650-5958 E-mail [email protected]
*These authors contributed equally to this work.
cc This is an Open Access article distributed under the terms of the Creative Commons Attribution Non-Com- mercial License (http://creativecommons.org/licenses/by-nc/4.0) which permits unrestricted non-commercial use, distribution, and reproduction in any medium, provided the original work is properly cited.
JCN
Open Access ORIGINAL ARTICLEGlycemic Load and Stroke Outcome
JCN
population-based studies in Japan8 and Australia.9 Because stroke can cause serious handicaps and the short-term func- tion after a first ischemic stroke is associated with the long-term outcome,10 risk factors for poor functional outcome should be evaluated after a stroke. The association of the dietary GL or GI with functional outcome at 3 months after ischemic stroke has not been reported.
A high carbohydrate intake related to a high dietary GL or GI has an unfavorable impact on glucose and lipid metabo- lism,11 and the impact could potentially increase the risk of vascular events and poor stroke prognosis.12,13 We therefore hypothesized that high dietary GL, GI, or total carbohydrate intake is associated with a poor functional outcome in patients with acute ischemic stroke. In this study, we investigated the relationship between the dietary GL or GI and the function- al outcome after an acute ischemic stroke.
METHODS
Subjects
We prospectively included 263 patients who were admitted to Ewha Womans University Mokdong Hospital within 7 days after they experienced their first symptomatic ischemic stroke. Patients were evaluated for past medical history, family history, and using brain imaging studies (CT or MRI), vascular imaging studies (digital subtraction angiography, CT angiography, or MR angiography), chest X-ray, 12-lead electrocardiography, transthoracic echocardiography, rou- tine blood tests, and with electrocardiography monitoring for a median period of 3 days at a stroke intensive care unit.
Blood samples were collected within 24 hours of admission and after fasting for more than 12 hours, and the following parameters were analyzed: white blood cell count, hemoglo- bin, fasting glucose, triglycerides, low-density lipoprotein, hemoglobin A1c (HbA1c), insulin, and C-reactive protein.
Strokes were classified according to the Trial of Org 10172 in Acute Stroke Treatment system.14 The severity of neuro- logical deficits was determined by using the National Insti- tutes of Health Stroke Scale (NIHSS) at admission.15,16 Early neurological deterioration was defined as any increase in the NIHSS score within 7 days after admission.17 The extent of white-matter hyperintensities (WMHs) was determined on fluid-attenuated inversion recovery images of periventricu- lar white matter or deep white matter according to the Faze- kas scoring system. A Fazekas score of ≥2 for the periven- tricular white matter and/or of ≥2 for the deep white matter was considered indicative of high-grade WMHs.18 The pres- ence of symptomatic cerebral atherosclerosis was defined as
>50% stenosis and/or occlusion of extracranial and/or intra- cranial arteries that could explain stroke-related symptoms
based on the North American Symptomatic Carotid Endar- terectomy Trial19 or Warfarin-Aspirin Symptomatic Intracra- nial Disease study,20 respectively. To assess functional out- come, the modified Rankin Scale (mRS) was used. Prestroke mRS score and mRS score at 3 months after the index stroke was assessed by a stroke neurologist and/or a well-trained stroke specialist nurse. This study was conducted with the approval of the Institutional Review Board of Ewha Wom- ans University Mokdong Hospital (approval no. ECT 11-59- 21). Informed consent was received from patients and their caregivers.
Semiquantitative food-frequency questionnaire, dietary glycemic load, and glycemic index
The survey was conducted through one-on-one interviews with patients and their caregivers, each of which typically took 20–30 minutes. Dietary intake was assessed with a validated Korean version of a semiquantitative food-frequency ques- tionnaire (SQFFQ).21 The SQFFQ comprised a list of 111 foods, with the average frequency of intake of each food dur- ing the previous year reported based on a reference amount.
The frequency of food intake was categorized into ‘almost never,’ ‘once a month,’ ‘two or three times a month,’ ‘one or two times a week,’ ‘three or four times a week,’ ‘once a day,’
‘two times a day,’ and ‘three times a day.’ The amount of each food consumed was categorized into ‘less than the reference amount,’ ‘the reference amount,’ and ‘more than the reference amount.’ Food and nutrient intakes were calculated with the aid of the Computer-Aided Nutritional Analysis Program (version 4.0, Korea Nutrition Society, Seoul, Korea).21
The GI is a measure of the postprandial blood glucose re- sponse to carbohydrate intake when compared with a refer- ence foodstuff (either glucose or white bread). The GI can be considered an indicator of the quality of dietary carbohy- drates that are consumed. The GI values of foods can be ob- tained from an international table22 or the www.glycemicin- dex.com website. The dietary GI can be calculated as the sum of GI values of each consumed food item, multiplied by the percentage of carbohydrate content and consumption frequency and divided by the total carbohydrate consump- tion. The GL is calculated by multiplying the GI of a food item with available carbohydrate content but without divid- ing by the total carbohydrate consumption, which indicates both the quality and quantity of carbohydrate intake.6 The total carbohydrate intake is measured by summing the scores on validated food-frequency questionnaires.
Risk factors
Hypertension was defined as a resting systolic blood pressure of ≥140 mm Hg or diastolic blood pressure of ≥90 mm Hg on
Song TJ et al.
JCN
repeated measurements, or treatment with antihypertensive medications. Diabetes mellitus was diagnosed if a patient had a fasting blood glucose level of ≥7.0 mmol/L or was be- ing treated with oral hypoglycemic agents or insulin. Hyper- lipidemia was diagnosed for low-density lipoprotein ≥4.1 mmol/L or total cholesterol ≥6.2 mmol/L. Subjects with a re- cent weekly alcohol intake that regularly exceeded 300 g of ethanol were classified as heavy drinkers. Patients were de- fined as smokers if they were current smokers or had stopped smoking within the previous year. Body mass index was cal- culated by dividing body weight by height squared (in units of kg/m2). Patients who had exercised more than once week- ly for the past 6 months were classified as performing regu- lar exercise.23,24 The marital status was categorized into single (including never married, divorced, separated, or bereaved) and married.
Statistical analysis
Statistical analyses were conducted with the Windows SPSS software package (version 18.0, SPSS Inc., Chicago, IL, USA).
The independent t-test, Mann-Whitney U test, one-way anal- ysis of variance with Bonferroni post-hoc analysis, and Kruskal- Wallis test for continuous variables and the chi-square test or Fisher’s exact test for categorical variables were applied to quartiles of the dietary GL, GI, and total carbohydrate intake.
Trends across quartiles were tested by using the median of each quartile as the predictor in linear models for continuous variables and in logistic models for categorical variables.
Functional outcome was dichotomized into good (mRS score
<3) or poor (mRS score ≥3) in a binary logistic regression analysis, and subdivided into mRS scores of 0, 1, 2, and 3–6 in an ordinal logistic regression analysis. Univariate and multivariate binary and ordinal logistic regression analyses–
with a dependent variable of the mRS score at 3 months after the index stroke–were conducted to determine predictive fac- tors for functional outcome. Multivariate analyses were adjust- ed for age, sex, variables with p<0.1 in the univariate analysis (marital status, prestroke mRS score, hyperlipidemia, body mass index, stroke classification, NIHSS score, early neuro- logical deterioration, and high-grade WMHs), and variables related to GL, GI, or total carbohydrate intake (diabetes mel- litus, triglycerides, low-density lipoprotein, and HbA1c).
There was no interaction of dietary GL with diabetes mel- litus or HbA1c (p=0.964 and 0.484, respectively). Multicol- linearity was present between dietary GL and the total car- bohydrate intake (variance inflation factor was higher than 6 when the dependent variable was defined as the functional outcome at 3 months after the index stroke in multivariate linear regression), and so dietary GL, GI, and total carbohy- drate intake were analyzed separately in multivariate analy-
ses. A two-tailed p value of <0.05 was considered indicative of statistical significance.
RESULTS
We first included 306 patients who completed an SQFFQ and were confirmed as having experienced an acute ischemic stroke by brain CT, MRI, or both imaging modalities. Be- cause our study used a survey, patients suspected of having cognitive impairment (Mini-Mental State Examination score
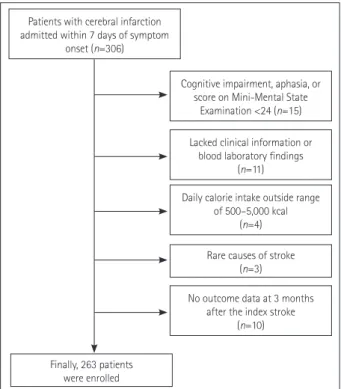
<24) or aphasia were not enrolled (n=15).25 After excluding patients for whom clinical information or blood laboratory findings were lacking (n=11), whose daily calorie intake was outside of the range of 500–5,000 kcal (n=4), who had rare causes of stroke such as arterial dissection (n=2) or venous thrombosis (n=1), and for whom outcome data at 3 months after the index stroke were not available (n=10), finally 263 patients were included in this study (Fig. 1).
The included patients were aged 65.4±11.7 years (mean±
standard deviation), and 153 (58.2%) of them were male.
Their dietary GL and GI were 158.7±72.7 and 59.6±4.8, re- spectively. Stroke classifications of large-artery atherosclero- sis, lacune, and cardioembolism were most common. The median NIHSS score at admission was 3, with an interquar- tile range of 1–6. Demographic data for the study subjects and comparative analyses according to quartiles of the dietary GL are summarized in Table 1. The prevalence of male sex
Patients with cerebral infarction admitted within 7 days of symptom
onset (n=306)
Cognitive impairment, aphasia, or score on Mini-Mental State
Examination <24 (n=15) Lacked clinical information or
blood laboratory findings (n=11)
Daily calorie intake outside range of 500–5,000 kcal
(n=4)
No outcome data at 3 months after the index stroke
(n=10) Rare causes of stroke
(n=3)
Finally, 263 patients were enrolled
Fig. 1. Flow chart depicting the participation of subjects in this study.
Glycemic Load and Stroke Outcome
JCN
Table 1. Comparison of demographic and clinical data according to quartiles of dietary GL Variables Q1
(n=66)
Q2 (n=65)
Q3 (n=66)
Q4 (n=66)
Total
(n=263) p* p for trend†
GL 90.2
[77.0–98.0]
125.3 [113.8–135.8]
170.6 [163.2–182.1]
222.2 [201.9–268.8]
144.9 [106.0–188.5]
Demographic data
Sex, male 32 (48.5) 36 (55.4) 43 (65.2) 42 (63.6) 153 (58.2) 0.042 0.042
Age, years 65.8±13.3 65.9±12.2 66.1±10.9 63.8±10.4 65.4±11.7 0.654 0.116
Marital status, married 39 (59.1) 44 (67.7) 45 (68.2) 44 (66.7) 172 (65.4) 0.375 0.375
Education, >7 years 14 (21.2) 14 (21.5) 10 (15.2) 11 (16.7) 49 (18.6) 0.718 0.352
Prestroke mRS score 0 [0–1] 0 [0–1] 0 [0–1] 0 [0–1] 0 [0–1] 0.165 0.520
Risk factors
Hypertension 25 (37.9) 32 (49.2) 32 (48.5) 32 (48.5) 121 (46.0) 0.502 0.257
Diabetes mellitus 12 (18.2) 22 (33.8) 26 (39.4) 34 (51.5) 94 (35.7) 0.001 0.001
Hyperlipidemia 11 (16.7) 20 (30.8) 13 (19.7) 10 (15.2) 54 (20.5) 0.113 0.487
Alcohol intake 24 (36.4) 27 (41.5) 31 (47.0) 36 (54.5) 118 (44.9) 0.734 0.029
Smoking 23 (34.8) 22 (33.8) 29 (43.9) 29 (43.9) 103 (39.2) 0.466 0.166
Body mass index, kg/m2 24.2±3.5 27.3±2.4 23.7±2.8 24.0±3.5 24.8±2.2 0.307 0.442
Regular exercise 22 (33.3) 22 (33.8) 26 (39.4) 25 (37.9) 95 (36.1) 0.858 0.470
Laboratory findings
White blood cell count, ×103/µL 7.0±3.1 6.9±1.9 7.8±2.6 7.9±3.3 7.4±2.8 0.099 0.208
Hemoglobin, mg/dL 13.4±1.6 13.2±1.4 13.3±2.0 13.3±1.6 13.3±1.6 0.946 0.953
Fasting glucose, mg/dL 112.7±36.0 114.6±36.0 124.1±38.8 127.2±45.7 119.7±39.6 0.100 0.001
Triglycerides, mg/dL 104.9±48.9 131.8±72.0 123.0±37.0 138.6±92.6 124.5±67.0 0.024 0.012
Low-density lipoprotein, mg/dL 114.6±31.6 118.7±33.6 112.2±27.7 120.3±36.0 116.4±32.3 0.468 0.549
HbA1c, % 5.8±0.8 6.3±1.6 6.5±1.4 6.9±1.7 6.6±1.4 0.001 0.001
Insulin, µIU/mL 6.4±4.5 6.4±5.1 8.0±7.6 7.3±8.6 7.0±6.7 0.439 0.071
C-reactive protein, mg/dL 0.7±1.8 0.8±2.3 0.8±1.7 0.6±1.4 0.7±1.8 0.916 0.725
Stroke classification 0.770 N/A
Large-artery atherosclerosis 18 (27.3) 20 (30.8) 27 (40.9) 26 (39.4) 91 (34.6)
Lacune 26 (39.4) 25 (38.5) 19 (28.8) 19 (28.8) 89 (33.8)
Cardioembolism 14 (21.2) 11 (16.9) 11 (16.7) 9 (13.6) 45 (17.1)
Multiple causes 2 (3.0) 5 (7.7) 4 (6.1) 6 (9.1) 17 (6.5)
Negative evaluation 6 (9.1) 4 (6.2) 5 (7.6) 6 (9.1) 21 (8.0)
NIHSS score 3 [1–6] 2 [1–6] 3 [1–5] 3 [2–5] 3 [1–6] 0.404 0.695
Early neurological deterioration 5 (7.6) 6 (9.2) 6 (9.1) 3 (4.5) 20 (7.6) 0.722 0.529
High-grade WMHs 15 (22.7) 14 (21.5) 13 (19.7) 26 (39.4) 68 (25.9) 0.035 0.047
Symptomatic cerebral atherosclerosis 18 (27.3) 20 (30.8) 19 (28.8) 25 (37.9) 82 (31.2) 0.566 0.244 SQFFQ data
GI 59.6
[56.1–62.4]
58.5 [54.9–62.3]
59.4 [56.4–62.4]
60.6 [57.3–63.4]
59.6
[56.2–62.7] 0.038 0.004 Total carbohydrates, g/day 148.5
[125.0–169.4]
215.2 [197.2–232.1]
286.2 [268.8–306.3]
372.0 [328.4–450.5]
245.6
[180.7–321.1] 0.001 0.001 Total energy, kcal 1,231.6±444.1 1,665.4±424.3 2,081.7±559.3 2,863.5±803.8 1,961.7±833.9 0.001 0.001
Fat, g/day 38.1±24.6 47.3±22.3 56.9±30.0 76.7±35.3 54.8±31.8 0.001 0.001
Protein, g/day 54.2±24.7 69.6±25.9 85.0±32.8 109.6±36.7 79.6±36.6 0.001 0.001
Dietary fiber, g/day 16.2±7.2 22.9±10.5 29.4±10.2 35.7±13.9 26.0±12.9 0.001 0.001
Grains, g/day 260.7±229.6 355.6±605.9 307.4±162.2 456.7±261.2 345.1±362.7 0.013 0.004
Starch, g/day 42.5±59.1 72.6±159.7 45.3±54.6 63.1±81.8 55.8±98.3 0.001 0.165
Sugar, g/day 32.7±54.1 31.0±35.6 32.7±35.6 40.3±46.8 34.2±43.7 0.625 0.070
Data are median [interquartile range], n (%), or mean±standard deviation values.
Q1 and Q4, top and bottom quartiles of the GI, respectively.
*p<0.05, †p<0.1.
GI: glycemic index, GL: glycemic load, HbA1c: hemoglobin A1c, mRS: modified Rankin Scale, NIHSS: National Institutes of Health Stroke Scale, SQFFQ:
semiquantitative food-frequency questionnaire, WMHs: white-matter hyperintensities.
Song TJ et al.
JCN
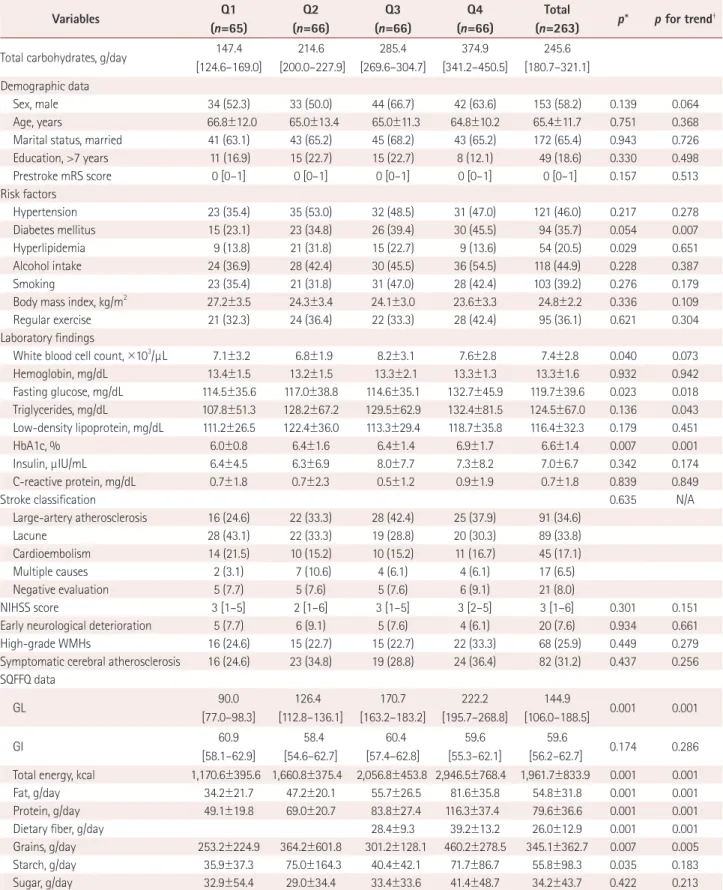
Table 2. Comparison of demographic and clinical data according to quartiles of total carbohydrate intake
Variables Q1
(n=65)
Q2 (n=66)
Q3 (n=66)
Q4 (n=66)
Total
(n=263) p* p for trend† Total carbohydrates, g/day 147.4
[124.6–169.0]
214.6 [200.0–227.9]
285.4 [269.6–304.7]
374.9 [341.2–450.5]
245.6 [180.7–321.1]
Demographic data
Sex, male 34 (52.3) 33 (50.0) 44 (66.7) 42 (63.6) 153 (58.2) 0.139 0.064
Age, years 66.8±12.0 65.0±13.4 65.0±11.3 64.8±10.2 65.4±11.7 0.751 0.368
Marital status, married 41 (63.1) 43 (65.2) 45 (68.2) 43 (65.2) 172 (65.4) 0.943 0.726
Education, >7 years 11 (16.9) 15 (22.7) 15 (22.7) 8 (12.1) 49 (18.6) 0.330 0.498
Prestroke mRS score 0 [0–1] 0 [0–1] 0 [0–1] 0 [0–1] 0 [0–1] 0.157 0.513
Risk factors
Hypertension 23 (35.4) 35 (53.0) 32 (48.5) 31 (47.0) 121 (46.0) 0.217 0.278
Diabetes mellitus 15 (23.1) 23 (34.8) 26 (39.4) 30 (45.5) 94 (35.7) 0.054 0.007
Hyperlipidemia 9 (13.8) 21 (31.8) 15 (22.7) 9 (13.6) 54 (20.5) 0.029 0.651
Alcohol intake 24 (36.9) 28 (42.4) 30 (45.5) 36 (54.5) 118 (44.9) 0.228 0.387
Smoking 23 (35.4) 21 (31.8) 31 (47.0) 28 (42.4) 103 (39.2) 0.276 0.179
Body mass index, kg/m2 27.2±3.5 24.3±3.4 24.1±3.0 23.6±3.3 24.8±2.2 0.336 0.109
Regular exercise 21 (32.3) 24 (36.4) 22 (33.3) 28 (42.4) 95 (36.1) 0.621 0.304
Laboratory findings
White blood cell count, ×103/µL 7.1±3.2 6.8±1.9 8.2±3.1 7.6±2.8 7.4±2.8 0.040 0.073
Hemoglobin, mg/dL 13.4±1.5 13.2±1.5 13.3±2.1 13.3±1.3 13.3±1.6 0.932 0.942
Fasting glucose, mg/dL 114.5±35.6 117.0±38.8 114.6±35.1 132.7±45.9 119.7±39.6 0.023 0.018
Triglycerides, mg/dL 107.8±51.3 128.2±67.2 129.5±62.9 132.4±81.5 124.5±67.0 0.136 0.043
Low-density lipoprotein, mg/dL 111.2±26.5 122.4±36.0 113.3±29.4 118.7±35.8 116.4±32.3 0.179 0.451
HbA1c, % 6.0±0.8 6.4±1.6 6.4±1.4 6.9±1.7 6.6±1.4 0.007 0.001
Insulin, µIU/mL 6.4±4.5 6.3±6.9 8.0±7.7 7.3±8.2 7.0±6.7 0.342 0.174
C-reactive protein, mg/dL 0.7±1.8 0.7±2.3 0.5±1.2 0.9±1.9 0.7±1.8 0.839 0.849
Stroke classification 0.635 N/A
Large-artery atherosclerosis 16 (24.6) 22 (33.3) 28 (42.4) 25 (37.9) 91 (34.6)
Lacune 28 (43.1) 22 (33.3) 19 (28.8) 20 (30.3) 89 (33.8)
Cardioembolism 14 (21.5) 10 (15.2) 10 (15.2) 11 (16.7) 45 (17.1)
Multiple causes 2 (3.1) 7 (10.6) 4 (6.1) 4 (6.1) 17 (6.5)
Negative evaluation 5 (7.7) 5 (7.6) 5 (7.6) 6 (9.1) 21 (8.0)
NIHSS score 3 [1–5] 2 [1–6] 3 [1–5] 3 [2–5] 3 [1–6] 0.301 0.151
Early neurological deterioration 5 (7.7) 6 (9.1) 5 (7.6) 4 (6.1) 20 (7.6) 0.934 0.661
High-grade WMHs 16 (24.6) 15 (22.7) 15 (22.7) 22 (33.3) 68 (25.9) 0.449 0.279
Symptomatic cerebral atherosclerosis 16 (24.6) 23 (34.8) 19 (28.8) 24 (36.4) 82 (31.2) 0.437 0.256 SQFFQ data
GL 90.0
[77.0–98.3]
126.4 [112.8–136.1]
170.7 [163.2–183.2]
222.2 [195.7–268.8]
144.9
[106.0–188.5] 0.001 0.001
GI 60.9
[58.1–62.9]
58.4 [54.6–62.7]
60.4 [57.4–62.8]
59.6 [55.3–62.1]
59.6
[56.2–62.7] 0.174 0.286 Total energy, kcal 1,170.6±395.6 1,660.8±375.4 2,056.8±453.8 2,946.5±768.4 1,961.7±833.9 0.001 0.001
Fat, g/day 34.2±21.7 47.2±20.1 55.7±26.5 81.6±35.8 54.8±31.8 0.001 0.001
Protein, g/day 49.1±19.8 69.0±20.7 83.8±27.4 116.3±37.4 79.6±36.6 0.001 0.001
Dietary fiber, g/day 28.4±9.3 39.2±13.2 26.0±12.9 0.001 0.001
Grains, g/day 253.2±224.9 364.2±601.8 301.2±128.1 460.2±278.5 345.1±362.7 0.007 0.005
Starch, g/day 35.9±37.3 75.0±164.3 40.4±42.1 71.7±86.7 55.8±98.3 0.035 0.183
Sugar, g/day 32.9±54.4 29.0±34.4 33.4±33.6 41.4±48.7 34.2±43.7 0.422 0.213
Data are median [interquartile range], n (%), or mean±standard-deviation values.
*p<0.05, †p<0.1.
GI: glycemic index, GL: glycemic load, HbA1c: hemoglobin A1c, mRS: modified Rankin Scale, NIHSS: National Institutes of Health Stroke Scale, SQFFQ:
semiquantitative food-frequency questionnaire, WMHs: white-matter hyperintensities.
Glycemic Load and Stroke Outcome
JCN
and a history of diabetes mellitus increased with the dietary GL. In addition, the fasting glucose, triglycerides, HbA1c, high-grade WMHs, dietary GI, total energy intake, total car- bohydrate intake, and intakes of fat, protein, dietary fiber, and grains increased with the quartiles of the dietary GL.
The results of comparative analyses according to quartiles of the total carbohydrate intake are summarized in Table 2.
The prevalence of a history of diabetes mellitus increased with the intake of total carbohydrate. In addition, fasting glu- cose, triglycerides, HbA1c, dietary GL, total energy intake, and intakes of fat, protein, dietary fiber, and grains increased with the quartiles of total carbohydrate intake.
The results of a comparative analysis between good and poor outcome groups are presented in Supplementary Ta- ble 1 (in the online-only Data Supplement). A multivariate
binary logistic analysis revealed that a high dietary GL was associated with an increased risk of a poor functional outcome [odds ratio (OR) for top quartile relative to bottom quar- tile=28.93, 95% confidence interval (CI)=2.82–296.04, p for linear trend=0.002]. The total carbohydrate intake was as- sociated with an increased risk of a poor functional outcome (OR for top quartile relative to bottom quartile=36.84, 95%
CI=2.99–453.42, p for linear trend=0.002). In contrast, a high dietary GI was not associated with a poor functional outcome (OR for top quartile relative to bottom quartile=3.60, 95%
CI=0.54–23.76, p for linear trend=0.481) (Table 3 and Sup- plementary Tables 2–5 in the online-only Data Supplement).
A multivariate ordinal logistic analysis found that a high di- etary GL was associated with an increased risk of a poor func- tional outcome (OR for top quartile relative to bottom quar- Table 3. Associations of dietary GL, GI, and total carbohydrate intake with a poor functional outcome
Variables GL GI Total carbohydrates
Binary logistic regression (mRS score=0–2 versus 3–6)
Continuous variables, OR (95% CI), p 1.01 (1.00–1.02), 0.003 1.00 (0.89–1.12), 0.982 1.01 (1.00–1.02), 0.005 Ordinal variables, quartile; OR (95% CI), p for trend 3.38 (1.66–6.90), 0.002 1.20 (0.71–2.03), 0.481 3.08 (1.50–6.32), 0.002
Q1, Reference 1 1 1
Q2, OR (95% CI), p 6.31 (0.59–67.39), 0.127 4.25 (0.69–25.94), 0.117 12.64 (1.12–142.14), 0.040 Q3, OR (95% CI), p 32.78 (2.81–381.86), 0.005 1.83 (0.26–12.63), 0.538 20.64 (1.68–253.56), 0.018 Q4, OR (95% CI), p 28.93 (2.82–296.04), 0.005 3.60 (0.54–23.76), 0.182 36.84 (2.99–453.42), 0.005 Ordinal logistic regression (mRS score=0, 1, 2, 3–6)
Continuous variables, OR (95% CI), p 1.00 (1.00–1.03), 0.005 1.03 (0.95–1.11), 0.519 1.00 (1.00–1.03), 0.006 Ordinal variables, quartile; OR (95% CI), p for trend 1.58 (1.10–2.27), 0.014 1.20 (0.86–1.69), 0.284 1.69 (1.16–2.45), 0.006
Q1, Reference 1 1 1
Q2, OR (95% CI), p 1.06 (0.51–6.63), 0.356 1.99 (0.67–5.91), 0.215 2.67 (0.73–9.72), 0.137 Q3, OR (95% CI), p 6.82 (1.99–23.57), 0.002 1.77 (0.57–5.46), 0.321 7.66 (2.08–28.22), 0.002 Q4, OR (95% CI), p 4.71 (1.32–16.78), 0.017 2.02 (0.66–6.20), 0.217 5.00 (1.35–18.62), 0.016 Adjusted for age, sex, variables with p<0.1 in univariate analysis (marital status, prestroke mRS score, hyperlipidemia, body mass index, stroke classifi- cation, National Institutes of Health Stroke Scale score, early neurological deterioration, and high-grade white-matter hyperintensities), and variables related to GL, GI, or total carbohydrate intake (diabetes mellitus, triglycerides, low-density lipoprotein, and hemoglobin A1c).
CI: confidence interval, GI: glycemic index, GL: glycemic load, mRS: modified Rankin Scale, OR: odds ratio.
Table 4. Associations of dietary GL, GI, and total carbohydrate intake with a poor functional outcome according to presence of diabetes mellitus
Variables Continuous variables Ordinal variables (quartiles)
OR (95% CI) p* OR (95% CI) p for trend*
Without diabetes mellitus
GL 1.02 (1.01–1.07) 0.010 2.57 (1.10–6.01) 0.029
GI 0.92 (0.78–1.08) 0.336 0.75 (0.39–1.45) 0.403
Total carbohydrates 1.01 (1.01–1.02) 0.041 2.25 (1.03–4.91) 0.041
With diabetes mellitus
GL 1.04 (1.01–1.09) 0.048 10.96 (1.06–112.52) 0.044
GI 1.27 (0.93–1.73) 0.121 4.71 (0.95–23.34) 0.058
Total carbohydrates 1.02 (1.01–1.04) 0.028 4.93 (1.02–23.82) 0.047
*Adjusted for age, sex, variables with p<0.1 in univariate analysis (marital status, prestroke modified Rankin Scale score, hyperlipidemia, body mass index, stroke classification, National Institutes of Health Stroke Scale score, early neurological deterioration, and high-grade white-matter hyperinten- sities), and variables related to GL, GI, or total carbohydrate intake (diabetes mellitus, triglycerides, low-density lipoprotein, and hemoglobin A1c).
CI: confidence interval, GI: glycemic index, GL: glycemic load, OR: odds ratio.
Song TJ et al.
JCN
tile=4.71, 95% CI=1.32–16.78, p for linear trend=0.014). The total carbohydrate intake was associated with an increased risk of a poor functional outcome (OR for top quartile rela- tive to bottom quartile=5.00, 95% CI=1.35–18.62, p for lin- ear trend=0.006), while a high dietary GI was not related to a poor functional outcome (Table 4). In subgroup analysis, high dietary GL and total carbohydrate intake were signifi- cantly associated with a poor functional outcome regardless of the presence of diabetes mellitus (Table 4).
DISCUSSION
This study found that increased dietary GL and total carbo- hydrate intake were independently associated with a poor functional outcome at 3 months after an acute ischemic stroke even after adjusting for stroke classification, NIHSS score at admission, and early neurological deterioration, which are factors that strongly influence stroke outcome. These asso- ciations were not affected by diabetes mellitus. The correla- tions of GL, GI, and the carbohydrate intake with stroke risk and prognosis have not been demonstrated. A previous Italian cohort study found that an increased GL and carbo- hydrate intake (but not GI) were associated with an increased stroke risk.26 In a Dutch population, high GL, GI, and carbo- hydrate intake were related to an increased risk of cardiovas- cular disease (including stroke) during a mean follow-up of 11.9 years.27 The Takayama study revealed that a high dietary GI increased the risk of mortality from stroke in Japanese women.8 A meta-analysis revealed that a high dietary GL was associated with an increased risk of coronary heart dis- ease and stroke, and there was a linear dose-response rela- tionship between the GL and the risk of coronary heart dis- ease.28 In contrast, the dietary GI was only weakly associated with the risk of coronary heart disease, and it was not associ- ated with the risk of stroke or stroke-related death.28 A Swed- ish study found that the GI and GL were not associated with long-term mortality in middle-aged men.7 These discrep- ancies between our study and previous studies may be due to differences in study populations (general populations in other studies versus acute ischemic stroke patients in the present study), race, sex distribution, or dietary contributions to the GL and GI.7 The present study has provided new in- sight into the association of the dietary GL and total carbo- hydrate intake with the functional outcome after acute isch- emic stroke.8,26,27
Several mechanisms could explain the relationships of high GL and total carbohydrate intake with a poor functional out- come found in our study. Chronic hyperglycemia induced by a high dietary GL may impact the stroke outcome.29 A pre- vious study found that chronic hyperglycemia was related to
a poor functional outcome in patients with acute ischemic stroke.30 This tendency was also found in a large multicenter stroke registry from Japan.31 Hyperglycemia was associated with more-severe cytotoxic injury, cerebral hypoperfusion, cerebral edema, and hemorrhagic transformation, which are strong prognostic factors after an acute ischemic stroke.32-34 Chronic hyperglycemia leads to increased lactate production and promotes mitochondrial dysfunction by creating an aci- dotic intracellular environment,35 which may aggravate the damage to ischemic tissue. Alternatively, a high dietary GL and GI can suddenly increase the blood sugar level, and such variability is associated with endothelial dysfunction in type 1 and type 2 diabetes mellitus.36 Endothelial dysfunction is a risk factor for cardiovascular disease,37 and impaired flow- mediated dilation (≤4.5%) is associated with a poor outcome in acute ischemic stroke patients with endothelial dysfunc- tion.38 Hyperglycemia and insulin resistance induced by a high dietary GL may impact hypercoagulability by increasing the serum levels of fibrinogen and von Willebrand factor.39,40 Our results are also supported by increased thrombotic activ- ity possibly predicting the 1-year functional outcome in pa- tients with ischemic stroke.39
We found that an increased dietary GI was not indepen- dently related to a poor functional outcome, although a rela- tionship was found in the univariate analysis. The dietary GL more accurately reflects the amount and quality of blood glu- cose and insulin increase when consuming carbohydrates than does the dietary GI.41 We speculate that our findings were due to the study design or differences in the predictability of the dietary GL and GI. Further investigations are needed to confirm these differences.
This study was subject to some limitations. First, although patients with acute ischemic stroke were enrolled prospec- tively, patients with cognitive dysfunction or severe neuro- logical deficit were excluded. This means that our study re- sults are not representative of overall ischemic stroke. Second, this study was limited to Korean stroke patients. Because the dietary habits of Korean patients differ from those in other countries, the study results are difficult to generalize beyond Korea. Third, the smallness of the sample and the question- naire survey design of our study may have caused selection and/or recall bias. Further large-scale and long-term cohort studies are therefore needed.
In conclusion, an increased dietary GL and total carbohy- drate intake were associated with a poor functional outcome after an acute ischemic stroke. Low-GL food and a low-car- bohydrate diet may improve the prognosis after an acute ischemic stroke.
Glycemic Load and Stroke Outcome
JCN
Supplementary Materials
The online-only Data Supplement is available with this arti- cle at https://doi.org/10.3988/jcn.2018.14.2.165.
Conflicts of Interest
The authors have no financial conflicts of interest.
Acknowledgements
This work was supported by a grant from the Basic Science Research Pro- gram through the National Research Foundation of Korea (NRF) funded by the Ministry of Education (grant no. 2015R1D1A1A01057934).
REFERENCES
1. Levitan EB, Song Y, Ford ES, Liu S. Is nondiabetic hyperglycemia a risk factor for cardiovascular disease? A meta-analysis of prospective studies. Arch Intern Med 2004;164:2147-2155.
2. Zhang Z, Yan J, Shi H. Hyperglycemia as a risk factor of ischemic stroke. J Drug Metab Toxicol 2013;4:153.
3. Levitan EB, Cook NR, Stampfer MJ, Ridker PM, Rexrode KM, Buring JE, et al. Dietary glycemic index, dietary glycemic load, blood lipids, and C-reactive protein. Metabolism 2008;57:437-443.
4. Aston LM. Glycaemic index and metabolic disease risk. Proc Nutr Soc 2006;65:125-134.
5. Jenkins DJ, Wolever TM, Taylor RH, Barker H, Fielden H, Baldwin JM, et al. Glycemic index of foods: a physiological basis for carbohy- drate exchange. Am J Clin Nutr 1981;34:362-366.
6. Oh K, Hu FB, Cho E, Rexrode KM, Stampfer MJ, Manson JE, et al.
Carbohydrate intake, glycemic index, glycemic load, and dietary fiber in relation to risk of stroke in women. Am J Epidemiol 2005;161:161- 7. Levitan EB, Mittleman MA, Håkansson N, Wolk A. Dietary glycemic 169.
index, dietary glycemic load, and cardiovascular disease in middle- aged and older Swedish men. Am J Clin Nutr 2007;85:1521-1526.
8. Oba S, Nagata C, Nakamura K, Fujii K, Kawachi T, Takatsuka N, et al.
Dietary glycemic index, glycemic load, and intake of carbohydrate and rice in relation to risk of mortality from stroke and its subtypes in Japanese men and women. Metabolism 2010;59:1574-1582.
9. Kaushik S, Wang JJ, Wong TY, Flood V, Barclay A, Brand-Miller J, et al. Glycemic index, retinal vascular caliber, and stroke mortality. Stroke 2009;40:206-212.
10. Magalhães R, Abreu P, Correia M, Whiteley W, Silva MC, Sander- cock P. Functional status three months after the first ischemic stroke is associated with long-term outcome: data from a community-based cohort. Cerebrovasc Dis 2014;38:46-54.
11. Aeberli I, Gerber PA, Hochuli M, Kohler S, Haile SR, Gouni-Berthold I, et al. Low to moderate sugar-sweetened beverage consumption im- pairs glucose and lipid metabolism and promotes inflammation in healthy young men: a randomized controlled trial. Am J Clin Nutr 2011;94:479-485.
12. Luitse MJ, van Seeters T, Horsch AD, Kool HA, Velthuis BK, Kap- pelle LJ, et al. Admission hyperglycaemia and cerebral perfusion def- icits in acute ischaemic stroke. Cerebrovasc Dis 2013;35:163-167.
13. Mucci L, Santilli F, Cuccurullo C, Davì G. Cardiovascular risk and di- etary sugar intake: is the link so sweet? Intern Emerg Med 2012;7:313- 322.
14. Adams HP Jr, Bendixen BH, Kappelle LJ, Biller J, Love BB, Gordon DL, et al. Classification of subtype of acute ischemic stroke. Definitions for use in a multicenter clinical trial. TOAST. Trial of Org 10172 in Acute Stroke Treatment. Stroke 1993;24:35-41.
15. Song TJ, Kim J, Song D, Nam HS, Kim YD, Lee HS, et al. Association of cerebral microbleeds with mortality in stroke patients having atrial fibrillation. Neurology 2014;83:1308-1315.
16. Oh MS, Yu KH, Lee JH, Jung S, Ko IS, Shin JH, et al. Validity and reli- ability of a Korean version of the National Institutes of Health Stroke Scale. J Clin Neurol 2012;8:177-183.
17. Kim YD, Song D, Kim EH, Lee KJ, Lee HS, Nam CM, et al. Long- term mortality according to the characteristics of early neurological deterioration in ischemic stroke patients. Yonsei Med J 2014;55:669- 675.
18. Song TJ, Kim YD, Yoo J, Kim J, Chang HJ, Hong GR, et al. Associa- tion between aortic atheroma and cerebral small vessel disease in pa- tients with ischemic stroke. J Stroke 2016;18:312-320.
19. North American Symptomatic Carotid Endarterectomy Trial Collab- orators, Barnett HJM, Taylor DW, Haynes RB, Sackett DL, Peerless SJ, et al. Beneficial effect of carotid endarterectomy in symptomatic pa- tients with high-grade carotid stenosis. N Engl J Med 1991;325:445- 20. Warfarin-Aspirin Symptomatic Intracranial Disease (WASID) Trial 453.
Investigators. Design, progress and challenges of a double-blind trial of warfarin versus aspirin for symptomatic intracranial arterial ste- nosis. Neuroepidemiology 2003;22:106-117.
21. Choe H, Hwang JY, Yun JA, Kim JM, Song TJ, Chang N, et al. Intake of antioxidants and B vitamins is inversely associated with ischemic stroke and cerebral atherosclerosis. Nutr Res Pract 2016;10:516-523.
22. Foster-Powell K, Holt SH, Brand-Miller JC. International table of gly- cemic index and glycemic load values: 2002. Am J Clin Nutr 2002;76:
5-56.
23. Song TJ, Cho HJ, Chang Y, Choi K, Jung AR, Youn M, et al. Low plasma proportion of omega 3-polyunsaturated fatty acids predicts poor outcome in acute non-cardiogenic ischemic stroke patients. J Stroke 2015;17:168-176.
24. Song TJ, Kim J, Lee HS, Nam CM, Nam HS, Kim EH, et al. Differen- tial impact of unrecognised brain infarction on stroke outcome in non- valvular atrial fibrillation. Thromb Haemost 2014;112:1312-1318.
25. Tombaugh TN, McIntyre NJ. The mini-mental state examination: a comprehensive review. J Am Geriatr Soc 1992;40:922-935.
26. Sieri S, Brighenti F, Agnoli C, Grioni S, Masala G, Bendinelli B, et al.
Dietary glycemic load and glycemic index and risk of cerebrovascular disease in the EPICOR cohort. PLoS One 2013;8:e62625.
27. Burger KN, Beulens JW, Boer JM, Spijkerman AM, van der A DL.
Dietary glycemic load and glycemic index and risk of coronary heart disease and stroke in Dutch men and women: the EPIC-MORGEN study. PLoS One 2011;6:e25955.
28. Fan J, Song Y, Wang Y, Hui R, Zhang W. Dietary glycemic index, gly- cemic load, and risk of coronary heart disease, stroke, and stroke mor- tality: a systematic review with meta-analysis. PLoS One 2012;7:e52182.
29. Brand-Miller JC, Holt SH, Pawlak DB, McMillan J. Glycemic index and obesity. Am J Clin Nutr 2002;76:281S-285S.
30. Luitse MJ, Velthuis BK, Kappelle LJ, van der Graaf Y, Biessels GJ;
DUST Study Group. Chronic hyperglycemia is related to poor func- tional outcome after acute ischemic stroke. Int J Stroke 2017;12:180- 186.
31. Kamouchi M, Matsuki T, Hata J, Kuwashiro T, Ago T, Sambongi Y, et al. Prestroke glycemic control is associated with the functional out- come in acute ischemic stroke: the Fukuoka Stroke Registry. Stroke 2011;42:2788-2794.
32. Bevers MB, Vaishnav NH, Pham L, Battey TW, Kimberly WT. Hyper- glycemia is associated with more severe cytotoxic injury after stroke. J Cereb Blood Flow Metab 2017;37:2577-2583.
33. González-Moreno EI, Cámara-Lemarroy CR, González-González JG, Góngora-Rivera F. Glycemic variability and acute ischemic stroke: the missing link? Transl Stroke Res 2014;5:638-646.
34. Quast MJ, Wei J, Huang NC, Brunder DG, Sell SL, Gonzalez JM, et al.
Perfusion deficit parallels exacerbation of cerebral ischemia/reperfu- sion injury in hyperglycemic rats. J Cereb Blood Flow Metab 1997;
17:553-559.
35. Anderson RE, Tan WK, Martin HS, Meyer FB. Effects of glucose and
Song TJ et al.
JCN
PaO2 modulation on cortical intracellular acidosis, NADH redox state, and infarction in the ischemic penumbra. Stroke 1999;30:160- 36. Ceriello A, Esposito K, Piconi L, Ihnat MA, Thorpe JE, Testa R, et al. 170.
Oscillating glucose is more deleterious to endothelial function and oxidative stress than mean glucose in normal and type 2 diabetic pa- tients. Diabetes 2008;57:1349-1354.
37. Suwaidi JA, Hamasaki S, Higano ST, Nishimura RA, Holmes DR Jr, Lerman A. Long-term follow-up of patients with mild coronary ar- tery disease and endothelial dysfunction. Circulation 2000;101:948- 38. Santos-García D, Blanco M, Serena J, Arias S, Millán M, Rodríguez-954.
Yáñez M, et al. Brachial arterial flow mediated dilation in acute isch-
emic stroke. Eur J Neurol 2009;16:684-690.
39. Raynaud E, Pérez-Martin A, Brun J, Aïssa-Benhaddad A, Fédou C, Mercier J. Relationships between fibrinogen and insulin resistance.
Atherosclerosis 2000;150:365-370.
40. Meigs JB, Mittleman MA, Nathan DM, Tofler GH, Singer DE, Mur- phy-Sheehy PM, et al. Hyperinsulinemia, hyperglycemia, and im- paired hemostasis: the Framingham Offspring Study. JAMA 2000;283:
221-228.
41. Bao J, Atkinson F, Petocz P, Willett WC, Brand-Miller JC. Prediction of postprandial glycemia and insulinemia in lean, young, healthy adults:
glycemic load compared with carbohydrate content alone. Am J Clin Nutr 2011;93:984-996.
![Table 1. Comparison of demographic and clinical data according to quartiles of dietary GL Variables Q1 (n=66) Q2 (n=65) Q3 (n=66) Q4 (n=66) Total (n=263) p* p for trend † GL 90.2 [77.0–98.0] 125.3 [113.8–135.8] 170.6 [163.2–182.1] 222.](https://thumb-ap.123doks.com/thumbv2/123dokinfo/5263690.139927/4.892.85.809.130.1009/table-comparison-demographic-clinical-according-quartiles-dietary-variables.webp)