Copyright © 2016 The Korean Society for Bone and Mineral Research
This is an Open Access article distributed under the terms of the Creative Commons Attribution Non-Commercial Li- cense (http://creativecommons.org/licenses/by-nc/4.0/) which permits unrestricted non-commercial use, distribu- tion, and reproduction in any medium, provided the original work is properly cited.
Association of Serum Osteocalcin with Insulin Resistance and Coronary Atherosclerosis
Jee-Hyun Kang
Department of Family Medicine, Konyang University Hospital, Daejeon, Korea
Background: To determine the associations between serum osteocalcin level and in- sulin resistance, coronary atherosclerosis by using dual-source coronary computed to- mography angiography. Methods: A total of 98 subjects (24 men and 74 women) were selected for this retrospective cross-sectional study who voluntarily visited a health examination center for routine health check-up including the blood test for se- rum osteocalcin level and coronary computed tomography angiography. Multiple re- gression analysis was used to determine which variables were independently related to osteocalcin levels and coronary atherosclerosis. Results: Stepwise multiple regres- sion analysis adjusted for age, sex, menopausal status, body mass index, serum alka- line phosphatase, serum calcium and phosphate showed that osteocalcin negatively correlated with serum glucose (β=-0.145, P=0.001) and homeostasis model assess- ment of insulin resistance (HOMA-IR) index (β=-1.794, P=0.027) independently. The age, serum glucose, smoking status but not osteocalcin level were independent risk factors for coronary atherosclerosis by use of multiple logistic regression analysis after controlling for other variables. Conclusions: Serum osteocalcin level was inversely as- sociated with fasting glucose level and insulin resistance measured by HOMA-IR, sug- gesting that osteocalcin is important for glucose metabolism. However, in this study, no significant difference was observed in the serum osteocalcin level according to the presence of coronary atherosclerotic plaques.
Key Words: Coronary angiography, Coronary artery disease, Insulin resistance, Osteocalcin
INTRODUCTION
Osteocalcin, a bone-derived protein secreted by osteoblasts, is a bone forma- tion marker, also known as a marker for bone turnover. It has been used clinically to assess the effectiveness of osteoporosis treatments.
Recently, it has been discovered that osteocalcin also acts as a hormone to con- trol glucose and energy metabolism on pancreatic β-cells and adipose and mus- cle tissues.[1]
In one animal experiment, genetically modified mice were not able to secrete osteocalcin while exhibiting decreased β-cell proliferation, glucose intolerance and insulin resistance.[2] When recombinant osteocalcin was injected into the wild- type mice, an increase in pancreatic β-cell proliferation, insulin secretion and a re- duction in body fat were observed.[3] In addition, in a cross-sectional and a pro- Corresponding author
Jee-Hyun Kang
Department of Family Medicine, Konyang University Hospital, 158 Gwanjeodong-ro, Seo-gu, Daejon 35365, Korea
Tel: +82-42-600-9240 Fax: +82-42-600-9095
E-mail: [email protected] Received: July 28, 2016 Revised: October 2, 2016 Accepted: October 6, 2016
No potential conflict of interest relevant to this article was reported.
Original Article
pISSN 2287-6375 eISSN 2287-7029
spective study involving human subjects, serum osteocal- cin concentration was observed to be inversely correlated to fasting blood glucose, insulin resistance, and body fat mass.[4,5]
Moreover, osteocalcin has been receiving much atten- tion for being an indicator of cardiovascular diseases. Re- cent studies have reported that serum osteocalcin concen- tration may be associated with calcification of the coronary arteries and the aorta, thickness of the intima-media of the carotid artery, and formation of atherosclerotic plaques in the carotid artery.[6-9] Although these studies have shown that osteocalcin concentration in the blood may be inde- pendently correlated with increased risk of cardiovascular diseases, the results lack consistency; there have been oth- er reports suggesting no relation of osteocalcin to the inci- dence of cardiovascular diseases.[10]
With the recent and rapid development of multidetector computed tomography (MDCT), coronary computed tomo- graphy (CT) angiography through MDCT has been widely used to detect the presence of atherosclerotic plaques in the coronary arteries and to assess the degree of stenosis.
This study investigates the relationship between serum osteocalcin level and insulin resistance measured by using the homeostasis model assessment of insulin resistance (HOMA-IR) index, as well as the relationship between the presence of atherosclerotic plaques in the coronary arter- ies by using coronary CT angiography and osteocalcin con- centration.
METHODS 1. Study subjects
We retrospectively collected study subjects aged over 20 years who had simultaneously undergone coronary CT an- giography and blood test including serum osteocalcin, glu- cose, insulin, calcium, phosphorus, lipids and alkaline phos- phatase (ALP) for routine health check-up from January 2012 to December 2015. A total of 98 people (24 men and 74 women) who visited a health promotion center volun- tarily included as subjects. Their medical records were in- vestigated in a retrospective manner.
Subjects were excluded if their medical records and ques- tionnaires indicated that they were taking medications or health supplements that could affect their bone and min- eral metabolism, such as hormones, osteoporosis medica-
tions, or calcium and vitamin D supplements. They were also excluded if they were taking heparin or warfarin, which could affect vitamin K metabolism. Subjects who had any of the following were also excluded: thyroid diseases, para- thyroid diseases, abnormal calcium and bone metabolism, autoimmune diseases, renal, cardiovascular, cerebrovascu- lar diseases, and malignant tumors.
2. Questionnaire and body measurement
Based on the questionnaire results and medical records, we investigated if the subjects were taking any medications for diabetes, high blood pressure, and hyperlipidemia. We also looked at histories of smoking or menopause. Subjects were deemed as post-menopausal if they had not men- struated for the past 12 months.The subjects had a cuff of an appropriate size wrapped around their upper arms, and a mercury sphygmomanom- eter was used to measure their systolic and diastolic blood pressure, while sitting on a chair in a relaxed state.
Subjects took off their clothes and shoes, and changed into examination gowns. Their heights were measured to the nearest 0.1 cm and their weights to the nearest 0.1 kg, by using a Fatness Measuring system (Fanics, Busan, Korea).
Body mass index (BMI) was measured by dividing the body mass (kg) by the square of the body height (m²).
3. Blood test
Blood sample was collected after the subjects fasted for 12 hr. The concentrations of calcium, phosphorus, glu- cose, and lipids and ALP concentration were measured by using an automatic chemical analyzer (AU-5400; Olym- pus Optical Co, Tokyo, Japan). Insulin concentration was measured through radioimmunoassay (RIA) by using a human insulin specific RIA kit (Linco Research Inc., St. Charles, MO, USA).
Osteocalcin concentration was measured under electro- chemiluminscence immunoassay (ECLIA) by using a N-MID osteocalcin kit (Roche Diagnostics, Mannheim, Germany).
By using fasting plasma glucose and insulin as indicators of insulin resistance, the HOMA-IR ([Fasting insulin (μIU/
mL)× fasting plasma glucose (mmol/L)] / 22.5) was calcu- lated.[11]
4. Coronary CT angiography
Using a 128 channel dual-source coronary CT angiogra-
phy (Somatom Definition®; Siemens Healthcare, Forchheim, Germany), coronary angiography was performed. A stan- dard protocol for coronary angiography (128×0.6 mm slice collimation, 0.28 sec rotation time, 120 kVp tube voltage, 320 mA tube current) was followed.
A dual injector (Medrad, Pittsburgh, PA, USA) was used to inject a nonionic contrast agent (Iomeron 400, 400 mg/
Ml; Braccon, Milan, Italy), and images were obtained. Seg- ment thickness and intervals were set at 0.75 mm and 0.5 mm, respectively for image reformatting. An experienced radiology specialist checked for the presence of athero- sclerotic plaques in the coronary arteries with the naked eye after the images were reformatted in three-dimension- al Workstation. Subjects were diagnosed with atheroscle- rotic plaques in the coronary arteries if plaques were de- tected in CT-angiograms.
5. Statistics
The mean, standard deviation or proportions (%) were calculated according to the characteristics of the variables.
The interquartile range (25%-75%) was indicated for vari- ables that were not normally distributed. Variables that were determined to be non-normally distributed after a Kolmo- gorov-Smirnov test were log-transformed before analysis.
The Independent t-test, χ2 test, or the Mann–Whitney U-test were used depending on the characteristics of the variables to analyze for the differences between men and women.
To study the correlation between serum osteocalcin levels and other variables, the Pearson correlation coefficient was used. To look for an independent relationship between se- rum osteocalcin concentration and other variables, a step- wise multiple regression analysis was performed; serum osteocalcin levels was the dependent variable, and other parameters were the independent variables.
To compare the variables between subjects with and those without arteriosclerotic plaques in the coronary ar- teries, independent t-test, χ2 test, and Mann–Whitney U- test were performed. Logistic regression analysis was used, with the presence of atherosclerotic plaques set as the de- pendent variable. For the statistical analyses, the MedCalc version 16.4.3 Program (MedClac Software, Mariakerke, Belgium) was used, and the level of significance was set at below 0.05.
RESULTS
1. General characteristics of the study subjects
Subjects included 98 adult men and women (24 men and 74 women). The mean age was 53.5±8.8 years. There was no significant difference in the age between the men and women (P=0.091). Among the women, 21 were pre- menopausal, with their mean age being 43.7±3.2 years.Fifty-three female subjects were post-menopausal, with their mean age being 58.6±6.7 years.
The mean osteocalcin level of the total subjects was 20.2
±11.8 ng/mL. There was no significant difference in osteo- calcin concentration between men and women (men 17.6
±5.3 ng/mL vs. women 21.1±13.2 ng/mL; P=0.213). The mean serum osteocalcin concentrations for premenopausal and postmenopausal women were 15.4±3.4 ng/mL and 23.3±14.9 ng/mL, respectively. The mean serum osteocal- cin levels of postmenopausal women was significantly high- er than that of the premenopausal women (P=0.019).
There were no significant differences between men and women in the serum concentrations of calcium, phospho- rus, and ALP, HOMA-IR, systolic and diastolic pressure, low- density cholesterol concentration, and BMI. However, sig- nificant differences were observed for high-density choles- terol and triglyceride levels (Table 1). Other general char- acteristics of the subjects are shown in Table 1.
2. The relationship between serum osteocalcin and other variables
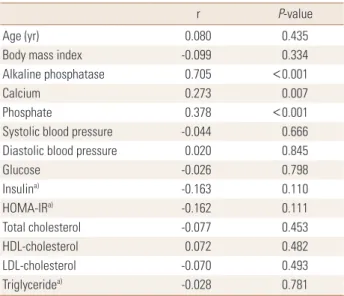
Osteocalcin concentration showed a significant correlation with concentrations of serum calcium (r=0.273, P=0.007), phosphorus (r=378, P<0.001), and ALP (r=0.705, P<0.001), but was not associated with any other variables (Table 2).
In order to determine which independent variables were independently related to osteocalcin level, stepwise multi- ple regression analysis was performed using osteocalcin concentration as the dependent variable and other vari- ables as the independent variables. Serum osteocalcin con- centration was independently correlated to fasting blood glucose (β=-0.145, P=0.001), ALP, and serum phosphorus and calcium concentrations, even after being adjusted for sex, age, and menopausal status. When HOMA-IR was used as independent variable instead of fasting blood glucose, to avoid multicollinearity, osteocalcin concentration showed an independent correlation with HOMA-IR (β=-1.794, P=
Table 1. General characteristics
Variables Total (n=98) Men (n=24) Women (n=74) P-value
Age (yr) 53.5±8.8 50.9±7.5 54.4±9.0 0.091
Height (cm) 160.3±8.5 171.7±4.6 156.6±5.7 <0.001
Weight (kg) 63.4±12.2 75.5±10.8 59.4±9.8 <0.001
Body mass index (kg/m2) 24.6±3.6 25.6±3.5 24.2±3.5 0.093
Osteocalcin (ng/mL) 20.2±11.8 17.6±5.3 21.1±13.2 0.213
Alkaline phosphatase (IU/L) 63.7±23.9 62.6±16.6 64.1±25.9 0.785
Calcium (mg/dL) 9.1±0.4 9.2±0.3 9.1±0.4 0.222
Phosphate (mg/dL) 3.7±0.5 3.5±0.5 3.7±0.5 0.073
Systolic blood pressure (mmHg) 114.4±15.0 115.4±11.9 114.1±16.0 0.707
Diastolic blood pressure (mmHg) 76.1±9.1 76.7±7.5 75.9±9.6 0.705
Glucose (mg/dL) 99.8±20.6 99.7±13.7 99.8±22.4 0.988
Insulin (uIU/mL)a) 4.0 (2.4-6.7) 4.3 (2.6-6.4) 3.9 (2.3-7.1) 0.676
HOMA-IRa) 1.0 (0.6-1.7) 1.1 (0.6-1.5) 0.9 (0.6-1.7) 0.681
Total cholesterol (mg/dL) 210.7±42.7 210.3±50.4 210.9±40.3 0.952
HDL-cholesterol (mg/dL) 57.0±14.5 48.7±6.0 59.7±15.4 0.001
LDL-cholesterol (mg/dL) 141.5±34.5 147.2±39.6 139.6±32.7 0.350
Triglyceride (mg/dL)a) 109.6 (86.5-152.9) 150.4 (118.6-195.8) 105.8 (82.8-134.7) <0.001
Diabetes medication, n (%) 6 (6.1) 1 (4.2) 5 (6.8) 0.429
Hypertension medication, n (%) 18 (18.4) 5 (20.8) 13 (17.6) 0.721
Dyslipidemia medication, n (%) 8 (8.2) 1 (4.2) 7 (9.5) 0.413
Current smoking, n (%) 9 (9.2) 8 (33.3) 1 (1.4) <0.001
Ex-smoker, n (%) 8 (8.2) 8 (33.3) 0 (0.0) <0.001
Menopause, n (%) 53 (71.6)
Coronary atherosclerosis, n (%) 31 (31.6) 10 (41.7) 21 (28.4) 0.230
The data is presented as mean±standard deviation or number (%).
a)Median, interquartile range, logarithmically transformed before analysis.
HOMA-IR, homeostasis model assessment of insulin resistance; HDL, high-density lipoprotein; LDL, low-density lipoprotein.
Table 2. Pearson correlation of serum osteocalcin levels with other variables
r P-value
Age (yr) 0.080 0.435
Body mass index -0.099 0.334
Alkaline phosphatase 0.705 <0.001
Calcium 0.273 0.007
Phosphate 0.378 <0.001
Systolic blood pressure -0.044 0.666
Diastolic blood pressure 0.020 0.845
Glucose -0.026 0.798
Insulina) -0.163 0.110
HOMA-IRa) -0.162 0.111
Total cholesterol -0.077 0.453
HDL-cholesterol 0.072 0.482
LDL-cholesterol -0.070 0.493
Triglyceridea) -0.028 0.781
a)Logarithmically transformed before analysis.
HOMA-IR, homeostasis model assessment of insulin resistance; HDL, high-density lipoprotein; LDL, low-density lipoprotein.
Table 3. Stepwise multiple regression for serum osteocalcin levels Independent variables Coefficient (β) P-value Model 1
Glucose
Alkaline phosphatase Calcium
Phosphate
-0.145 0.356 4.438 4.658
0.001
<0.001 0.036 0.008 Model 2
HOMA-IRa)
Alkaline phosphatase Phosphate
-1.794 0.330 5.829
0.027
<0.001 0.001 Dependent variable: osteocalcin level.
Independent variables: Model 1 (age, sex, menopausal status body mass index [BMI], glucose, systolic blood pressure [SBP], diastolic blood pres- sure [DBP], total cholesterol, low-density lipoprotein [LDL]-cholesterol, high-density lipoprotein [HDL]-cholesterol, triglyceride [logarithmically transformed before analysis], smoking status, medication history of dia- betes, hypertension, dyslipidemia), Model 2 (age, sex, menopausal status BMI, glucose or HOMA-IR [logarithmically transformed before analysis], SBP, DBP, total cholesterol, LDL-cholesterol, HDL-cholesterol, triglycer- ide [logarithmically transformed before analysis], smoking status, medi- cation history of diabetes, hypertension, dyslipidemia).
a)Logarithmically transformed before analysis.
HOMA-IR, homeostasis model assessment of insulin resistance.
0.027), ALP, and blood phosphorus concentration (Table 3).
3. Comparison of variables between subjects with and those without arteriosclerotic plaques in the coronary arteries measured by coronary CT angiography
Atherosclerotic plaques in the coronary CT angiogram were detected in 31 subjects (10 men, 41.7% vs. 21 wom- en, 28.4%), accounting for 31.6% of the total population.
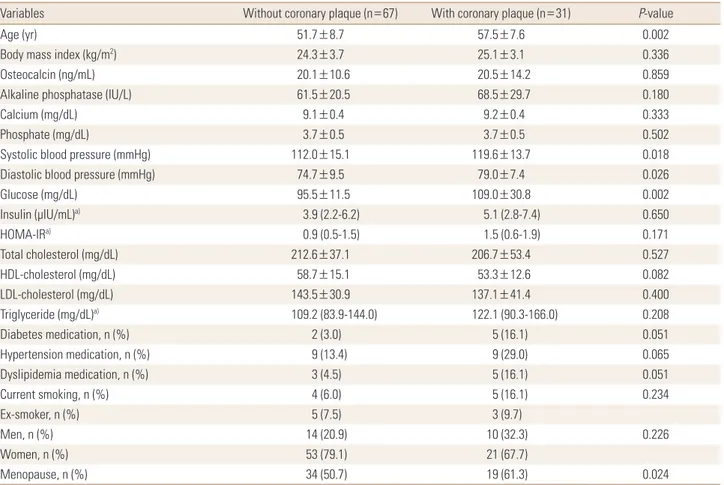
There were no differences in the prevalence of atheroscle- rotic plaques in men and women (P=0.230) (Table 1). How- ever, the mean age (P=0.002) and proportion of postmeno- pausal women (P=0.024) were significantly higher in the group with atherosclerotic plaques (Table 4).
Serum osteocalcin levels did not differ significantly be- tween the subjects with or without atherosclerotic plaques (20.1±10.6 ng/mL vs. 20.5±14.2 ng/mL; P=0.859). Glu- cose (P=0.002), systolic pressure (P=0.018), and diastolic
pressure (P=0.026) significantly increased in the group with atherosclerotic plaques compared to the group with- out (Table 4). Stepwise logistic analysis showed that age, fasting blood glucose concentration, and smoking status were independently correlated with the presence of ath- Table 4. Comparison the variables according to presence of coronary plaque
Variables Without coronary plaque (n=67) With coronary plaque (n=31) P-value
Age (yr) 51.7±8.7 57.5±7.6 0.002
Body mass index (kg/m2) 24.3±3.7 25.1±3.1 0.336
Osteocalcin (ng/mL) 20.1±10.6 20.5±14.2 0.859
Alkaline phosphatase (IU/L) 61.5±20.5 68.5±29.7 0.180
Calcium (mg/dL) 9.1±0.4 9.2±0.4 0.333
Phosphate (mg/dL) 3.7±0.5 3.7±0.5 0.502
Systolic blood pressure (mmHg) 112.0±15.1 119.6±13.7 0.018
Diastolic blood pressure (mmHg) 74.7±9.5 79.0±7.4 0.026
Glucose (mg/dL) 95.5±11.5 109.0±30.8 0.002
Insulin (μIU/mL)a) 3.9 (2.2-6.2) 5.1 (2.8-7.4) 0.650
HOMA-IRa) 0.9 (0.5-1.5) 1.5 (0.6-1.9) 0.171
Total cholesterol (mg/dL) 212.6±37.1 206.7±53.4 0.527
HDL-cholesterol (mg/dL) 58.7±15.1 53.3±12.6 0.082
LDL-cholesterol (mg/dL) 143.5±30.9 137.1±41.4 0.400
Triglyceride (mg/dL)a) 109.2 (83.9-144.0) 122.1 (90.3-166.0) 0.208
Diabetes medication, n (%) 2 (3.0) 5 (16.1) 0.051
Hypertension medication, n (%) 9 (13.4) 9 (29.0) 0.065
Dyslipidemia medication, n (%) 3 (4.5) 5 (16.1) 0.051
Current smoking, n (%) 4 (6.0) 5 (16.1) 0.234
Ex-smoker, n (%) 5 (7.5) 3 (9.7)
Men, n (%) 14 (20.9) 10 (32.3) 0.226
Women, n (%) 53 (79.1) 21 (67.7)
Menopause, n (%) 34 (50.7) 19 (61.3) 0.024
The data is presented as mean±standard deviation or number (%).
a)Median, interquartile range, logarithmically transformed before analysis.
HOMA-IR, homeostasis model assessment of insulin resistance; HDL, high-density lipoprotein; LDL, low-density lipoprotein.
Table 5. Logistic regression analysis for the variables between sub- jects with and those without arteriosclerotic plaques in the coronary arteries
Independent variables Coefficient (β) P-value
Age 0.092 0.003
Glucose 0.049 0.011
Current smoking 1.782 0.020
Dependent variable: presence of coronary plaque.
Independent variables: osteocalcin, age, sex, menopausal status body mass index, glucose or homeostasis model assessment of insulin resis- tance (logarithmically transformed before analysis), systolic blood pres- sure, diastolic blood pressure, total cholesterol, low-density lipoprotein cholesterol, high-density lipoprotein cholesterol, triglyceride (logarithmi- cally transformed before analysis), smoking status, medication history of diabetes, hypertension, dyslipidemia.
erosclerotic plaques, but osteocalcin was not significant dependent variable in this model after controlling for oth- er variables (Table 5).
DISCUSSION
Osteocalcin concentrations reflect the rate of bone for- mation and the treatment for osteoporosis such as bisphos- phonate change the osteocalcin levels.[12] ALP is also a useful index for monitoring changes in bone turnover.[13]
Plasma ALP concentration mostly originates from the bones and the liver and especially bone-specific ALP reflects os- teoblast activity.[14]
In this study, serum osteocalcin levels showed a signifi- cant correlation with ALP, calcium, and phosphorus con- centration. This is a predictable result, considering osteo- calcin is a bone turnover marker.
Although there was no significant difference in serum osteocalcin levels between men and women, significantly higher osteocalcin levels were observed in postmenopaus- al women than premenopausal women. A previous study showed decreased osteocalcin concentration with increased age, but osteocalcin levels showed an increasing trend in postmenopausal women and men over the age of 70.[15]
On multiple regression analysis, serum osteocalcin level showed negative correlation with fasting blood glucose and HOMA-IR after adjusting for age, sex, and menopausal status and this correlation was independent with ALP, cal- cium, and phosphorus concentration. This result shows that osteocalcin might be related to glucose metabolism and insulin resistance independently from its role as a bone turnover marker that reflects the rate of bone formation.
Many clinical studies have reported that a reduction in serum osteocalcin is related to increased incidences of high blood glucose, insulin resistance, obesity, metabolic syn- drome and has important role in energy metabolism.[4,5, 16-19] In this study, we found fasting blood glucose and insulin resistance were related to osteocalcin concentra- tion. In contrast, BMI, history of diabetes, hyperlipidemia, high blood pressure, and plasma lipid concentration were not related to osteocalcin concentration. It is possible that there were not enough study subjects to reveal a correla- tion. Although both cardiovascular diseases and osteopo- rosis are diseases whose prevalence increases with age, bone mineral density was shown in previous studies to be
inversely correlated to the advanced atherosclerosis and mortality, even after adjusting for age.[20,21]
Lately, osteocalcin has been gaining attention as a con- necting factor between cardiovascular diseases and bone metabolism, and numerous cross-sectional studies and longitudinal studies have shown that a decrease in serum osteocalcin level is associated with increased rates of car- diovascular diseases. A prospective 10-year cohort study involving 774 men reported that the group with high se- rum osteocalcin concentration had the lowest rate of calci- fication in the abdominal aorta, and also the lowest death rate.[22] In a cross-sectional study with 461 Chinese sub- jects, the group diagnosed with atherosclerotic plaques detected though angiography had increased osteocalcin concentration compared to the group without atheroscle- rotic plaques even after adjusting for cardiovascular risk factors.[23]
A recent cross-sectional study with Korean subjects also reported that undercarboxylated osteocalcin concentra- tions, as well as the ratio between under-carboxylated os- teocalcin and total osteocalcin concentration, were inde- pendently associated with known risk factors of cardiovas- cular diseases and bone density, and were negatively cor- related with coronary calcification in men.[6]
No definite mechanism shows a clear correlation between osteocalcin levels and cardiovascular diseases. However, cardiovascular calcification is one of the pathological chan- ges of cardiovascular diseases, and an imbalance in osteo- calcin concentration and cardiovascular mineralization may induce such changes.[24] Some endothelial progenitor cells involved in ischemic tissue regeneration can secrete osteocalcin, and although a recent study has reported that osteocalcin-secreting endothelial progenitor cells are re- lated to unstable coronary heart disease, the role of these cells in the occurrence of arteriosclerosis is still unclear.[25]
In this study, the serum osteocalcin levels were not sig- nificantly different between subjects with and those with- out arteriosclerotic plaques in the coronary arteries.
The conflicting results of this study compared to the above mentioned studies may be caused from the difference of method to diagnose coronary atherosclerosis. In this study, we used coronary MDCT angiography to reveal relationship between the presence of coronary atherosclerotic plaques and osteocalcin concentration. MDCT can detect both cal- cified and non-calcified plaque compared to coronary cal-
cification score as surrogate marker of atherosclerosis used in above mentioned similar study.[6]
However, the limitations of this study could be the rea- son of the discordance. The limitations of this study are: 1) small sample size. 2) The limitations of retrospective analy- ses of medical records. 3) Possible existence of selection bias, as the subjects only included people who visited the health examination centers. 4) In this study, only the total osteocalcin concentration was measured, and the ratio of carboxylation of osteocalcin and the concentration of vita- min K were not taken into account; this may have contrib- uted to the lack of significant differences in osteocalcin level according to the presence of coronary atherosclerotic plaques. In the blood, osteocalcin is found in two forms:
carboxylated osteocalcin, which is mainly involved in bone mineralization, and undercarboxylated osteocalcin, which is mainly involved in energy metabolism and controlled by vitamin K concentration.[2,3,26] Osteocalcin reflects bone turnover and bone density; bone density and atheroscle- rosis share various mutual risk factors such as age, smok- ing, menopause, diet, exercise, and physical activity. It is possible that the data were not adjusted enough for these confounding variables; thus, we might not be able to ob- serve any difference in osteocalcin concentration between the groups.
However, a few cohort studies have reported an absent correlation between osteocalcin and the incidence of car- diovascular diseases.[10] Similarly, a cross-sectional study has reported that osteocalcin concentration in postmeno- pausal women was positively correlated with the preva- lence of coronary atherosclerosis, contrary to the results of previous studies.[27] There has also been a report that in both healthy men and premenopausal and postmenopaus- al women, osteocalcin has no independent correlation with the carotid intima-media thickness.[28] Therefore, osteo- calcin concentration may have a miniscule or limited im- pact on the development of atherosclerosis.
A prospective study that was carried out for five years and involved 3,522 elderly men reported that serum os- teocalcin levels may be used to predict the mortality rate of cardiovascular diseases at both low and high concentra- tions, resulting in a U-shaped relationship.[29] Another co- hort study with 1,319 subjects reported that the higher the concentration of osteocalcin, the lower the risk for car- diovascular diseases in men, and the higher the risk in wom-
en.[30] Therefore, the relationship between osteocalcin and cardiovascular disease risks may vary depending on gender, race, and the characteristics of a subject group.
In conclusion, serum osteocalcin level was inversely as- sociated with fasting glucose level and insulin resistance measured by HOMA-IR, suggesting that osteocalcin is im- portant for glucose metabolism. However, in this study, no significant difference was observed in the serum osteocal- cin level according to the presence of coronary atheroscle- rotic plaques.
It would be necessary to assess the clinical significance of osteocalcin through large-scale prospective studies in- volving diverse groups of subjects.
REFERENCES
1. Kanazawa I. Osteocalcin as a hormone regulating glucose metabolism. World J Diabetes 2015;6:1345-54.
2. Lee NK, Sowa H, Hinoi E, et al. Endocrine regulation of en- ergy metabolism by the skeleton. Cell 2007;130:456-69.
3. Ferron M, Hinoi E, Karsenty G, et al. Osteocalcin differen- tially regulates beta cell and adipocyte gene expression and affects the development of metabolic diseases in wild- type mice. Proc Natl Acad Sci U S A 2008;105:5266-70.
4. Kindblom JM, Ohlsson C, Ljunggren O, et al. Plasma osteo- calcin is inversely related to fat mass and plasma glucose in elderly Swedish men. J Bone Miner Res 2009;24:785-91.
5. Fernández-Real JM, Izquierdo M, Ortega F, et al. The rela- tionship of serum osteocalcin concentration to insulin se- cretion, sensitivity, and disposal with hypocaloric diet and resistance training. J Clin Endocrinol Metab 2009;94:237- 45.
6. Choi BH, Joo NS, Kim MJ, et al. Coronary artery calcification is associated with high serum concentration of undercar- boxylated osteocalcin in asymptomatic Korean men. Clin Endocrinol (Oxf) 2015;83:320-6.
7. Kim KJ, Kim KM, Park KH, et al. Aortic calcification and bone metabolism: the relationship between aortic calcification, BMD, vertebral fracture, 25-hydroxyvitamin D, and osteo- calcin. Calcif Tissue Int 2012;91:370-8.
8. Sheng L, Cao W, Cha B, et al. Serum osteocalcin level and its association with carotid atherosclerosis in patients with type 2 diabetes. Cardiovasc Diabetol 2013;12:22.
9. Yang R, Ma X, Dou J, et al. Relationship between serum osteocalcin levels and carotid intima-media thickness in
Chinese postmenopausal women. Menopause 2013;20:
1194-9.
10. Hwang YC, Kang M, Cho IJ, et al. Association between the circulating total osteocalcin level and the development of cardiovascular disease in middle-aged men: a mean 8.7- year longitudinal follow-up study. J Atheroscler Thromb 2015;22:136-43.
11. Matthews DR, Hosker JP, Rudenski AS, et al. Homeostasis model assessment: insulin resistance and beta-cell func- tion from fasting plasma glucose and insulin concentra- tions in man. Diabetologia 1985;28:412-9.
12. Hong SH, Koo JW, Hwang JK, et al. Changes in serum os- teocalcin are not associated with changes in glucose or insulin for osteoporotic patients treated with bisphospho- nate. J Bone Metab 2013;20:37-41.
13. Atalay S, Elci A, Kayadibi H, et al. Diagnostic utility of os- teocalcin, undercarboxylated osteocalcin, and alkaline phos- phatase for osteoporosis in premenopausal and postmeno- pausal women. Ann Lab Med 2012;32:23-30.
14. Leung KS, Fung KP, Sher AH, et al. Plasma bone-specific al- kaline phosphatase as an indicator of osteoblastic activity.
J Bone Joint Surg Br 1993;75:288-92.
15. Gundberg CM, Looker AC, Nieman SD, et al. Patterns of osteocalcin and bone specific alkaline phosphatase by age, gender, and race or ethnicity. Bone 2002;31:703-8.
16. Lee SW, Jo HH, Kim MR, et al. Association between obesity, metabolic risks and serum osteocalcin level in postmeno- pausal women. Gynecol Endocrinol 2012;28:472-7.
17. Kim SH, Lee JW, Im JA, et al. Serum osteocalcin is related to abdominal obesity in Korean obese and overweight men. Clin Chim Acta 2010;411:2054-7.
18. Oosterwerff MM, van Schoor NM, Lips P, et al. Osteocalcin as a predictor of the metabolic syndrome in older persons:
a population-based study. Clin Endocrinol (Oxf) 2013;78:
242-7.
19. Zanatta LC, Boguszewski CL, Borba VZ, et al. Osteocalcin, energy and glucose metabolism. Arq Bras Endocrinol Me- tabol 2014;58:444-51.
20. Tankò LB, Bagger YZ, Christiansen C. Low bone mineral density in the hip as a marker of advanced atherosclerosis in elderly women. Calcif Tissue Int 2003;73:15-20.
21. Trivedi DP, Khaw KT. Bone mineral density at the hip pre- dicts mortality in elderly men. Osteoporos Int 2001;12:259- 65.
22. Confavreux CB, Szulc P, Casey R, et al. Higher serum osteo- calcin is associated with lower abdominal aortic calcifica- tion progression and longer 10-year survival in elderly men of the MINOS cohort. J Clin Endocrinol Metab 2013;98:1084- 92.
23. Zhang Y, Qi L, Gu W, et al. Relation of serum osteocalcin level to risk of coronary heart disease in Chinese adults.
Am J Cardiol 2010;106:1461-5.
24. Evrard S, Delanaye P, Kamel S, et al. Vascular calcification:
from pathophysiology to biomarkers. Clin Chim Acta 2015;
438:401-14.
25. Flammer AJ, Gössl M, Widmer RJ, et al. Osteocalcin posi- tive CD133+/CD34-/KDR+ progenitor cells as an indepen- dent marker for unstable atherosclerosis. Eur Heart J 2012;
33:2963-9.
26. Patti A, Gennari L, Merlotti D, et al. Endocrine actions of osteocalcin. Int J Endocrinol 2013;2013:846480.
27. Montalcini T, Emanuele V, Ceravolo R, et al. Relation of low bone mineral density and carotid atherosclerosis in post- menopausal women. Am J Cardiol 2004;94:266-9.
28. Luo Y, Ma X, Hao Y, et al. Relationship between serum os- teocalcin level and carotid intima-media thickness in a met- abolically healthy Chinese population. Cardiovasc Diabe- tol 2015;14:82.
29. Yeap BB, Chubb SA, Flicker L, et al. Associations of total osteocalcin with all-cause and cardiovascular mortality in older men. The Health In Men Study. Osteoporos Int 2012;
23:599-606.
30. Holvik K, van Schoor NM, Eekhoff EM, et al. Plasma osteo- calcin levels as a predictor of cardiovascular disease in old- er men and women: a population-based cohort study. Eur J Endocrinol 2014;171:161-70.