Index terms
Gastrointestinal Stromal Tumor Computed Tomography Imatinib Mesylate Attenuation
INTRODUCTION
Gastrointestinal stromal tumors (GISTs) are the most com- mon and comprise the majority of mesenchymal tumors of the gastrointestinal tract; unlike other tumors, they are considered potentially malignant (1). Surgery is the principal initial treat- ment for patients with an operable GIST, but curative therapy is difficult in more than half of patients with a malignant GIST due to the dispersed nature of the tumor, and high postoperative recurrence and metastasis rates are observed (40–90% of all sur- gically treated cases) (2-4). Malignant GISTs often fail to re-
spond to treatment with conventional cytotoxic agents such as doxorubicin-based therapy and radiotherapy, and when there is a response, it is often not sustained (5, 6).
Imatinib mesylate (imatinib; formerly STI571), is a molecu- larly targeted drug that selectively inhibits constitutive activity of the KIT receptor tyrosine kinase in GIST cells. Imatinib reduces tumor size and arrests disease progression in > 80% of patients with advanced GIST (7-9). Adjuvant imatinib treatment also improves recurrence-free survival in patients with localized pri- mary GIST (10).
Previous studies have indicated a dramatic change in tumor
J Korean Soc Radiol 2014;71(5):239-248 http://dx.doi.org/10.3348/jksr.2014.71.5.239
Received May 24, 2014; Accepted September 2, 2014 Corresponding author: Beom Jin Park, MD
Department of Radiology, Anam Hospital, College of Medicine, Korea University, 73 Inchon-ro, Seongbuk-gu, Seoul 136-705, Korea.
Tel. 82-2-920-5657 Fax. 82-2-929-3796 E-mail: [email protected]
This is an Open Access article distributed under the terms of the Creative Commons Attribution Non-Commercial License (http://creativecommons.org/licenses/by-nc/3.0) which permits unrestricted non-commercial use, distri- bution, and reproduction in any medium, provided the original work is properly cited.
Purpose: To evaluate the correlation between pathological and computed tomogra- phy (CT) findings of gastrointestinal stromal tumors (GISTs) after imatinib mesylate (imatinib) treatment.
Materials and Methods: Twenty-six patients with GIST (17 men, 9 women; mean age, 56 years) who underwent treatment with imatinib and who were registered at our institution were included. Eight patients had primary and 18 had metastatic tu- mors. The correlation between CT and pathological findings was evaluated for all 26 tumors, which were resected after imatinib treatment.
Results: The mean size change in the tumors after imatinib treatment was -1.4 cm (range, -7.8—2.5 cm). A reduction in tumor CT attenuation value was observed after imatinib treatment (mean, 29.1 Hounsfield units) in 20 of 26 tumors. Reduced at- tenuation was associated with non-tumorous pathological findings, including cystic degeneration (6/20), hemorrhagic necrosis (6/20), hyaline degeneration (6/20), and combined pathology without a viable portion (2/20). Of six tumors showing in- creased attenuation values after treatment, four (66.7%) showed an abundant via- ble portion. The increase in tumor size was not associated with the presence of a vi- able portion in any tumor.
Conclusion: CT attenuation changes in GISTs may adequately reflect the pathologi- cal findings in GISTs after imatinib treatment.
Correlation between Computed Tomography and Pathological Findings of Gastrointestinal Stromal Tumors Treated with Imatinib Mesylate
1Imatinib Mesylate 치료 후 위장관 간질종양의 CT 및 병리소견의 비교1
Ki Choon Sim, MD
1, Beom Jin Park, MD
1, Na Yeon Han, MD
1, Deuk Jae Sung, MD
1, Min Ju Kim, MD
1, Sung Bum Cho, MD
1, Hyun Kwon Ha, MD
2, Hyoung Rae Kim, MD
31Department of Radiology, Anam Hospital, College of Medicine, Korea University, Seoul, Korea
2Department of Radiology, Asan Medical Center, College of Medicine, University of Ulsan, Seoul, Korea
3Department of Imaging Medicine, College of Medicine, Kangwon National University, Chuncheon, Korea
are assessed based on the CT attenuation coefficient (measured in Hounsfield units, HU) or only the enhancing area is incorpo- rated into the changes in the response evaluation (17). These new criteria are reliable response evaluation methods for molec- ularly targeted agents, and radiologists need to evaluate changes in internal tumor attenuation for evidence of residual disease to determine if further treatment is required. Despite previous stud- ies in which tumor attenuation changes of GISTs treated by ima- tinib were discussed, the correlation between CT and pathological findings are not fully understood, and only been a few incidental reports are available about the pathological changes underlying the CT attenuation of treated GISTs.
The purpose of this study was to investigate the correlation between changes in CT attenuation and GIST pathology after imatinib treatment and to present the pathological rationale for new proposed CT response criteria.
MATERIALS AND METHODS
Patients
The Institutional Review Board of both institutions approved this retrospective study, and the requirement for informed con- sent was waived. A total of 26 patients, consisting of 17 men and 9 women with a mean age of 56 years (range, 36–71 years), with pathologically proven GIST were enrolled in an approved var- ied-dose trial of STI-571 (4-[(4-methyl-1-piperazynil)methyl]- N-[4-mepthyl-3-[[4-(3-pyridinyl)-2-pyrimidinyl]-amino]-phe- nyl] benzamide methane-sufonate; Gleevec® [imatinib mesylate];
Norvatis, Basel, Switzerland) at two institutions between August 2009 and May 2012. A single tumor was resected from each of these 26 patients after imatinib treatment. All tumors were re- sectable. Eight patients had a primary GIST (five had tumors in the small bowel and three had tumors in the stomach), and 18 patients had a single metastatic GIST (eight had tumors in the peritoneum, six had tumors in the liver, and one each had tu- mors in the small bowel, spleen, pelvic soft tissue, and mediasti- num) (Table 1). The mean interval between initial imatinib treatment and the final follow-up CT before surgery was about 15 months. All patients underwent surgical resection within 2 months after the final follow-up CT. The electronic medical re- cords of each patient were reviewed to establish the imatinib prescription.
attenuation on contrast-enhanced computed tomography (CT) scans after imatinib treatment of a GIST, although the anatomi- cal change (e.g., tumor size) was initially minor (11). Therefore, anatomic tumor response metrics can be misleading when ap- plied to this molecular-targeted therapy. The Response Evalua- tion Criteria in Solid Tumor (RECIST) criteria, based on the sum of the longest diameters of the target lesions in the trans- verse plane, is the most widely used measurement system in clinical trials (12). However, a number of studies have shown that RECIST is inadequate for evaluating tumors treated with molecularly targeted drugs or locoregional therapies (13-15).
Thus, several CT response criteria, such as the “Choi response criteria” (13-15) and the “modified RECIST (mRECIST) crite- ria” (16) have been proposed. Tumor changes in these criteria
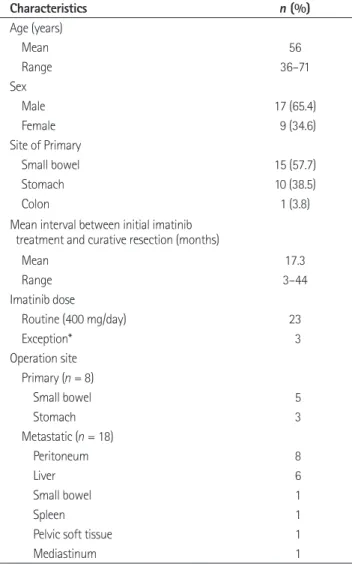
Table 1. Summary of Tumor Characteristics
Characteristics n (%)
Age (years)
Mean 56
Range 36–71
Sex
Male 17 (65.4)
Female 9 (34.6)
Site of Primary
Small bowel 15 (57.7)
Stomach 10 (38.5)
Colon 1 (3.8)
Mean interval between initial imatinib treatment and curative resection (months)
Mean 17.3
Range 3–44
Imatinib dose
Routine (400 mg/day) 23
Exception* 3
Operation site Primary (n = 8)
Small bowel 5
Stomach 3
Metastatic (n = 18)
Peritoneum 8
Liver 6
Small bowel 1
Spleen 1
Pelvic soft tissue 1
Mediastinum 1
Note.-Data in parentheses are percentages.
*Exceptional dose: lowered or interrupted prescription of imatinib
val change in CT attenuation occurred after imatinib treatment to objectively analyze tumor attenuation. The attenuation value of the masses before and after imatinib treatment was measured using the rectangular region of interest, encompassing as much as possible of the areas showing a significant change on the CT (Fig. 1).
The Kolmogorov-Smirnov test was used to determine wheth- er the values were normally distributed. Statistical differences in the unidimensional maximal diameter of the tumor and CT at- tenuation values before and after imatinib treatment were ana- lyzed with the paired t-test. Statistical differences in the change of the CT attenuation value according to the dominant patho- logical findings before and after imatinib treatment were ana- lyzed with the Kruskal-Wallis and Mann-Whitney tests. All sta- tistical analyses were performed using SPSS ver. 20.0 software (SPSS Inc., Chicago, IL, USA). A p-value < 0.05 was considered significant.
RESULTS
Clinical Features
All patients were administered a 400 mg oral dose of imatinib daily beginning in July 2009. The dose was reduced to 300 mg for 1 month in two patients due to a drug eruption; and admin- istration of the drug was discontinued for 3 months in another patient due to cost. All other patients were treated continuously until surgery. Each patient underwent a baseline CT scan before starting imatinib treatment and a follow-up CT scan just prior to surgical resection. The mean interval between the initial pre- scription of imatinib and curative resection was 17.3 months (range, 3–44 months).
CT Findings
All surgically resected tumors were identified on CT scans.
The mean size of the tumors was 6.97 ± 4.54 cm (range, 0.8–22 cm) prior to imatinib treatment and 5.58 ± 4.20 cm (range, 0.8–
20 cm) on the final follow-up CT scan after imatinib treatment (Table 2). The mean size change in the tumors after imatinib treatment was a -1.4 cm (range, -7.8–2.5 cm) (p = 0.003). Nine- teen of the 26 tumors were smaller after treatment, five increased in size, and the other two remained the same size. According to the RECIST guidelines, a PR was observed in 11 (42.3%) of the Pathological Review
The pathologic records of each patient were reviewed to estab- lish CD117 immunoreactivity (also known as proto-oncogene c- Kit or tyrosine-protein kinase Kit), which is a specific marker for GISTs among gastrointestinal tract tumors (8). The histopatholo- gy of surgical specimens was retrospectively assessed by a single gastrointestinal pathologist (13 years experience) for the pres- ence of a viable hypercellular area and for the main secondary non-tumor findings within masses. Subsequently, the relevant CT scan was reviewed by radiologists to determine the relation- ship between CT and pathological findings.
Imaging
All CT scans were performed with three commercially avail- able single-detector spiral CT scanners (Somatom Plus-S, Sie- mens, Erlangen, Germany; Somatom Plus 4, Siemens; Hispeed, GE Medical Systems, Milwaukee, WI, USA) or a multidetector- row CT scanner (LightSpeed QX/I; GE Medical Systems). Each patient was administered 100–120 mL iopromide (Ultravist 300® or Ultravist 370®; Schering, Berlin, Germany) or iopamidol (Io- pamiro 300®; Braccco, Milano, Italy) through an 18- or 20-gauge angiographic catheter inserted in a antecubital vein with a me- chanical injector (LF CT 9000; Liebel-Flarsheim, Cincinnati, OH, USA) at a rate of 2.5–3.0 mL/sec. CT scans were obtained during the portal venous phase (with a 72 second delay) after ad- ministration of contrast material. A helical CT image were ob- tained with a 7–8 mm collimation, a table pitch of 1.4, and 7–8 mm reconstruction intervals, whereas the multidetector row CT images were obtained with a 5-mm thick section, a pitch of 3:1 (high-quality mode), and 5-mm reconstruction intervals.
Image Analysis and Statistics
CT scans were retrospectively reviewed by two experienced gastrointestinal radiologists (13 years experience; 29 years expe- rience) who provided a consensus report. The change in maxi- mal diameter (unidimensional) of the masses before and after imatinib treatment based on RECIST 1.1 was recorded. A partial response (PR) for the unidimensional measurement approach was defined as > 30% reduction in tumor diameter, progressive disease (PD) as a > 20% increase in tumor diameter, and stable disease (SD) as a neither PR nor PD (18). A single radiologist (4 years experience) identified the area in which a significant inter-
18–102.4 HU) after imatinib treatment. CT attenuation values de- creased in 20 (76.9%) of the 26 tumors after treatment, whereas the values increased in the remaining six tumors (23.1%) (Tables 2, 3). The mean attenuation decrease after imatinib treatment was 29.1 HU (range, 7.6–57.1 HU) in 20 of the 26 tumors (p = 0.001).
Histopathological Findings
Surgical specimens were available from all 26 tumors. Each GIST contained a variable amount of viable tumor together with non-tumorous tissue. CD117 expression was assessed immuno- histochemically in all tumors. The main non-tumorous histo- pathological findings included hemorrhagic necrosis in seven tumors (26.9%), cystic degeneration in seven (26.9%), hyaliniza- tion in six (23.1%), and combined type findings in the remain- 26 tumors, whereas a SD and PD were observed in 13 (50%)
and two (7.7%) tumors, respectively.
The mean CT attenuation value was 68.4 ± 21.9 HU (range, 17–
103.7 HU) before imatinib treatment and 50.4 ± 26 HU (range,
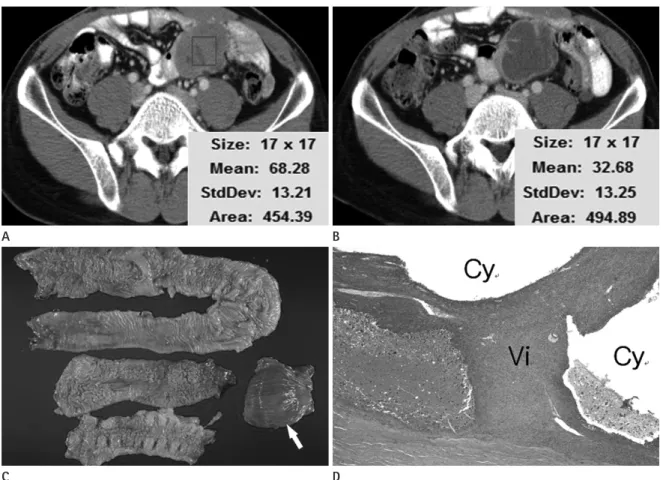
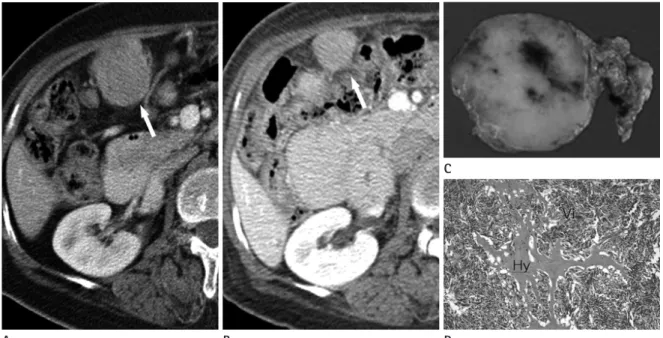
Fig. 1. Transverse CT scans of a gastrointestinal stromal tumor before and after imatinib treatment in a 36-year-old man. CT at- tenuation was measured by adjusting the rectangular region of interest to encompass as much as possible of the portion show- ing a significant change in CT findings before and after imatinib treatment.
A. Solid mass with lobulated contour abutting the small bowel before imatinib treatment.
B. Six months after imatinib treatment, the attenuation of the solid tumor had decreased, and a peripheral wall and internal septation were apparent.
C. Gross specimen showing the resected small bowel and large bowel loops with the chamber of cystic degeneration (solid arrow).
D. Microscopic examination revealed extensive multiloculated cystic degeneration (Cy) with an internal septum containing viable tumor cells (Vi) (H&E stain, × 20).
A
C
B
D
Table 2. Tumor Size and Attenuation before and after Imatinib Treat- ment
Parameter Mean ± SD Range p-Value
Size (cm) 0.003
Before 6.97 ± 4.54 0.8–22
After 5.58 ± 4.20 0.8–20
CT attenuation value (HU) 0.001
Before 68.4 ± 21.9 17–103.7
After 50.4 ± 26.0 18–102.4
Note.-after = after treatment, before = before treatment, HU = Houn- sfield unit, SD = standard deviation
changes in the viable portion underlying a predominant cystic mass before treatment. As an ancillary finding, a myxoid change was observed in one tumor with dominant hemorrhagic necrosis, and abundant calcification was noted in one other tumor with dominant hyalinization after imatinib treatment (Fig. 4).
Most tumors (21 of 26, 80.7%) were smaller (n = 19) or did not change (n = 2) in size after treatment. Of these, 15 (74%) showed decreased CT attenuation, but the other six (26%) had increased CT attenuation despite having decreased in size, and four of these showed abundant viable tumor cells on a histologi- cal examination (Fig. 5). These four tumors with high residual tumor cellularity had decreased in size after treatment, resulting in SD for one patient and PR in three other patients based on RECIST 1.1. In contrast, none of the five tumors that increased in size showed hypercellularity, although two of these patients showed PD based on RECIST 1.1 (Table 3).
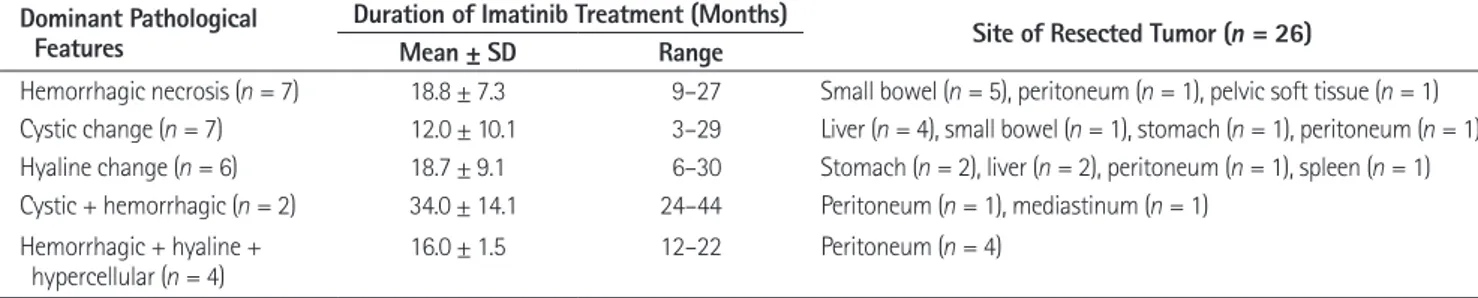
We also assessed the correlation between secondary histopath- ological findings according to the duration of imatinib treatment and the resected tumor site (Table 4). Hemorrhagic necrosis was most commonly observed in tumors originating from the small intestine. Among the small bowel tumors (n = 6), five showed hemorrhagic necrosis and one showed cystic changes after treat- ment. A cystic change (n = 7) was most commonly observed in hepatic tumors (n = 4). The combined type of lesion with hyper- cellularity was only observed in peritoneal tumors.
DISCUSSION
Many reports are available regarding changes in CT features of GISTs following imatinib treatment (14, 19-21). However, ing six tumors (23.1%), which contained a combination of hem-
orrhagic necrosis and hyaline and cystic degeneration. Two of these tumors with combined findings contained cystic degener- ation and hemorrhagic necrosis without a viable tumor portion.
The other four contained viable hypercellular areas with hyalin- ization and hemorrhagic necrosis but no cystic degeneration (Table 3). Finally, the histopathological features of the post- treatment GISTs were subdivided into five types.
Correlation between CT and Histopathological Findings
The CT attenuation values before and after imatinib treat- ment significantly varied in all five types of pathological features (p = 0.003). The changes in the CT attenuation values in tumors with a hyalinized change (n = 6) was more significant compared with that in the other pathological types (p < 0.05). No signifi- cant difference in CT attenuation change was observed among the four other pathological features.
Twenty of the 26 tumors (77%), in which the CT attenuation value was lower on the final follow-up CT compared to the base- line CT, showed different types of dominant non-tumorous histo- pathological findings (Table 3). Six of these tumors (30%) exhibit- ed cystic degeneration (Fig. 1), six (30%) showed hemorrhagic necrosis, six (30%) showed hyalinization (Figs. 2, 3), and two (10%) were of a combined type with a mixture of cystic degenera- tion and hemorrhagic necrosis. The remaining six tumors (23%) showed increased CT attenuation after treatment, four of which showed abundant viable tumor cells on histological examination, one of which showed hemorrhagic necrosis with hypercellular vi- able portion, and the last one of which showed cystic and hyaline
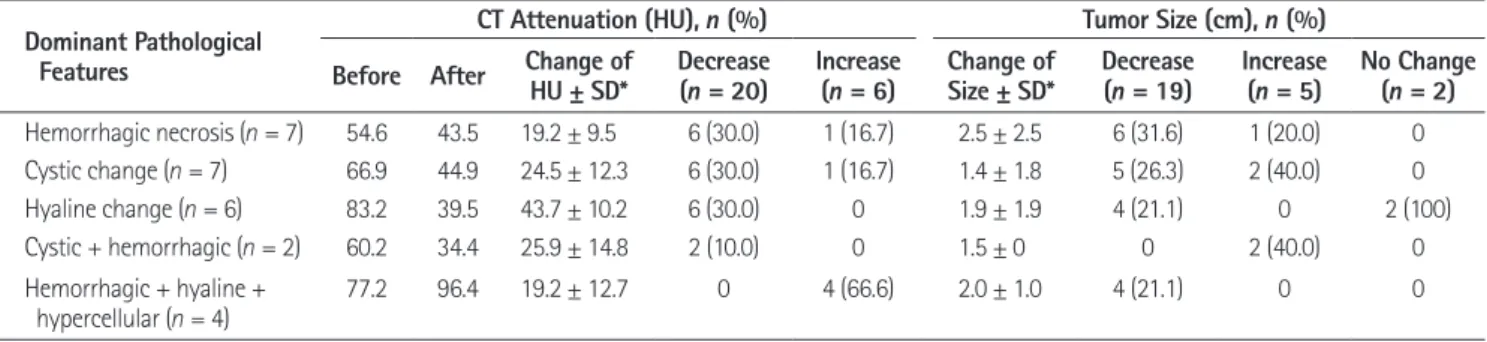
Table 3. The Correlation between Radiological and Pathological Findings According to the Changes in Attenuation and Size of GISTs after Imatinib Treatment
Dominant Pathological Features
CT Attenuation (HU), n (%) Tumor Size (cm), n (%)
Before After Change of
HU ± SD* Decrease
(n = 20) Increase
(n = 6) Change of
Size ± SD* Decrease
(n = 19) Increase
(n = 5) No Change (n = 2) Hemorrhagic necrosis (n = 7) 54.6 43.5 19.2 ± 9.5 6 (30.0) 1 (16.7) 2.5 ± 2.5 6 (31.6) 1 (20.0) 0 Cystic change (n = 7) 66.9 44.9 24.5 ± 12.3 6 (30.0) 1 (16.7) 1.4 ± 1.8 5 (26.3) 2 (40.0) 0
Hyaline change (n = 6) 83.2 39.5 43.7 ± 10.2 6 (30.0) 0 1.9 ± 1.9 4 (21.1) 0 2 (100)
Cystic + hemorrhagic (n = 2) 60.2 34.4 25.9 ± 14.8 2 (10.0) 0 1.5 ± 0 0 2 (40.0) 0
Hemorrhagic + hyaline +
hypercellular (n = 4) 77.2 96.4 19.2 ± 12.7 0 4 (66.6) 2.0 ± 1.0 4 (21.1) 0 0
Note.-Data in parentheses are percentages.
*Differences before and after treatment represent changes in attenuation and size.
after = after treatment, before = before treatment, GIST = gastrointestinal stromal tumor, HU = Hounsfield unit, SD = standard deviation
histopathological examination of GISTs after imatinib treatment;
the non-tumorous portion included hemorrhagic necrosis, cys- tic degeneration, hyalinization, and combined pathology with or most only provided a limited description of the histopathologi-
cal changes associated with CT findings. In this study, the 26 treated tumors showed a high degree of variability based on the
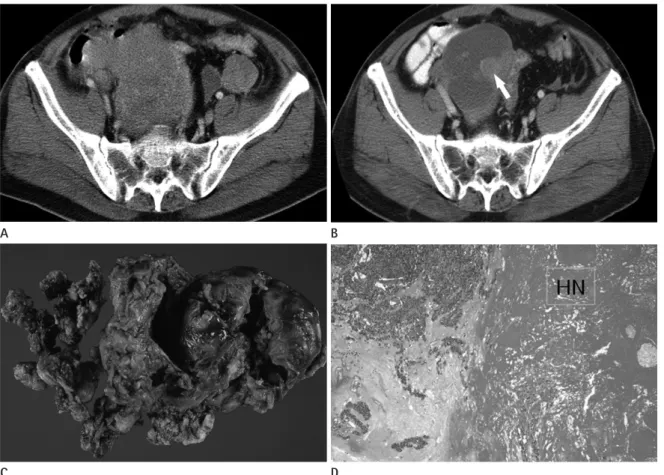
Fig. 2. Transverse CT scans of a primary gastrointestinal stromal tumor (GIST) of the small bowel in a 53-year-old man.
A. A CT scan before imatinib treatment shows a heterogeneous low attenuated mass abutting pelvic ileal loops.
B. CT scans obtained 18 months after imatinib treatment showed a lesion with reduced attenuation, suggestive of a cyst-like component with an intramural nodule (solid arrow).
C. Photograph of a resected and opened GIST from the ileum showing a central cavity in the gross specimen.
D. Microscopic examination revealed extensive hemorrhagic necrosis (HN) (H&E stain, × 40).
Fig. 3. Transverse CT scans of a splenic metastasis from a gastrointestinal stromal tumor of the stomach in a 62-year-old woman.
A. A CT scan before imatinib treatment reveals a heterogeneous, hypo-attenuated metastatic lesion in the spleen.
B. A CT scan obtained 28 months after imatinib treatment. The metastatic spleen lesion is nearly resolved, and the cystic lesion including ascites and fluid collection has developed next to the spleen (open arrow).
C. Photomicrograph of the resected spleen. Hyaline changes owing to ascites or fluid collection outside the splenic capsule (solid arrows) and splenic parenchyma (*) are not a true cystic degeneration but extensive hyalinization (Hy) (H&E stain, × 20).
A
C
A B C
B
D
attenuation was seen in the other six tumors; four of which con- tained a large proportion of viable cells and two residual tumors, which showed hemorrhagic necrosis without a viable portion, and a hyaline change in a predominant cystic mass. Our results show that increased CT attenuation after imatinib treatment without viable tumor cells. We found that most tumors decreased
in size; however, five of the 26 tumors grew, even though they eventually responded to imatinib treatment. The CT attenuation values also changed after imatinib treatment in most tumors; re- duced attenuation was seen in 20 of 26 tumors, whereas increased
Fig. 4. Transverse CT scans of a primary gastrointestinal stromal tumor (GIST) of the stomach in a 68-year-old man.
A. A CT scan before imatinib treatment showed a heterogeneously attenuated GIST arising in the stomach.
B. A CT scan obtained 27 months after imatinib treatment reveals a homogenous lesion with reduced attenuation and extensive internal calcification (solid arrow). The dominant gross and microscopic pathological finding was of hyalinization with abundant calcification.
A B
Fig. 5. Transverse CT scans of omental metastasis from gastrointestinal stromal tumor of small bowel in 64-year-old woman.
A. A CT scan before imatinib treatment showing highly attenuated heterogeneous round mass beside hepatic flexure of the co- lon (solid arrow).
B. A CT scan 14 months after imatinib treatment reveals a metastatic lesion (solid arrow). The size has decreased with an in- crease of homogeneity in internal attenuation.
C. Gross specimen of resected omental mass showing solid mass with minimal internal hemorrhage in the cut surface.
D. Photomicrograph of resected omental mass showing spindle-shaped hypercellular viable tumor (Vi) in most part of tumor with interspersed hyalinization (Hy). The viable tumor portion and the interspersed hyalinization with scanty hemorrhage occu- pied in about 75% and 25% of the tumor, respectively (H&E stain, × 100).
A B D
C
Some authors have reported the correlation between CT and pathological findings of surgically resected GISTs after imatinib treatment. Oh et al. (22) reported a few viable spindle cells and marked hyalinization of three stomach GISTs after neoadjuvant imatinib treatment. Dennis and Damjanov (7) reported that the most frequent changes found in resected GISTs after imatinib treatment were hyalinization and scarring. Additionally, myxoid degeneration, fibrosis, hemosiderin deposition, and infiltration of inflammatory and foam cells were common, whereas tumor necrosis was rare.
The exact pathophysiological basis for the relationship be- tween the histopathological and CT findings is unknown (23), although some investigators have proposed a model in which tumor hypoattenuation arises after imatinib treatment. Ima- tinib, like other molecularly targeted agents, has both cytostatic and cytotoxic effects, and apoptosis (programmed cell death), rather than necrosis, may play a role in the killing of cells within GISTs following imatinib treatment (24).
Quantifying tumor burden using a CT and radiological re- sponse evaluation based on the RECIST criteria is an important surrogate marker for the therapeutic response in clinical trials of anticancer agents. However, several studies have indicated that the RECIST criteria, which use only tumor size in the response evaluation, are insufficient for monitoring GISTs during ima- tinib treatment or for hypervascular tumors such as hepatocel- lular carcinoma (13-15). As a result, several response criteria such as the “Choi response criteria” and the “mRECIST criteria for hepatocellular carcinoma” (16) have been proposed. The re- sults of our study show that these new criteria more accurately reflect the pathological changes in treated GISTs.
In summary, reduced CT attenuation value in GISTs after imatinib treatment reflect hyalinization, cystic degeneration, was highly associated with residual viable tumor, and a weaker
correlation was detected between an increase in GIST size after imatinib treatment and the proportion of viable cells. We as- sumed that hyperattenuation of the hemorrhage or fine septa- tions of the cystic mass as well as the marked decrease in size of the tumor may have contributed to increase the CT attenuation in the two residual tumors. In particular, the last tumor showing increased attenuation may have been a measurement error due to the crowding effect of fine septations after the marked de- creased in tumor size.
Six tumors with a dominant hyaline change showed the most prominent decrease in CT attenuation after imatinib treatment compared to other four dominant pathological types. The other four types, but not the combined type tumors with increased at- tenuation (hypercellular areas with hyalinization and hemor- rhagic necrosis), showed similar CT attenuation values after ima- tinib treatment (Table 3). High CT attenuation (mean, 83.2 HU) before treatment in hyalinized tumors contributed to the most prominent change in CT attenuation. Some limitations of this study should be explained as it was impossible to confirm which histopathological feature contributed to the relatively high CT at- tenuation before surgery and the exact mechanism for the hya- line change in the tumors during imatinib treatment.
The main reason for reduced tumor attenuation was an ap- parent reduction in the proportion of viable and hypervascular tumor tissues after imatinib treatment. Of the four patients with a tumor showing a highly residual viable portion after treat- ment, one achieved SD and the other three achieved PR based on the RECIST criteria. However, it is likely that they will even- tually progress and develop resistance, as their tumors con- tained a high proportion of residual viable cells compared to tu- mors showing decreased attenuation after treatment.
Table 4. Duration of Imatinib Treatment and the Site of Resected Tumors According to the Pathological Features of GISTs after Imatinib Treatment
Dominant Pathological
Features Duration of Imatinib Treatment (Months) Site of Resected Tumor (n = 26)
Mean ± SD Range
Hemorrhagic necrosis (n = 7) 18.8 ± 7.3 9–27 Small bowel (n = 5), peritoneum (n = 1), pelvic soft tissue (n = 1) Cystic change (n = 7) 12.0 ± 10.1 3–29 Liver (n = 4), small bowel (n = 1), stomach (n = 1), peritoneum (n = 1) Hyaline change (n = 6) 18.7 ± 9.1 6–30 Stomach (n = 2), liver (n = 2), peritoneum (n = 1), spleen (n = 1) Cystic + hemorrhagic (n = 2) 34.0 ± 14.1 24–44 Peritoneum (n = 1), mediastinum (n = 1)
Hemorrhagic + hyaline +
hypercellular (n = 4) 16.0 ± 1.5 12–22 Peritoneum (n = 4)
Note.-GIST = gastrointestinal stromal tumor, SD = standard deviation
ior, and management. Ann Surg Oncol 2000;7:705-712 7. Dennis KL, Damjanov I. Evaluating and reporting gastroin-
testinal stromal tumors after imatinib mesylate treatment.
Open Pathol J 2009;3:53-57
8. Sarlomo-Rikala M, Kovatich AJ, Barusevicius A, Miettinen M. CD117: a sensitive marker for gastrointestinal stromal tumors that is more specific than CD34. Mod Pathol 1998;
11:728-734
9. Eisenberg BL, Judson I. Surgery and imatinib in the man- agement of GIST: emerging approaches to adjuvant and neoadjuvant therapy. Ann Surg Oncol 2004;11:465-475 10. Dematteo RP, Ballman KV, Antonescu CR, Maki RG, Pisters
PW, Demetri GD, et al. Adjuvant imatinib mesylate after resection of localised, primary gastrointestinal stromal tu- mour: a randomised, double-blind, placebo-controlled tri- al. Lancet 2009;373:1097-1104
11. Choi H. Critical issues in response evaluation on computed tomography: lessons from the gastrointestinal stromal tu- mor model. Curr Oncol Rep 2005;7:307-311
12. Therasse P, Arbuck SG, Eisenhauer EA, Wanders J, Kaplan RS, Rubinstein L, et al. New guidelines to evaluate the response to treatment in solid tumors. European Organization for Research and Treatment of Cancer, National Cancer Insti- tute of the United States, National Cancer Institute of Can- ada. J Natl Cancer Inst 2000;92:205-216
13. Benjamin RS, Choi H, Macapinlac HA, Burgess MA, Patel SR, Chen LL, et al. We should desist using RECIST, at least in GIST. J Clin Oncol 2007;25:1760-1764
14. Choi H, Charnsangavej C, de Castro Faria S, Tamm EP, Ben- jamin RS, Johnson MM, et al. CT evaluation of the response of gastrointestinal stromal tumors after imatinib mesylate treatment: a quantitative analysis correlated with FDG PET findings. AJR Am J Roentgenol 2004;183:1619-1628 15. Schiavon G, Ruggiero A, Schoffski P, van der Holt B, Bek-
ers DJ, Eechoute K, et al. Tumor volume as an alternative response measurement for imatinib treated GIST patients.
PLoS One 2012;7:e48372
16. Lencioni R, Llovet JM. Modified RECIST (mRECIST) assess- ment for hepatocellular carcinoma. Semin Liver Dis 2010;
30:52-60
17. Choi H, Faria S, Benjamin R, Podoloff D, Macapinlac H, Charnsangavej C. Monitoring treatment effects of STI-571 and/or hemorrhagic necrosis with little viable tumor, whereas
increased CT attenuation reflects the high possibility of residual hypercellular viable tumor with non-tumorous changes. Based on this histopathological background, changes in CT attenua- tion may indicate a satisfactory chemotherapeutic effect, even though the tumor has actually increased in size after imatinib treatment and even if the tumor is smaller after treatment. An increase in tumor attenuation may indicate that the chemother- apeutic effect is actually limited and there may be eventual pro- gression and development of drug resistance.
Our study had several limitations, including its retrospective nature. First, the dominant pathological finding did not allow us to determine whether tumor shrinkage was due to chemothera- py or reflecting the natural course of the tumor. The second con- cern is that CT attenuation was not measured using a pre-en- hanced CT scan. Increased attenuation in a tumor after imatinib treatment can be overestimated because of recent hemorrhagic necrosis. Finally, the radiologic changes were not directly corre- lated with the gross and microscopic pathological findings.
In conclusion, our results show that histopathological find- ings of GISTs treated with imatinib accurately reflect the chang- es on a CT scan, and this may be helpful when assessing the GIST response evaluation.
REFERENCES
1. George S, Desai J. Management of gastrointestinal stromal tumors in the era of tyrosine kinase inhibitors. Curr Treat Options Oncol 2002;3:489-496
2. DeMatteo RP, Lewis JJ, Leung D, Mudan SS, Woodruff JM, Brennan MF. Two hundred gastrointestinal stromal tumors:
recurrence patterns and prognostic factors for survival. Ann Surg 2000;231:51-58
3. Roberts PJ, Eisenberg B. Clinical presentation of gastroin- testinal stromal tumors and treatment of operable disease.
Eur J Cancer 2002;38 Suppl 5:S37-S38
4. Lehnert T. Gastrointestinal sarcoma (GIST)--a review of sur- gical management. Ann Chir Gynaecol 1998;87:297-305 5. Judson I. Gastrointestinal stromal tumours (GIST): biology
and treatment. Ann Oncol 2002;13 Suppl 4:287-289 6. Pidhorecky I, Cheney RT, Kraybill WG, Gibbs JF. Gastroin-
testinal stromal tumors: current diagnosis, biologic behav-
21. Chen MY, Bechtold RE, Savage PD. Cystic changes in hepatic metastases from gastrointestinal stromal tumors (GISTs) treated with Gleevec (imatinib mesylate). AJR Am J Roent- genol 2002;179:1059-1062
22. Oh JS, Lee JL, Kim MJ, Ryu MH, Chang HM, Kim TW, et al.
Neoadjuvant imatinib in locally advanced gastrointestinal stromal tumors of the stomach: report of three cases. Can- cer Res Treat 2006;38:178-183
23. Bechtold RE, Chen MY, Stanton CA, Savage PD, Levine EA.
Cystic changes in hepatic and peritoneal metastases from gastrointestinal stromal tumors treated with Gleevec. Ab- dom Imaging 2003;28:808-814
24. Reynoso D. Bim mediates imatinib-induced apoptosis of gastrointestinal stromal tumors: Translational implications.
UT GSBS Dissertations and Theses (Open Access) 2012:11-12 on gastrointestinal stromal tumors (GIST) with CT and PET:
a quantitative analysis. Chicago, IL: Presented at Radio- logical Society of North America Scientific Program, 2002 18. Prasad SR, Jhaveri KS, Saini S, Hahn PF, Halpern EF, Sum- ner JE. CT tumor measurement for therapeutic response assessment: comparison of unidimensional, bidimensional, and volumetric techniques initial observations. Radiology 2002;225:416-419
19. Hong X, Choi H, Loyer EM, Benjamin RS, Trent JC, Charnsan- gavej C. Gastrointestinal stromal tumor: role of CT in diag- nosis and in response evaluation and surveillance after treatment with imatinib. Radiographics 2006;26:481-495 20. Kim HC, Lee JM, Choi SH, Han H, Kim SS, Lee SH, et al.
Cystic changes in intraabdominal extrahepatic metastases from gastrointestinal stromal tumors treated with ima- tinib. Korean J Radiol 2004;5:157-163
Imatinib Mesylate 치료 후 위장관 간질종양의 CT 및 병리소견의 비교1
심기춘
1· 박범진
1· 한나연
1· 성득제
1· 김민주
1· 조성범
1· 하현권
2· 김형래
3목적: Imatinib masylate (이하 imatinib) 치료를 받은 위장관 간질종양 환자에서의 CT와 병리 소견을 비교 분석하고자 하였다.
대상과 방법: 총 26명(남자: 17명, 여자: 9명, 평균 연령: 56세)의 위장관 간질종양 환자에서 imatinib 치료를 받은 후 수술적으로 제거된 26개의 종양을 대상으로 하였다. 총 26개의 종양 중 8개는 원발성 종양, 18개는 전이성 종양이었다.
Imatinib 치료가 종료된 후 평균 17.3개월(기간: 3~44개월) 후에 종양의 수술이 시행되었으며 26개의 모든 종양에서 CT-병리 소견의 비교 분석이 이루어졌다.
결과: Imatinib 치료 후 종양의 평균적인 크기 변화는 1.4 cm가 감소되었으며, 최대 7.8 cm 감소에서부터 2.5 cm 증가 까지 관찰되었다. CT 감쇄 계수의 감소는 20개의 종양에서 관찰하였고, 이 20개의 종양은 평균 29.1 Hounsfield unit (이하 HU)이 감소하였다(범위, 7.6~57.1 HU). 종양에서 HU이 감소된 부분의 주된 병리소견은 유리질 변성(6/20), 출 혈성 괴사(6/20), 낭성 변성(6/20), 혹은 복합된 병리소견과 희박한 생존 종양 부위(2/20)였다. 치료 후에 HU이 증가된 종양은 6개가 있었으며, 그 중 4개는 풍부한 생존 부위를 포함한 종양이었다. 종양 크기 증가는 생존 부위의 존재 유무와 는 연관이 없었다.
결론: 위장관 간질종양에서 CT 감쇄 계수의 변화는 imatinib 치료 후의 병리학적인 소견을 적절하게 반영하는 것으로 보 인다.
1고려대학교 의과대학 안암병원 영상의학과, 2울산대학교 의과대학 서울아산병원 영상의학과,
3강원대학교 의학전문대학원 영상의학과