INTRODUCTION
Vitamin D, a fat-soluble steroid hormone, is important for calcium and phosphorus homeostasis and musculoskeletal health. In children, severe vitamin D deficiency manifests as rickets, and vitamin D inadequacy can impair attainment of peak bone mass. In adults, inadequate vitamin D can result in secondary hyperparathyroidism, decreased bone mineral density, osteomalacia, and increased risk of fragility fractures (1). Moreover, inadequate vitamin D may be involved in the pathogenesis and/or progression of several disorders, includ- ing cancer, hypertension, osteoarthritis, diabetes, and other autoimmune diseases (1-6).
Infants between 4 months and 2 yr of age are at a high risk for the relative vitamin D deficiency because of their rapid growth in skeletal system. The incidence of vitamin D defi- ciency during infancy had been decreased in the past with the improvement of nutritional condition such as vitamin D supplementation in infant formula. But, lately it has been increased again for various reasons such as breast-feeding from vitamin D deficient mother, lack of sun-light exposure (cos- metic or dermatologic reasons, sun-block, etc.), high latitude,
dark skin, and low dietary intake of vitamin D, etc. (7-10).
In response to the resurgence of rickets especially in breast- fed infants, the American Academy of Pediatrics revised its policy on vitamin D supplementation to infants and children in 2003 (11).
The incidence of vitamin D deficiency would be high as well in Korean infants for similar reasons, but there are few clinical studies performed to evaluate the nutritional status of vitamin D during infancy. Therefore, in this study, we evalu- ate the vitamin D status in Korean infants, and further deter- mine the efficacy of vitamin D supplementation on the vita- min D nutritional status and bone mineralization in term breast-fed infants.
MATERIALS AND METHODS Subjects and study design
This study was approved by the Institutional Review Board of Chungbuk National University. And the informed consents were obtained from mothers. The healthy term infants deliv-
83
Mi-Jung Kim1, Bomi Na1, So-Jung No1, Heon-Seok Han1, Eun-Hwan Jeong2, Wonkuk Lee3, Younghee Han4, and Taisun Hyeun4
Departments of Pediatrics1, Obstetric and Gynecology2, and Nuclear Medicine3, College of Medicine;
Department of Food and Nutrition4, Chungbuk National University, Cheongju, Korea
Address for Correspondence Mi-Jung Kim, M.D.
Department of Pediatrics, Chungbuk National University Hospital, 410 Sungbong-ro, Heungduk-gu, Cheongju 361-711, Korea
Tel : +82.43-269-6351, Fax : +82.43-264-6620 E-mail : [email protected] This work was supported by the Korea Research Foundation Grant funded by the Korean Government (MOEHRD) (R04-2004-000-10205-0).
Nutritional Status of Vitamin D and the Effect of Vitamin D Supplementation in Korean Breast-fed Infants
We investigated the vitamin D status and the effect of vitamin D supplementation in Korean breast-fed infants. The healthy term newborns were divided into 3 groups;
A, formula-fed; B, breast-fed only; S, breast-fed with vitamin D supplementation. We measured serum concentrations of vitamin D (25OHD3), calcium (Ca), phosphorus (P), alkaline phosphatase (AP), intact parathyroid hormone (iPTH) and bone min- eral density (BMD) at 6 and 12 months of age. Using questionnaires, average dura- tion of sun-light exposure and dietary intake of vitamin D, Ca and P were obtained.
At 6 and 12 months of age, 25OHD3 was significantly higher in group S than in group B (P<0.001). iPTH was significantly lower in group S than in group B at 6 months (P=0.001), but did not differ at 12 months. Regardless of vitamin D supplementa- tion, BMD was lower in group B and S than in group A (P<0.05). Total intake of vita- min D differed among 3 groups (P<0.001, A>S>B), but total intake of Ca and P were higher in group A than in group B and S (P<0.001). In conclusion, breast-fed infants show lower vitamin D status and bone mineralization than formula-fed infants. Vita- min D supplementation (200 IU/day) in breast-fed infants increases serum 25-OH vitamin D3, but not bone mineral density.
Key Words : Vitamin D; Nutritional Status; Bone Density; Vitamin D Deficiency; Dietary Supplements; Breast feeding; Infant
ⓒ 2010 The Korean Academy of Medical Sciences.
This is an Open Access article distributed under the terms of the Creative Commons Attribution Non-Commercial License (http://creativecommons.org/licenses/by-nc/3.0) which permits unrestricted non-commercial use, distribution, and reproduction in any medium, provided the original work is properly cited.
Received : 17 October 2008 Accepted : 4 March 2009
ered at Chungbuk National University Hospital from July 2004 through June 2005 were enrolled in this study. Study infants were divided into 3 groups: A, formula-fed; B, breast- fed only without supplementation; S, breast-fed with vitamin D supplementation. During 1 yr follow-up period after en- rollment, serum concentrations of vitamin D (25OHD3), calcium (Ca), inorganic phosphorus (P), alkaline phosphatase (AP), intact parathyroid hormone (iPTH), bone mineral den- sity (BMD), and bone mineral content (BMC) were measured at birth, 6 and 12 months of age. Average duration of sun- light exposure (min/day) and total intake of vitamin D, Ca and P were obtained by maternal interview using question- naires.
Vitamin D supplementation
In group S infants, 0.5 mL of Poly-Vitamin Drops�(Hi- Tech Pharmacal Co. Inc., Amityville, NY, USA) was given once a day from 2 months of age till the end of this study.
Poly-Vitamin Drops�, a multivitamin preparation, contains vitamin A (1,500 IU/mL), vitamin D (400 IU/mL), vitamin E (5 IU/mL), vitamin C (35 mg/mL), thiamin (0.5 mg/mL), riboflavin (0.6 mg/mL), niacin (8 mg/mL), vitamin B6(0.4 mg/mL), iron (10 mg/mL), and fluoride (0.25 mg/mL).
Biochemical analysis
Serum samples were stored at -20℃in light-proof bot- tles before biochemical assay in the Green-Cross Laboratory, Seoul, Korea. Serum 25OHD3 concentration was measured by radioimmunoassay (25OH-VIT.D3-RIA-CA kit, Bio- source, Europe; intra-assay and interassay coefficient of vari- ation, 4.7 and 5.3, respectively) and intact PTH (iPTH) by electrochemiluminescence (reference: 15-65 pg/dL).
In this study, vitamin D deficiency, insufficiency, and suf- ficiency were defined as serum 25OHD3 level less than 11 ng/mL, 11-30 ng/mL, and over 30 ng/mL, respectively (1, 4, 12, 13).
Analysis of bone mineralization
Study infants at 6 and 12 months of age underwent the measurement of lumbar-spine (L2-L4) bone mineral content (BMC, g) and areal bone mineral density (BMD, g/cm2) by dual-energy radiography absorptiometry (DXA) using the Lunar Expert-XL DEX system (Lunar Corp., Madison, WI, USA) or Norland XR-36 system (Norland Medical System, Inc., Atkinson, WI, USA) according to the manufacturer’s operator manuals.
Survey: sun-light exposure and dietary intake
The average duration of sun-light exposure per day (UV, min/day) were derived from the minutes spent outside dur-
ing 3 days preceeding the visit. Dietary intake data were col- lected using a 24-hr recall method at 6 and 12 months of age to estimate the intakes of vitamin D, calcium, and phospho- rus. Breast milk intake was estimated by multiplying the nursing frequency and the average amount of milk per nurs- ing which was measured in 6 month-old infants in a previous study (14). The intake of each nutrient was calculated based on the nutrient database in the 8th edition of Pediatrics (vita- min D, 6 mg/L; calcium, 270 mg/L; phosphorus, 140 mg/L of breast milk), the 7th Korean Recommended Dietary Al- lowances (15), vitamin D composition published in Korea Health Industry Development Institute (16), and the nutri- tion label claimed by the manufacturers in formula using DS24 WIN Program (nutrient analysis software developed by Human Nutrition Lab. in Seoul National University) in the Department of Food and Nutrition.
Statistical analysis
We assessed differences between groups using chi-square test for categorical variables and t-test or ANOVA followed by Duncan procedure for post-hoc test for continuous vari- ables, as appropriate. P<0.05 was considered statistically sig- nificant.
RESULTS
Demographic data, lifestyle characteristics, and vitamin D status of the study infants and mothers at birth
Total 74 newborns and their mothers were studied at birth, among which 25, 28, and 21 infants belonged to the group A (formula-fed), group B (breast-fed only), and group S (breast- fed with vitamin D supplementation), respectively.
About 60% of study infants were male, and their mean ges- tational age, body weight, length, and head circumference at birth were 276±9.0 days, 3.25±0.37 kg, 49.7±2.01 cm, and 34.0±1.37 cm, respectively. There were no differ- ences among 3 study groups in demographic and lifestyle characteristics such as maternal age, job, education and resi- dence at the time of delivery. Study infants were enrolled for 1 yr spanning all 4 seasons, with 48-62% delivered from June through November (Table 1).
The mean 25OHD3 level was 24.5±10.7 ng/mL in moth- ers, and 17.7±7.0 ng/mL in newborns, of which 18% were vitamin D deficient and 73.6% were insufficient. There were no statistically significant differences among our 3 study groups in laboratory data at birth as well (Table 2).
Vitamin D status and the effect of vitamin D
supplementation in breast-fed infants at 6 months of age Number of study infants at 6 months were 25, 28, and 21
in group A, B, and S, respectively. The mean age was 179± 12.0 days, and there were no differences among 3 groups in infants’ age, sex, and the other anthropometric data (Table 3).
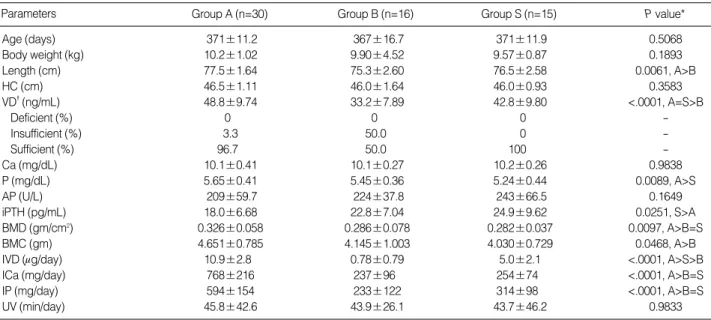
The mean 25OHD3 levels of infants in group A, B, and S were 44.0±11.6, 22.5±9.24, and 34.7±12.3 ng/mL, res- pectively, which were significantly different among 3 groups (P<0.001, A>S>B). The prevalence of vitamin D deficiency and insufficiency were 0% and 12%, 11% and 68%, and 0%
and 45% in group A, B, and S, respectively. Serum Ca and AP levels were not different (P>0.05), but serum P level was significantly different among 3 groups (P<0.001, A>S>B).
The iPTH levels in group B was 45.1±46.3 pg/mL, signifi- cantly higher than those in group A (15.8±5.48 pg/mL) and S (13.9±6.42 pg/mL) (P=0.001, B>A=S). Especially, all 6 infants whose 25OHD3 levels were less than 15 ng/mL had the iPTH levels above 40 ng/mL, presenting secondary hyperparathyroidism due to vitamin D deficiency (Table 3, Fig. 1A, B, 2A).
The BMD at 6 months of age were 0.278±0.045, 0.247
±0.053 and 0.233±0.054 g/cm2in group A, B, and S, res- pectively. Both BMD and BMC were lower in group B and S than those in group A (P<0.05, A>B=S) (Table 3, Fig. 1C).
Vitamin D status of study infants and the effect of vitamin D supplementation in breast-fed infants at 12 months of age
Number of infants participated in 12 months evaluation were 30, 16, and 15 in group A, B and S, respectively. The mean age was 370±13.2 days, and there were no differences among 3 groups in infant age, sex, and other anthropometric data (P>0.05), except the length (P=0.006, A>B, Table 4).
The 25OHD3 levels of infants in group A, B, and S were 48.8±9.74, 33.2±7.89 and 42.8±9.80 ng/mL, respec- tively, which was the lowest in group B and showed no dif- ferences between group A and S (P<0.001, A=S>B). None of the study infants at 12 months were vitamin D deficient,
Values are presented as mean±standard deviation or number (percentile).
Group A, formula-fed; Group B, breast-fed with no supplementation; Group S, breast-fed with vitamin D supplementation.
*P value by c2-test for categorical variables, ANOVA for continuous variables.
GP, gestational period; HC, head circumference; Edu, education; Jun-Nov, June through November.
Group A (n=25)
Parameters Group B (n=28) Group S (n=21) P value*
Maternal characteristics
Age (yr) 32.1±3.6 30.2±5.7 31.9±4.2 0.2789
Employed (%) 12/25 (52.0) 6/28 (21.4) 8/21 (38.1) 0.0686
College-graduated (%) 18/24 (75.0) 14/26 (53.8) 14/21 (66.7) 0.4457
Neonatal characteristics
Sex (male) 13 (52.0) 18 (64.3) 13 (61.9) 0.6377
GP (days) 273±8.0 278±8.8 278±8.9 0.1438
Body weight (kg) 3.22±0.41 3.30±0.40 3.25±0.30 0.7068
Length (cm) 49.8±1.75 50.1±2.26 49.5±2.05 0.6664
HC (cm) 33.9±1.45 34.0±1.60 34.3±1.20 0.6816
Urban residency (%) 23 (92.0) 21 (75.0) 16 (76.2) 0.2293
Season (Jun-Nov) (%) 12 (48.0) 17 (60.7) 13 (61.9) 0.5525
Table 1. Comparison of baseline demographic data and lifestyle characteristics of the infants and mothers among 3 study groups at birth
Values are presented as mean±standard deviation or percentile.
Group A, formula-fed; Group B, breast-fed with no supplementation; Group S, breast-fed with vitamin D supplementation.
*P value by ANOVA; �Vitamin D deficient, insufficient, and sufficient were defined as 25OHD3 <11 ng/mL, 11-30 ng/mL, and >30 ng/mL, respectively.
VD, serum 25-OH vitamin D3(25OHD3); Ca, calcium; P, phophorus; AP, alkaline phosphatase; iPTH, intact parathyroid hormone.
Group A (n=25)
Parameters Group B (n=28) Group S (n=21) P value*
Maternal VD (ng/mL) 24.1±10.9 24.5±12.5 24.8±8.48 0.9744
Neonatal data
VD�(ng/mL) 17.0±7.6 18.0±10.3 18.1±5.6 0.8764
Deficient (%) 20.0 26.9 4.8 -
Insufficient (%) 72.0 61.5 90.5 -
Sufficient (%) 8.0 11.5 4.8 -
Ca (mg/dL) 9.96±0.75 9.92±0.73 10.0±0.54 0.9230
P (mg/dL) 5.22±0.63 5.37±0.62 5.43±0.81 0.5379
AP (U/L) 144±44.5 136±34.3 143±39.5 0.8229
iPTH (pg/mL) 5.69±3.82 5.46±2.82 5.65±3.73 0.9716
Table 2. Comparison of vitamin D status of the infants and mothers among 3 study groups at birth
although 50% of infants in group B were vitamin D insuf- ficient. Serum Ca and AP levels were not different among 3 groups, whereas serum P was significantly lower in group S
than in group A (P=0.009, A>S, A=B, and B=S). The iPTH levels in group A, B, and S were 18.0±6.68, 22.8±7.04, 24.9±9.62 pg/mL, respectively. Group S showed significant-
Fig. 2. Relationship between serum 25-OH vitamin D3(25OHD3, VD) and parathyroid hormone (PTH=iPTH) levels at 6 months (A) and 12 months of age (B).
PTH (pg/mL)
180
120
60
00 10 20 30 40 50 60 70 80
VD (ng/mL) 25OHD3 vs. PTH at 6 months
A
PTH (pg/mL)
180
120
60
00 10 20 30 40 50 60 70 80
VD (ng/mL)
25OHD3 vs. PTH at 12 months
B Group A (n=25)
Parameters Group B (n=28) Group S (n=21) P value*
Age (days) 181±10.9 180±11.0 175±14.2 0.2077
Body weight (kg) 8.58±1.04 8.50±0.97 8.22±1.03 0.7616
Length (cm) 69.1±2.14 68.0±3.07 68.1±2.21 0.2271
HC (cm) 43.4±1.37 43.2±1.24 43.1±1.44 0.7471
VD�(ng/mL) 44.0±11.6 22.5±9.24 34.7±12.3 <.0001, A>S>B
Deficient (%) 0 10.7 0 -
Insufficient (%) 12.0 67.9 45.0 -
Sufficient (%) 88.0 21.4 55.0 -
Ca (mg/dL) 10.4±0.39 10.3±0.42 10.4±0.21 0.2135
P (mg/dL) 6.27±0.33 5.43±0.80 5.76±0.25 <.0001, A>S>B
AP (U/L) 223±50.9 241±77.7 223±69.4 0.5449
iPTH (pg/mL) 15.8±5.48 45.1±46.3 13.9±6.42 0.0010, B>A=S
BMD (g/cm2) 0.278±0.045 0.247±0.053 0.233±0.054 0.0144, A>B=S
BMC (g) 3.591±0.716 3.032±0.878 2.792±0.949 0.0078, A>B=S
IVD (mg/day) 10.9±2.5 0.58±0.35 5.1±0.97 <.0001, A>S>B
ICa (mg/day) 496±129 234±59 230±48 <.0001, A>B=S
IP (mg/day) 362±114 129±39 123±32 <.0001, A>B=S
UV (min/day) 34.6±40.3 36.1±35.2 68.7±101 0.1290
Table 3. Comparison of vitamin D status and its influencing factors of the infants among 3 study groups at 6 months of age
Values are presented as mean±standard deviation or percentile.
Group A, formula-fed; Group B, breast-fed without supplementation; Group S, breast-fed with vitamin D supplementation.
*P value by ANOVA, posthoc test with Duncan procedure; �Vitamin D deficient, insufficient, and sufficient were defined as 25OHD3 <11 ng/mL, 11-30 ng/mL, and >30 ng/mL, respectively.
HC, head circumference; VD, serum 25-OH vitamin D3(25OHD3); Ca, calcium; P, inorganic phophorus; AP, alkaline phosphatase; iPTH, intact parathy- roid hormone; BMD, bone mineral density; BMC, bone mineral content; IVD, ICa, IP, total intake of vitamin D, Ca, P; UV: sun-light exposure time.
Fig. 1. Comparison of serum levels of 25-OH vitamin D3(25OHD3) (A), parathyroid hormone (PTH=iPTH) (B), and bone mineral density (BMD) (C) among 3 study groups at birth, 6, and 12 months of age (A, formula-fed; B, breast-fed without supplementation; S, breast-fed with vitamin D supplementation).
25OHD3 (ng/mL)
100 80 60 40 20
0
At birth 6 months 12 months A
B S
P=0.876
P<0.001 P<0.001
A
PTH (pg/mL)
100 80 60 40 20
0
At birth 6 months 12 months A
B S
P=0.971
P=0.001
P=0.025
B BMD (g/cm2)
0.5 0.4 0.3 0.2 0.1
0
At birth 6 months 12 months A
B
S P=0.014
P=0.009
C
ly higher iPTH than group A, although neither group A nor group S was significantly different from group B (P=0.025, S>A, A=B, and B=S) (Table 4, Fig. 1A, B).
The BMDs in group A, B, and S at 12 months of age were 0.326±0.058, 0.286±0.078, and 0.282±0.037 g/cm2, respectively, which was significantly higher in group A than those in both group B and S (P=0.010, A>B=S). The BMC was significantly higher in group A than in group S, but there were no differences either between group A and B or bet- ween group B and S (P=0.025, A>S, A=B, and B=S) (Table 4, Fig. 1C).
Dietary intake of vitamin D and sun-light exposure at 6 and 12 months of age
The mean amount of formula intake per day in group A were 874±207, 806±208 mL/day at 6 and 12 months of age, whereas the estimated daily amount of breast-milk in- take in group B and S were 793±178 and 788±157 mL/
day at 6 months of age, 488±164 and 459±236 mL/day at 12 months of age. The ages when solid food was first intro- duced were similar among 3 groups, 5.32±1.12, 5.79±0.99, 5.76±0.83 months in group A, B, and S, respectively.
At both 6 and 12 months of age, total intake of vitamin D (the sum of vitamin D intake from milk, solid food and vita- min supplementation) were the highest in group A, middle in group S, and lowest in group B (P<0.001, A>S>B). Total intake of Ca and P were higher in formula-fed infants than
breast-fed infants (P<0.001, A>B=S). In the mean time, aver- age durations of sun-light exposure were similar in 3 groups (Table 3, 4).
DISCUSSION
In this study, serum levels of 25-OH vitamin D3(25OH- D3), iPTH and BMD were measured as indices for vitamin D nutritional status (3, 12, 17). In general, vitamin D defi- ciency in infancy and childhood presents clinical manifesta- tions such as rickets, and vitamin D insufficiency may result in an asymptomatic biochemical abnormality such as secondary hyperparathyroidism (5, 13, 17, 18). We defined vitamin D deficiency, insufficiency, and sufficiency as 25OHD3 less than 11 ng/mL, 11-30 ng/mL, and over 30 ng/mL, respectively (4, 12, 13). However, vitamin D deficient infants as defined in our study did not show clinical symptom of rickets. Only 6 infants whose 25OHD3 levels less than 15 ng/mL showed increased iPTH levels above 40 pg/mL, suggestive of secondary hyperparathyroidism due to vitamin D insufficiency.
In adults, BMD correlates with the serum vitamin D lev- els (19), whereas, in infants, it has been reported to have no correlation with the serum vitamin D levels (20-23). Since lumbar-spine (L2-L4) bone mineral density does not have normal reference values for the infants less than 1 yr of age, we simply compared BMDs among 3 study groups.
The overall prevalence of vitamin D deficiency and insuf-
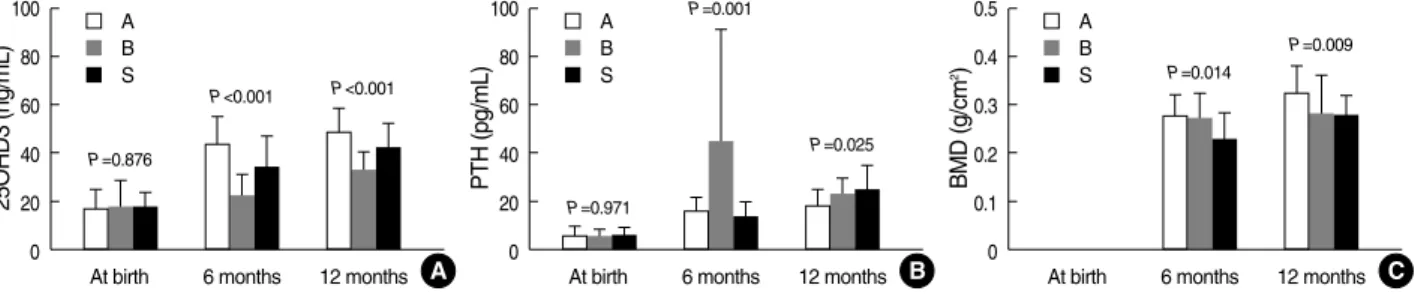
Group A (n=30) Group B (n=16) Group S (n=15) P value*
Age (days) 371±11.2 367±16.7 371±11.9 0.5068
Body weight (kg) 10.2±1.02 9.90±4.52 9.57±0.87 0.1893
Length (cm) 77.5±1.64 75.3±2.60 76.5±2.58 0.0061, A>B
HC (cm) 46.5±1.11 46.0±1.64 46.0±0.93 0.3583
VD�(ng/mL) 48.8±9.74 33.2±7.89 42.8±9.80 <.0001, A=S>B
Deficient (%) 0 0 0 -
Insufficient (%) 3.3 50.0 0 -
Sufficient (%) 96.7 50.0 100 -
Ca (mg/dL) 10.1±0.41 10.1±0.27 10.2±0.26 0.9838
P (mg/dL) 5.65±0.41 5.45±0.36 5.24±0.44 0.0089, A>S
AP (U/L) 209±59.7 224±37.8 243±66.5 0.1649
iPTH (pg/mL) 18.0±6.68 22.8±7.04 24.9±9.62 0.0251, S>A
BMD (gm/cm2) 0.326±0.058 0.286±0.078 0.282±0.037 0.0097, A>B=S
BMC (gm) 4.651±0.785 4.145±1.003 4.030±0.729 0.0468, A>B
IVD (mg/day) 10.9±2.8 0.78±0.79 5.0±2.1 <.0001, A>S>B
ICa (mg/day) 768±216 237±96 254±74 <.0001, A>B=S
IP (mg/day) 594±154 233±122 314±98 <.0001, A>B=S
UV (min/day) 45.8±42.6 43.9±26.1 43.7±46.2 0.9833
Table 4. Comparison of vitamin D status and its influencing factors of the infants among 3 study groups at 12 months of age
Values are presented as mean±standard deviation or percentile.
Group A, formula-fed; Group B, breast-fed without supplementation; Group S, breast-fed with vitamin D supplementation.
*P value by ANOVA, posthoc test with Duncan procedure; �Vitamin D deficient, insufficient, and sufficient were defined as 25OHD3 <11 ng/mL, 11-30 ng/mL, and >30 ng/mL, respectively.
HC, head circumference; VD, serum 25-OH vitamin D3(25OHD3); Ca, calcium; P, inorganic phophorus; AP, alkaline phosphatase; iPTH, intact parathy- roid hormone; BMD, bone mineral density; BMC, bone mineral content; IVD, ICa, IP, total intake of vitamin D, Ca, P; UV: sun-light exposure time.
Parameters
ficiency in our study were 18% and 74% at birth, 4% and 43% at 6 months, and 0% and 15% at 12 months of age.
The prevalence of vitamin D deficiency in our study is lower than the data reported by Challa et al. (56-91% at birth and 21-30% at 6 months), but similar to the data by Weiler et al.
(36% at birth by using cord blood levels of vitamin D less than 11 ng/mL) (20, 24).
Serum vitamin D level was determined by 2 major factors, i.e., the dietary intake and production in the skin when ex- posed to the sun (ultraviolet B irradiation, UVB) (1). Healthy term infants are born with the storage of vitamin D enough for next couple of months, and the half-life of serum vitamin D is 12-20 days. Infant formula has been fortified with suffi- cient amount of vitamin D (>400 IU/L), whereas breast milk contain only 12-60 IU/L of vitamin D which is much less than the required maintenance amount (200 IU/day) as recom- mended by National Academy of Science (NAS) (25, 26). On top of that, dermal conversion is seasonally unreliable source of vitamin D and may not compensate for low nutritional intake, particularly in infants whose skin exposure to sunlight is limited (27). Therefore, exclusively breast-fed infants are at high risk of vitamin D deficiency and insufficiency. Actu- ally, the breast-fed infants showed significantly lower vitamin D status and bone mineralization than the formula-fed infants, as revealed in this study.
Measures to prevent vitamin D deficiency include increas- ed skin exposure to sunlight, increased fortification of food items with vitamin D, and vitamin D supplementation (13).
In our study, we supplemented breast-fed infants with 200 IU/day of vitamin D from 2 months of age as recommended by American Academy of Pediatrics (AAP) in 2003 in order to evaluate the efficacy of vitamin D supplementation. We compared their vitamin D status and BMD with those of 2 control groups, one with breast-fed without supplementation and the other with formula-fed at 6 and 12 months of age.
Our results showed that vitamin D supplementation (200 IU/day) in breast-fed infants increased serum 25-OH vita- min D3, but did not increase bone mineral density. As a mat- ter of fact, BMD and BMC were lower in breast-fed infants than in formula-fed infants, regardless of vitamin D supple- mentation. As vitamin D level increased at 6 months, iPTH in supplemented group was significantly lower than in breast- fed control. But at 12 months of age, unlike our expectation, iPTH in supplemented group became rather higher, yet of no significant difference, despite higher vitamin D level as compared with breast-fed control.
Season, residence, and sun-light exposure were compared in order to evaluate the factors on vitamin D status in this study, and there were no differences among 3 study groups.
On the contrary, dietary intake of vitamin D, Ca, and P at 6 and 12 months were significantly different among 3 groups.
According to our survey data, daily intake of these nutrients in all breast-fed infants, regardless of vitamin supplementa- tion, were lower than those recommended for 5-11 month-
old infants in the 7th Korean Recommended Dietary Allo- wances (10 mg/day of vitamin D, 300 mg/day of calcium, and 300 mg/ day of phosphorus).
Based on our results, it was supposed that 200 IU/day of vitamin D supplementation in breast-fed infants did increase serum 25-OH vitamin D3, but did not increase BMD, and did not fully correct iPTH at 12 months. Regarding these unexpected results in our study, we speculated firstly that 200 IU/day of vitamin D supplementation in AAP recom- mendation (2003) might not be enough to correct the vita- min D insufficiency in late infancy. Since some researchers have suggested 400-800 IU/day of vitamin D intake for the prevention of vitamin D deficiency, further studies are war- ranted to examine dose-responsive relationship of vitamin D supplementation (1, 9, 28).
Secondly, the amount of calcium intake should be consid- ered. BMD depends mainly on the amount of total body cal- cium. Therefore, an increase in calcium intake alone can en- hance bone mineralization and effectively suppress the sec- retion of iPTH (5, 13). It is plausible that the difference in BMD and iPTH between the breast-fed and the formula-fed group might result from a large amount of calcium intake in formula-fed infants, independent of vitamin D. In addition, 1,25(OH)2D could mobilize calcium by increasing bone re- sorption of osteoclasts if the calcium intake is very low (1, 5).
The unexpected result of iPTH in supplemented group at 12 months might also be caused by a relative excess of vitamin D to low Ca, P intake in breast-fed infants (29). Therefore, a clinical trial of co-supplementation of vitamin D with calci- um would be considered to elucidate this possibility.
Lastly, the other nutrients such as iron (10 mg/mL) and flu- oride (0.25 mg/mL) contained in our multivitamin prepara- tion for vitamin D source should be elucidated, because those nutrients could influence vitamin D status and bone miner- alization. Currently there is no commercially available prepa- ration of vitamin D alone. A preparation of vitamin D alone needs to be developed and used in future study to exclude this problem.
In conclusion, vitamin D deficiency or insufficiency was relatively common in Korean infants. Especially, breast-fed infants showed lower vitamin D status and bone mineraliza- tion than formula-fed infants. Vitamin D supplementation (200 IU/day) in breast-fed infants increased serum 25-OH vitamin D3, but did not increase bone mineral density.
REFERENCES
1. Holick MF. High prevalence of vitamin D inadequacy and implica- tions for health. Mayo Clin Proc 2006; 81: 353-73.
2. Holick MF. The vitamin D epidemic and its health consequences. J Nutr 2005; 135: 2739S-48S.
3. Hollis BW, Wagner CL. Nutritional vitamin D status during preg- nancy: reasons for concern. CMAJ 2006; 174: 1287-90.
4. Grant WB, Holick MF. Benefits and requirements of vitamin D for optimal health: a review. Altern Med Rev 2005; 10: 94-111.
5. Lips P. Vitamin D physiology. Prog Biophys Mol Biol 2006; 92: 4-8.
6. Muhe L, Lulseged S, Mason KE, Simoes EA. Case-control study of the role of nutritional rickets in the risk of developing pneumonia in Ethiopian children. Lancet 1997; 349: 1801-4.
7. Callaghan AL, Moy RJ, Booth IW, Debelle G, Shaw NJ. Incidence of symptomatic vitamin D deficiency. Arch Dis Child 2006; 91: 606-7.
8. Rajakumar K, Thomas SB. Reemerging Nutritional Rickets. A His- torical Perspective. Arch Pediatr Adolesc Med 2005; 159: 335-41.
9. Dawodu A, Agarwal M, Hossain M, Kochiyil J, Zayed R. Hypovita- minosis D and vitamin D deficiency in exclusively breast-feeding in- fants and their mothers in summer: A justification for vitamin D sup- plementation of breast-feeding infants. J Pediatr 2003; 142: 169-73.
10. Holick MF. Environmental factors that influence the cutaneous pro- duction of vitamin D. Am J Clin Nutr 1995; 61: 638S-45S.
11. Gartner LM, Greer FR; Section on Breastfeeding and Committee on Nutrition. American Academy of Pediatrics. Prevention of rickets and vitamin D deficiency: New guidelines for vitamin D intake. Pediatrics 2003; 111: 908-10.
12. Hollis BW. Circulating 25-hydroxyvitamin D levels indicative of vitamin D sufficiency: Implications for establishing a new effective dietary intake recommendation for vitamin D. J Nutr 2005; 135:
317-22.
13. Saadi HF, Nagelkerke N, Benedict S, Qazaq HS, Zilahi E, Mohama- diyeh MK, AL-Suhaili AI. Predictors and relationships of serum 25 hydroxyvitamin D concentration with bone turnover markers, bone mineral density, and vitamin D receptor genotype in Emirati women.
Bone 2006; 39: 1136-43.
14. Hyun T, Han HS, Kim KY. Effects of soy formula on micronutrient nutriture, bone density and microfloral composition. A final report on Dr. Chung’s Food Co. Research Grant, 2006.
15. Korean Nutrition Society. Recommended dietary allowances for Kore- ans, 7th revision, Seoul, 2000.
16. Korea Health Industry Development Institute. Development of Nutri- ent Database II; Vitamin composition of foods; 2002.
17. Lips P. Vitamin D deficiency and secondary hyperparathyroidism in the elderly: consequences for bone loss and fractures and therapeu- tic implications. Endocr Rev 2001; 22: 477-501.
18. Spence JT, Serwint JR. Secondary prevention of vitamin D deficien-
cy rickets. Pediatr 2004; 113: e70-2.
19. Bischoff-Ferrari HA, Dietrich T, Orav EJ, Dawson-Hughes B. Posi- tive association between 25-hydroxy vitamin D levels and bone min- eral density: a population-based study of younger and older adults.
Am J Med 2004; 116: 634-9.
20. Weiler H, Fitzpatrick-Wong S, Veitch R, Kovacs H, Schellenberg J, McCloy U, Yuen CK. Vitamin D deficiency and whole-body and femur bone mass relative to weight in healthy newborns. CMAJ 2005;
172: 757-61.
21. Namgung R, Tsang RC, Lee C, Han DG, Ho ML, Sierra RI. Low total body bone mineral content and high bone resorption in Korean win- ter-born versus summer-bone newborn infants. J Pediatr 1998; 132:
421-5.
22. Namgung R, Tsang RC, Specker BL, Sierra RI, Ho ML. Reduced serum osteoclcin and 1,25-dihydroxyvitamin D concent in small for gestational age infants: evidence of decreased bone formation rates.
J Pediatr 1993; 122: 269-75.
23. Park MJ, Namgung R, Kim DH, Tsang RC. Bone mineral content is not reduced despite low vitamin D status in breast milk-fed infants versus cow’s milk based formula-fed infants. J Pediatr 1998; 132:
641-5.
24. Challa A, Ntourntoufi A, Cholevas V, Bitsori M, Galanakis E, An- deronikou A. Breastfeeding and vitamin D status in Greece during the first 6 months of life. Eur J Pediatr 2005; 164: 724-9.
25. Hollis BW, Roos BA, Draper HH, Lambert PW. Vitamin D and its metabolites in human and bovine milk. J Nutr 1981; 111: 1240-8.
26. Institute of Medicine, Food and Nutrition Board, standing Committee on the Scientific Evaluation of Dietary Reference Intakes. Vitamin D In: Dietary reference intakes for calcium, phosphorus, magnesium, vitamin D and fluoride. Washington, DC: National Academy Press 1997; 250-87.
27. Mannion CA, Gray-Donald K, Koski KG. Association of low intake of milk and vitamin D during pregnancy with decreased birth weight.
CMAJ 2006; 174: 1273-7.
28. Statement of the Joint Working Group. Nutrition for healthy infants.
Statement of the Joint Working Group: Canadian Pediatric Society, Dieticians of Canada, Health Canada. Ottawa: Health Canada; 1998.
29. Belachew T, Nida H, Getaneh T, Woldemariam D, Getinet W. Cal- cium deficiency and causation of rickets in Ethiopian children. East Afr Med J 2005; 82: 153-9.