광원의 종류, 주기와 세기의 변화에 따른 ‘신홍쌈’ 배추 내 글루코시놀레이트 함량
이건령1ㆍ김영진1ㆍ천진혁1ㆍ이민기1ㆍ류동기2ㆍ박수형3ㆍ정선옥2ㆍ박상언4ㆍ임용표5ㆍ김선주1*
1충남대학교 생물환경화학과, 2충남대학교 바이오시스템기계공학과, 3농촌진흥청 국립원예특작과학원, 4충남대학교 식물자원학과, 5충남대학교 원예학과
Variation of glucosinolate contents of ‘Sinhongssam’ grown under various light sources, periods, and light intensities
Geon-Ryoung Lee1, Young Jin Kim1, Jin-Hyuk Chun1, Min-Ki Lee1, Dong-Ki Ryu2, Suhyoung Park3, Sun-Ok Chung2, Sang Un Park4, Yong-Pyo Lim5, Sun-Ju Kim1*
1Department of Bio-Environmental Chemistry, Chungnam National University, Daejeon 305-764, Korea
2Department of Biosystems Machinery Engineering, Chungnam National University, Daejeon 305-764, Korea
3Department of Horticultural Crop Research, National Institute of Horticultural and Herbal Science (NIHHS), Rural Development Administration (RDA), 475 Imok-dong, Jangan-gu, Suwon 440-706, Korea
4Department of Crop Science, Chungnam National University, Daejeon 305-764, Korea
5Department of Horticultural Science, Chungnam National University, Daejeon 305-764, Korea Received on 29 May 2014, revised on 24 June 2014, accepted on 30 June 2014
Abstract : The variation of glucosinolates (GSLs) in Chinese cabbage (‘Sinhongssam’) (Brassica rapa L. spp. pekinensis) cultivated under lights to control plant growth conditions was evaluated at different development stages. Under experimental conditions in plant factory system, plant growth conditions including light, temperature, and nutrients were designed to enhance GSLs. The variation of glucosinolates (GSLs) in Chinese cabbage (‘Sinhongssam’) (Brassica rapa L. spp. pekinensis) cultivated under lights to control plant growth conditions was evaluated at different development stages. Under experimental conditions in plant factory system, plant growth conditions including light, temperature, and nutrients were designed to enhance GSLs. The contents of GSLs were quantified in Chinese cabbage according to different light sources (Red+White, RW; Red+Blue+White, RBW, Fluorescence lamp, FL) at development stages (28, 42, and 56 days after sowing, DAS) using HPLC. Nine GSLs including five aliphatic (progoitrin, sinigrin, glucoalyssin, gluconapin, and glucobrassicanapin) three indolyl (glucobrassicin, 4-methoxyglucobrassicin, and neoglucobrassicin), and one aromatic (gluconasturtiin) GSLs were identified based on peak retention time in previous results of our laboratory. GSL contents were higher in RBW (36.55) and lower in FL (15.24 µmol/g DW). Results revealed that GSL contents were higher under controlled photoperiods (20/4 h) (58.35 µmol/g DW) and controlled light intensity (160 µmol/m2/s) (34.02 µmol/g DW), respectively. Lower amount of progoitrin and comparatively higher amount of glucobrassicin and gluconasturtiin was noted in Chinese cabbage cultivated under FL light (2.38, 9.82, and 2.10) at 42 DAS, photoperiod 20/4 h (3.16, 2.52, and 1.30) at 28 DAS, and light intensity at 130 µmol/m2/s (2.28, 2.24, and 1.51 µmol/g DW) at 42 DAS. Therefore FL light, photoperiod (20/4 h), and light intensity (130 µmol/m2/s) were considered as most suitable for the enhancement of GSLs in Chinese cabbage.
Key words : HPLC analysis, light-emitting diode, plant factory, ‘Sinhongssam’
*Corresponding author: Tel: +82-42-821-6738 E-mail address: [email protected]
I. 서 론
지구상의 식물들은 태양광으로부터 빛을 흡수하여 생장 한다. 하지만 지역별로 일조시간의 차이가 있고 조사 각에
따라 광 스펙트럼이 변화하는 단점이 있어 식물 생장에 영 향을 준다(Tazawa, 1999). 오래전부터 북유럽 지역에서는 일조시간이 짧은 계절에 작물 생산량을 증대시키기 위해 노지 재배 대신 시설 재배 내에서 인공 광원으로 부족한 광을 보충하였다. 1957년 덴마크의 크리스텐센 농장에서 최초로 인공광원으로 보광 하여 새싹채소를 재배한 것으로
알려져 있다(Kim, 2009). 이 후 1960년대 미국의 제너럴일 렉트릭사에서 인공광원만을 사용한 완전 제어형 식물공장 을 최초로 개발하였고, 1970년대 일본의 히타치 중앙 연구 소 소재 식물공장 내에서 샐러드용 채소의 최적 재배조건 을 확립하여 대량생산을 가능하게 하였다(Takatsuji, 2007).
보광을 위한 인공 광원으로는 고압 나트륨등, 메탈 할라 이드등, 형광등, 백열등을 주로 사용해왔으나, 반도체 산업 의 발전으로 인해 개발된 발광 다이오드(Light Emitting Diode, LED)는 긴 내구성과 사용시간, 상대적으로 낮은 발 열과 전력소모 그리고 특정한 파장만을 방출할 수 있어 작 물 재배 연구에 이용되고 있다(Massa et al., 2008). 메탈 할라이드등은 식물 생장에 효율적이지만 발열량이 높은 단 점이 있어 특히 식물공장 시스템에서는 주로 LED가 사용되 고 있다(Brown et al., 1995). 일반적으로 700 nm 이상의 원적외선은 장일 식물의 개화를 촉진하고 마디의 신장 촉 진에 관여한다고 알려져 있다(Deitzer et al., 1979; Downs 1956; Morgan and Smith, 1979). 적색(600–700 nm)은 광합성계의 클로로필 a의 흡수파장인 680 nm에 근접하여 식물 생장에 필수적이며, 상추 재배에 있어서도 단일 적색 광에서 더 많은 잎과 줄기가 생장한고 보고되어 있다(Matsuda et al., 2004). 청색광(400–500 nm)은 작물의 굴광성에 영 향을 미치고 기공 개폐에도 관여 한다(Schwartz and Zeiger, 1984). 또한 배지에서 묘의 생장을 억제하는 것으로 보고되 어 있다(Thomas and Dickinson, 1979). Lefsrud 등 (2008)은 배추과 작물 중 케일을 다양한 파장에서 재배 하 였을 때 적색광(640 nm)에서 기능성 성분인 GSLs와 클로 로필 a 함량이 증가한다고 보고하였다.
배추[Brassica rapa L. ssp. pekinensis]는 국내에서 고 춧가루 등 양념을 하여 김치를 만들어 먹으며 높은 영양 가치와 항암효과가 주목받고 있다(Lee et al., 2013). 글루 코시놀레이트(glucosinolates, GSLs)는 배추과 채소에 많 이 함유된 이차대사산물이며 현재 약 200종의 GSLs가 알 려져 있다(Clarke, 2010). 식물체 내 GSLs는 쓴맛과 매운 향을 내며 항암효과와 곤충기피를 유발하는 등의 다양한 약학적 기능을 가지고 있다(Zhang and Talalay, 1994).
GSL중 하나인 progoitrin은 포유동물에게 갑상선종 (goiter)을 유발하는 것으로 알려져 있다. Greer(1957)는 progoitrin은 비활성 물질임을 확인하였고 myrosinase(β -thioglucoside glucohydrolase, EC 3.2.3.147)에 의해 가수 분해된 goitrin이 갑상선종을 유발하는 것을 밝혀냈
다. Goitrin은 요오드가 갑상선으로 흡수되지 않게 경쟁적 저해물질로 작용한다(Luthy et al., 1984). 따라서 요오드 가 부족한 갑상선은 호르몬을 제대로 합성하지 못하게 되 고 부족한 호르몬을 생산하기 위해 갑상선이 지속적으로 자극되어 비대해지는 증상이 나타난다. 이와 같이 가축이 GSLs을 섭취했을 때 갑상선종이나 성장저해, 간 손상 등이 나타날 수 있으나 사람이 섭취 하였을 때 나타나는 갑상선 기능저해에 대한 증거가 없고 세계적인 연구결과에 의해 GSL 흡수와 갑상선 암 발생정도는 관련이 없다고 보고되었 다(Cartea and Velasco, 2008). GSLs는 항암예방효과가 있다고 알려져 있으나 GSLs 자체로는 항암효과가 없으며, myrosinase에 의해 가수 분해된 산물에서 항암효과가 나 타난다(Hayes et al., 2007). Glucobrassicin은 myrosinase 에 의해 indole-3-carbinol과 diindolylmethane으로 분 해되어 Ah(aryl hydrocarbon)수용체와 경쟁적으로 결합 하여 T47D 유방암세포주의 활동을 저해한다고 보고되었다 (Chen et al., 1996). 이외에도 배추과 작물에 함유되어 있 는 isothiocyanate와 indole류의 섭취는 대장암, 전립선암 등의 발병률을 감소시킨다고 보고되었다(Higdon et al., 2007).
재배환경 요소 중 하나인 광은 식물의 생장 및 이차대사 산물 합성에 관여한다. Lefsrud 등(2008)은 케일에 적색 광을 조사하였을 때 GSL 함량의 증가를 확인하였고, 특정 파장의 빛이 작물의 이차대사산물의 축적에 영향을 줄 것 이라고 보고하였다. 따라서 본 실험에서는 재배환경 요소 중 하나인 광원을 이용하여 광원의 종류(Red+White, RW;
Red+Blue+White, RBW; Fluorescent, FL), 광주기(light/
dark; 12/12, 14/10, 16/8, 18/6, 20/4 h), 광세기(100, 130, 160, 190, 220 µmol/m2/s)에 따른 생장단계별 배추 (‘신홍쌈’) 내 GSL 함량 변화를 조사하였다.
II. 재료 및 방법
1. 시약
Acetonitrile(ACN)와 methanol(MeOH)은 J.T. Baker chemical Co.(New Jersey, USA)것을 사용하였다. Sodium acetate trihydrate(CH3COONa·3H2O)은 Samchun pure chemical co. Ltd.(Pyeong-taek, Korea)것을 사용하였 다. Aryl sulfatase(type H-1, EC 3.1.6.1, 100,000 units)
와 sinigrin은 Sigma-Aldrich Chemical Company(St.
Louis, MO, USA)것을 사용하였다. DEAE Sephadex A-25 는 General Electric Healthcare Bio-science(Uppsala, Sweden)것을 사용하였다.
2. 다양한 광 조건에서 ‘신홍쌈’ 배추 재배
‘신홍쌈’ 배추(아시아종묘)는 파종 직후 광원의 종류(RW, RBW, FL), 광합성광양자속 밀도(이하 광도, Photosynthetic Photon Flux Density, PPFD)(160 µmol/m2/s), 광주기 (12/12)를 조절하여 충남대학교 바이오시스템기계공학과 소재 식물공장에서 2012년 3월 9일 파종 후 14일 간격으로 수확하여 56일(days after sowing, DAS)까지 줄기를 제외 하고 잎을 수확하였다. 동결건조 하여 분말 한 뒤 추출하여 GSL 함량 분석에 사용하였다. GSL 함량이 가장 높은 광원 (RBW)을 선발하여 광주기(12/12, 14/10, 16/8, 18/6, 20/4 h)와, 광도(100, 130, 160, 190, 220 µmol/m2/s)를 달리하 여 당해 5월 18일 파종하여 14일 간격으로 가장 큰 잎 한 장을 수확하였다. 파종 후 42일까지 재배하고 이에 따른 GSL 함량 변화를 조사하였다. 식물공장 내부의 환경을 온 도는 20oC, 상대습도는 70%, 호글랜드 양액을 사용하였고 양액의 EC(Electrical Conductivity)는 2.0, pH는 5.6–6.0을 유지하였다. 작물 재배를 위해 ABS(Acrylonirile Butadiene Styrene) 수지로 제작된 트레이에는 총 15개체의 작물을 재배 할 수 있으며, 미세 분사기를 이용하여 15분간 양액을 미스트 분사 한 후, 30분간 정지하는 것을 반복하는 분무경 법을 사용여 뿌리가 호흡하는데 도움을 주었다. 광세기는 MQ-200 quantum sensor(Apogee instruments, Logan, UT, USA)를 사용하였다.
3. ‘신홍쌈’ 배추 에서 desulfo-GSL 추출
GSL 추출은 잎을 동결 건조하여 막자와 막자사발을 사 용하여 곱게 분말한 후, 2.0 mL-Eppendorf tube에 100 mg을 정량한다. 70%(v/v) methanol(70oC)을 1.5 mL 넣고 진동혼합을 하고 항온수조(70oC)에서 5분간 중탕한다. 2분 30초가 지나면 각 2.0 mL-Eppendorf tube를 꺼내어 진동 혼합하고 다시 중탕한다. 중탕 후 원심분리(12,000 rpm, 10 min, 4oC)를 하고 상층 액을 수거하여 5 mL 시험관에 넣는다. 동일한 과정을 2번 반복하여 상층 액을 합한다(총
3회 추출). 미니칼럼 충진에 필요한 DEAE Sephadex A-25 는 GSL 초순수에 충분히 녹인 다음 분액여두에 넣은 후 3차 초순수가 거의 빠져나왔을 때 sodium acetate(78 g/L) 를 넣어 H+형태로 활성화 시켜둔다. 1,000 µL pipet tip끝 을 탈지면으로 막은 미니칼럼에 DEAE Sephadex A-25(78 mg/tip)를 넣은 후 GSL 조추출물을 pasteur pipette으로 로딩 하였다. 추출물이 다 빠져나간 이후 초순수 2 mL로 잔여 불순물을 제거한다. 초순수가 다 빠져나가면 미니칼 럼 하단을 paraffin film으로 막는다. Aryl sulfatase를 초 순수(23 mg/ mL)에 녹인 뒤 75 µL을 넣고 미니칼럼 상단 을 paraffin film으로 밀봉하여 16–18시간 상온에 정치하 여 효소가 충분히 반응하도록 하여 desulfo(DS)-GSLs를 만든다. Paraffin film을 제거하고 초순수를 0.5 mL씩 3회 로딩하여 2.0 mL-Eppendorf tube에 모은 뒤, 0.45 µm hydrophilic PTFE millipore filter(13 mm i.d.)로 여과한 후 HPLC용 vial병에 넣고 HPLC 분석 전까지 냉장 보관하 였다. 각 시료들은 3반복으로 분석하였으며, 분석 결과는 Microsoft Office Excel 2007을 이용하여 DS-GSLs의 함량 평균값과 표준편차(SD, standard deviation)를 구하였다.
4. ‘신홍쌈’ 배추 내 DS-GSL의 HPLC 분석
GSL 분석은 Inertsil ODS-3 column(150 × 3.0 mm i.d., particle size 3 µm)을 장착한 Agilent 1200 series HPLC를 이용하여 분석하였고, 가드 칼럼은 Inertsil ODS-2 Carteidge Guard column E(10 × 2.0 mm i.d., particle size 5 µm, GL Science, Tokyo, Japan)을 사용하였다. 분 석 조건으로 칼럼 온도는 40oC, 검출기 파장을 227 nm, 유량을 0.2 mL/min으로 설정하였다. 자동시료주입기를 사용하여 시료를 10.0 µL주입하였다. 이동상 용매로 A(초 순수)와 B(acetonitrile)를 사용하였다. 용매 혼합 비율은 용매 B를 0분에서 7%로 시작하여 18분까지 7 → 24%로 서서히 증가 시키고 18–32분까지 24%를 유지하였으며, 32.1분부터 7%로 급격히 감소시킨 후 40분까지 7%를 유지 하였다. 외부 표준물질인 sinigin(0.1 mg/mL)도 시료와 동일한 추출 과정을 거치고 DS-sinigrin 형태로 분석된 HPLC 피크 면적과 각 성분의 면적을 비교하여 정량화하였 다. 또한 sinigrin을 기준으로 각 성분의 response factor(ISO 9167-1, 1992)를 곱하여 계산하였다.
Table 1. Growth of Chinese cabbage (‘Shinhongssam’) according to plant development stage (days after sowing) and various light source (n=3).
DAS Light source Length (cm) Fresh weight (g) Dry weight (g) Water content (%)
14 Dark 5.20±0.14 0.80±0.04 0.06±0.00 92.92±0.14
28
Red+White 8.95±0.07 4.44±0.54 0.41±0.06 90.87±0.20
Red+Blue+White 9.60±0.14 7.91±1.65 0.75±0.20 90.55±0.57
Fluorescent 8.50±0.28 3.67±0.04 0.31±0.00 91.54±0.13
42
Red+White 17.50±1.41 41.14±5.44 4.14±0.63 89.95±0.19
Red+Blue+White 19.50±1.41 53.86±13.07 5.07±1.06 90.55±0.33
Fluorescent 17.00±0.00 26.35±0.32 2.35±0.07 91.07±0.15
56
Red+White 22.50±0.71 87.00±22.76 6.82±2.21 92.22±0.50
Red+Blue+White 22.00±1.41 77.53±12.76 3.54±0.09 95.37±0.88
Fluorescent 18.00±1.41 33.14±2.56 2.58±0.31 92.22±0.32
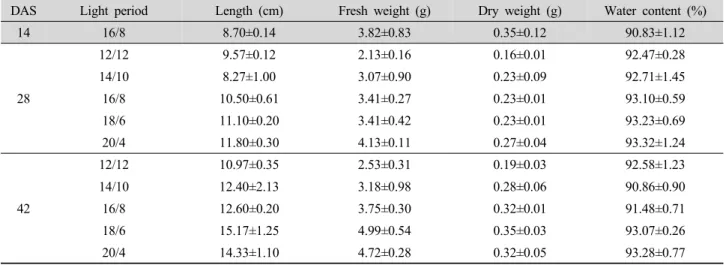
Table 2. Growth of Chinese cabbage (‘Shinhongssam’) according to plant development stage (days after sowing) and various light period (light/dark, hours) (n=3).
DAS Light period Length (cm) Fresh weight (g) Dry weight (g) Water content (%)
14 16/8 8.70±0.14 3.82±0.83 0.35±0.12 90.83±1.12
28
12/12 9.57±0.12 2.13±0.16 0.16±0.01 92.47±0.28
14/10 8.27±1.00 3.07±0.90 0.23±0.09 92.71±1.45
16/8 10.50±0.61 3.41±0.27 0.23±0.01 93.10±0.59
18/6 11.10±0.20 3.41±0.42 0.23±0.01 93.23±0.69
20/4 11.80±0.30 4.13±0.11 0.27±0.04 93.32±1.24
42
12/12 10.97±0.35 2.53±0.31 0.19±0.03 92.58±1.23
14/10 12.40±2.13 3.18±0.98 0.28±0.06 90.86±0.90
16/8 12.60±0.20 3.75±0.30 0.32±0.01 91.48±0.71
18/6 15.17±1.25 4.99±0.54 0.35±0.03 93.07±0.26
20/4 14.33±1.10 4.72±0.28 0.32±0.05 93.28±0.77
III. 결과 및 고찰
1. ‘신홍쌈’ 배추 생육, 생체중과 수분함량
광원의 종류에 따른 ‘신홍쌈’ 배추 내 생체중은 생장단계 (28, 42, 56 DAS)와 비례하여 증가하였다. 생장단계별 생 체중은 28 DAS에서 RBW(7.91), 43 DAS에서 RBW(53.86), 56 DAS에서 RW(87.00 g)가 높았다. 모든 생장단계에서 FL의 생체중(각각 3.67, 26.35, 33.14 g)이 가장 낮았다.
‘신홍쌈’ 배추 내 생체중은 56 DAS를 제외하고 RBW에서 가장 높게 나타나 청색광을 포함한 광원에서 생산량이 증 가하는 것을 확인하였다(Table 1). ‘신홍쌈’ 배추는 광주기 가 증가함에 따라 생체중도 증가하였다. 42 DAS 에서 18/6 h(4.99)가 생체 중량이 높았으며 모든 생장단계에서 광주
기가 짧은 12/12 h(2.13, 2.53 g)가 중량이 가장 낮았다 (Table 2). Timergalina 등(2007)에 의하면 광도가 증가함 에 따라 증산량과 광합성량이 증가하는 것을 보고하였다.
Burnside와 Bohning(1957)는 광도가 증가함에 따라 식물 의 광합성량은 광포화점까지 증가하고 식물의 광포화점은 식물의 생장단계에 따라 달라진다고 보고하였다. 하지만 본 실험에서 광도가 증가(100, 130, 160, 190, 220 µmol/
m2/s)함에 따라 생체중이 비례하지 않았다. 하지만 생장단 계(28, 42 DAS)에 비례하여 생체중이 증가하였다. 28 DAS 에서 220 µmol/m2/s(3.72 g)가 42 DAS에서 130 µmol/
m2/s(7.48 g)처리구의 배추가 생체중이 가장 높았다. 수분 함량은 광원, 광주기, 광도 에서 각각 평균 92, 93, 92%를 나타냈다(Table 3)(Fig. 1).
Table 3. Growth of Chinese cabbage (‘Shinhongssam’) according to plant development stage (days after sowing) and various light intensity (µmol m-2 s-1) (n=3).
DAS Light intensity Length (cm) Fresh weight (g) Dry weight (g) Water content (%)
14 160 8.70±0.14 3.82±0.83 0.35±0.12 90.83±1.12
28
100 11.53±0.31 3.47±0.28 0.22±0.04 93.61±0.55
130 10.83±0.38 3.10±0.42 0.23±0.03 92.65±1.16
160 10.50±0.61 3.41±0.27 0.23±0.01 93.10±0.59
190 10.13±0.31 3.12±0.17 0.19±0.01 93.76±0.48
220 11.50±0.30 3.72±0.73 0.27±0.04 92.74±0.34
42
100 14.17±1.12 5.07±0.28 0.40±0.07 92.19±0.89
130 16.20±2.10 7.48±2.25 0.71±0.33 90.87±2.27
160 12.60±0.20 3.75±0.30 0.32±0.01 91.48±0.71
190 13.87±2.12 4.62±1.35 0.39±0.07 91.34±1.22
220 13.33±0.93 4.16±1.13 0.31±0.10 92.71±0.37
(a) (b) (c)
Fig. 1. Fresh weight of leaves in Chinese cabbage (‘Shinhongssam’) according to plant development stages. (a), Light source; (b), light period; (c), light intensity.
2. 다양한 광조건에 따른 ‘신홍쌈’ 배추 내 GSL 함량 변화
(1) 광원의 종류에 따른 GSL 함량 변화
광원의 종류에 따른 ‘신홍쌈’ 배추 내 총 GSL 함량은 56 DAS에서 RBW(36.55) > FL(36.29) > RW(27.63 µmol/g dry weight, DW)순으로 높았고, 모든 생장단계(28, 42, 56 DAS)에서 RW(23.18, 28.73, 27.63 µmol/g DW)의 총 GSL 함량이 가장 낮았다. 총 GSL 함량은 RBW를 조사한 배추에 서 평균 28.98 µmol/g DW로 가장 높았다. Progoitrin 함 량은 56 DAS에서 RBW(4.80) > FL(3.43) > RW(2.88 µmol/g DW)순으로 높아 RBW에서 재배하는 것은 갑상선종 발생에 대한 잠재적인 위험성이 있을 것으로 판단된다(Greer, 1957).
28 DAS에서 42 DAS까지 progoitrin은 RW에서 약 0.22배
로 함량(10.93 → 2.43 µmol/g DW)이 가장 많이 감소하였 고, 42 DAS에서 56 DAS까지 RBW에서 약 1.96배로 함량 (2.45 → 4.8 µmol/g DW)이 가장 많이 증가하였다. RW에서 progoitrin은 28 DAS에서 56 DAS까지 약 0.26배 감소하 여 가장 낮은 함량(10.93 → 2.88 µmol/g DW)을 나타내었다.
Glucobrassicin은 42 DAS까지 FL에서 약 6.02배로 가장 많이 함량(1.63 → 9.82 µmol/g DW)이 증가하였다. 42 DAS에 서 56 DAS까지 FL에서 약 0.52배로 가장 많이 함량(9.82
→ 5.12 µmol/g DW)이 감소하였다. FL에서 glucobrassicin 은 28 DAS에서 56 DAS까지 약 3.14배 증가(1.63 → 5.12 µmol/g DW)하여 가장 높은 함량을 나타내었다. Gluconasturtiin 은 RW에서 28–42 DAS까지 증가(약 4.23배)하였다가 56 DAS에서 다시 감소하였다(42 DAS 대비 약 0.69배). RBW 에서 gluconasturtiin은 28 DAS에서 56 DAS까지 함량
Table 4. Total glucosinolate contents (µmol g-1 DW) in Chinese cabbage (‘Shinhongssam’) cultivated under various light source (n=3).
No. Trivial names
Light source
Dark Red+White Red+Blue+White Fluorescent
14 DAS1) 28 DAS 42 DAS 56 DAS 28 DAS 42 DAS 56 DAS 28 DAS 42 DAS 56 DAS 1 Progoitrin 2.42±0.28 10.93±5.35 2.43±0.31 2.88±2.35 10.38±7.97 2.45±0.01 4.80±1.22 7.12±3.29 2.38±0.46 3.43±0.19
2 Sinigrin ND2) 2.74±2.15 ND ND 2.70±3.22 ND ND 1.15±1.62 ND ND
3 Glucoalyssin ND 0.94±0.15 ND ND 1.30±0.40 ND 0.17±0.24 0.77±0.33 0.18±0.25 ND 4 Gluconapin ND 1.12±1.58 4.43±0.36 2.92±2.26 1.89±1.44 3.17±0.09 3.63±1.79 0.32±0.45 4.23±3.04 3.23±0.01 5 Glucobrassicanapin ND 1.08±1.52 8.15±0.85 8.65±5.86 1.62±1.01 7.70±0.64 13.15±6.05 0.43±0.61 10.09±7.34 14.33±0.03 6 Glucobrassicin 0.20±0.02 3.25±0.85 7.43±0.85 4.58±5.22 3.65±1.94 6.57±0.59 3.64±1.71 1.63±2.18 9.82±1.07 5.12±0.96 7 4-Methoxyglucobrassicin 1.30±0.21 2.15±0.51 3.74±0.38 6.47±1.56 2.03±0.14 3.36±0.17 5.96±1.47 2.65±1.44 3.75±1.02 5.42±1.70 8 Gluconasturtiin ND 0.44±0.18 1.86±0.05 1.28±1.82 0.45±0.24 1.52±0.35 2.26±1.19 0.46±0.65 2.10±0.17 2.57±1.04 9 Neoglucobrasscin ND 0.53±0.03 0.68±0.15 0.84±0.69 0.57±0.40 1.07±0.39 2.95±2.84 0.71±0.42 1.27±0.12 2.18±0.91 Total 3.92±0.09 23.18±4.06 28.73±0.33 27.63±19.75 24.58±6.43 25.83±1.46 36.55±14.07 15.24±11.00 33.81±13.47 36.29±0.43
1)DAS, days after sowing. 2)ND, not detected.
(0.45 → 1.52 → 2.26 µmol/g DW)이 점차 증가하였다.
FL의 gluconasturtiin 함량은 56 DAS에서 2.57 µmol/g DW로 가장 높았고, 28 DAS에서 56 DAS까지 함량이 가장 많이 증가(약 5.59배)하였다. FL의 생체중은 56 DAS에서 RW보다 약 2.62배 낮았지만 progoitrin 함량이 RW보다 약 1.19배 높았다. RW는 56 DAS에서 총 GSL 함량이 가장 낮았고, 또한 progoitrin의 함량(2.88)이 가장 낮았으며 glucobrassicin과 gluconasturtiin의 함량(각각 4.58, 1.28 µmol/g DW)이 가장 높았다. 따라서 RW에서 재배한 배추 가 총 GSL 함량은 낮지만 기능적으로 가치가 높을 것으로 판단된다. Yorio et al.(2001)에 의하면 적색 광에 청색광을 보광 하였을 때 식물 생장에 큰 도움이 되지만, 여전히 백색 광에서 재배효율이 높다고 보고하였다. 본 실험에서는 FL 에서 높은 총 GSL 함량에 상대적으로 낮은 progoitrin의 함량을 확인하였으나, 생체중이 낮고 크기도 작아 RW에서 재배 하는 것이 기능성 성분의 함량을 증대 시키는 재배 방법으로 판단된다(Table 4).
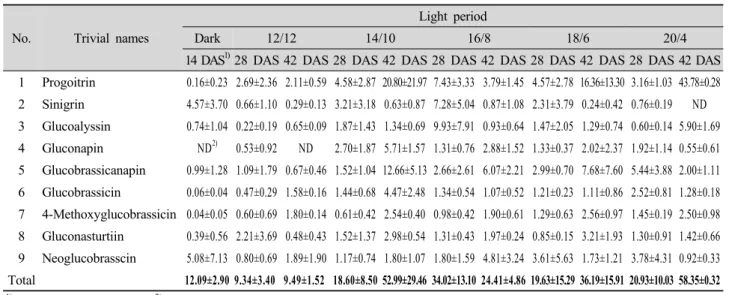
(2) 광주기의 변화 따른 GSL 함량 변화
광주기 변화에 따른 총 GSL 함량은 42 DAS에서 20/4 (58.35) > 14/10(52.99) > 18/6(36.19) > 16/8(24.41) >
12/12 h(9.49 µmol/g DW)순으로 높았다. 14/10 h에서 총 GSL 함량이 약 2.85배로 가장 많이 증가 하였고, 16/8 h에 서 0.72배로 가장 많이 감소하였고, Charron et al.(2004) 의 실험에서도 양배추의 잎의 총 GSL 함량이 24/0(7.1) >
18/6(6.7) > 12/12(6.3 µmol/g DW)순으로 나타나 광주기
변화에 따른 총 GSL 함량의 경향성이 없는 것으로 나타났 다. 본 실험에서 42 DAS에서의 progoitirin 함량은 20/4 (43.78) > 14/10(20.80) > 18/6(16.36) > 16/8(3.79) > 12/12 h(2.11 µmol/g DW)순으로 높았다. Progoitirin 함량은 42 DAS까지 14/10, 18/6, 20/4 h에서 증가(각 4.54, 3.58, 13.85배)하였고, 12/12, 16/8 h에서 감소(각 0.78, 0.51배) 하였다. 20/4 h에서 progoitrin 함량(3.16 → 43.78)이 가 장 많이 증가 하였으며, 16/8 h에서 함량(7.43 → 3.79 µmol/g DW)이 가장 많이 감소하였다. 42 DAS에서의 glu- cobrassicin 함량은 14/10(4.47) > 12/12(1.58) > 20/4(1.28) >
18/6(1.11) > 16/8(1.07 µmol/g DW)순으로 높았다. Gluco- brassicin은 12/12와 14/10 h에서 함량(각 3.36, 3.10배)이 증가하였고, 16/8, 18/6, 20/4 h에서 함량(각 0.80, 0.92, 0.51배)이 감소하였다. 42 DAS에서 14/10 h가 glucobrassicin 함량(4.47 µmol/g DW)이 가장 높았다. 42 DAS에서의 glu- conasturtiin 함량은 18/6(3.21) > 14/10(2.98) > 16/8(1.97)
> 20/4(1.42) > 12/12(0.48 µmol/g DW)순으로 높았다.
Gluconasturtiin은 42 DAS까지 18/6 h에서 함량(0.85 → 3.21)이 약 3.78배로 가장 많이 증가 하였으며, 12/12 h에 서 함량(2.21 → 0.48 µmol/g DW)이 약 0.22배 감소하였 다. 42 DAS에서 12/12 h가 가장 낮은 progoitrin 함량 (2.11)과 가장 많은 glucobrassicin 함량 증가(0.47 → 1.58 µmol/g DW)를 보였고, gluconasturtiin 함량은 감소하여 가장 낮은 함량(0.48 µmol/g DW)을 나타내었다. 가장 낮 은 progoitrin 함유율(약 22%)과 glucobrassicin과 gluco- nasturtiin의 함량비율(각각 약 17, 5%)이 상대적으로 높
Table 5. Total glucosinolate contents (µmol g-1 DW) in Chinese cabbage (‘Shinhongssam’) cultivated under various light period (light/dark, hours) (n=3).
No. Trivial names
Light period
Dark 12/12 14/10 16/8 18/6 20/4
14 DAS1)28 DAS 42 DAS 28 DAS 42 DAS 28 DAS 42 DAS 28 DAS 42 DAS 28 DAS 42 DAS 1 Progoitrin 0.16±0.23 2.69±2.36 2.11±0.59 4.58±2.87 20.80±21.97 7.43±3.33 3.79±1.45 4.57±2.78 16.36±13.30 3.16±1.03 43.78±0.28 2 Sinigrin 4.57±3.70 0.66±1.10 0.29±0.13 3.21±3.18 0.63±0.87 7.28±5.04 0.87±1.08 2.31±3.79 0.24±0.42 0.76±0.19 ND 3 Glucoalyssin 0.74±1.04 0.22±0.19 0.65±0.09 1.87±1.43 1.34±0.69 9.93±7.91 0.93±0.64 1.47±2.05 1.29±0.74 0.60±0.14 5.90±1.69 4 Gluconapin ND2) 0.53±0.92 ND 2.70±1.87 5.71±1.57 1.31±0.76 2.88±1.52 1.33±0.37 2.02±2.37 1.92±1.14 0.55±0.61 5 Glucobrassicanapin 0.99±1.28 1.09±1.79 0.67±0.46 1.52±1.04 12.66±5.13 2.66±2.61 6.07±2.21 2.99±0.70 7.68±7.60 5.44±3.88 2.00±1.11 6 Glucobrassicin 0.06±0.04 0.47±0.29 1.58±0.16 1.44±0.68 4.47±2.48 1.34±0.54 1.07±0.52 1.21±0.23 1.11±0.86 2.52±0.81 1.28±0.18 7 4-Methoxyglucobrassicin 0.04±0.05 0.60±0.69 1.80±0.14 0.61±0.42 2.54±0.40 0.98±0.42 1.90±0.61 1.29±0.63 2.56±0.97 1.45±0.19 2.50±0.98 8 Gluconasturtiin 0.39±0.56 2.21±3.69 0.48±0.43 1.52±1.37 2.98±0.54 1.31±0.43 1.97±0.24 0.85±0.15 3.21±1.93 1.30±0.91 1.42±0.66 9 Neoglucobrasscin 5.08±7.13 0.80±0.69 1.89±1.90 1.17±0.74 1.80±1.07 1.80±1.59 4.81±3.24 3.61±5.63 1.73±1.21 3.78±4.31 0.92±0.33 Total 12.09±2.90 9.34±3.40 9.49±1.52 18.60±8.50 52.99±29.46 34.02±13.10 24.41±4.86 19.63±15.29 36.19±15.91 20.93±10.03 58.35±0.32
1)DAS, days after sowing. 2)ND, not detected.
Table 6. Total glucosinolate contents (µmol g-1 DW) in Chinese cabbage (‘Shinhongssam’) cultivated under various light intensity (µmol m-2 s-1) (n=3).
No. Trivial names
Light intensity
Dark 100 130 160 190 220
14 DAS1)28 DAS 42 DAS 28 DAS 42 DAS 28 DAS 42 DAS 28 DAS 42 DAS 28 DAS 42 DAS 1 Progoitrin 0.16±0.23 5.93±6.34 4.22±0.60 4.21±2.75 2.28±0.50 7.43±3.33 3.79±1.45 2.27±0.78 3.36±0.35 2.88±0.64 6.93±1.91 2 Sinigrin 4.57±3.70 0.45±0.46 2.68±2.61 0.12±0.16 0.43±0.15 7.28±5.04 0.87±1.08 0.50±0.31 0.86±0.85 0.35±0.16 0.17±0.30 3 Glucoalyssin 0.74±1.04 5.35±8.30 2.05±1.73 4.14±5.59 0.91±0.14 9.93±7.91 0.93±0.64 0.86±0.62 0.82±0.41 0.56±0.09 1.75±0.92 4 Gluconapin ND2) 0.64±0.53 0.88±0.70 1.91±1.31 0.67±0.52 1.31±0.76 2.88±1.52 0.21±0.20 2.14±1.15 1.81±0.16 0.19±0.11 5 Glucobrassicanapin 0.99±1.28 2.37±1.41 2.80±1.55 4.31±2.23 1.73±0.93 2.66±2.61 6.07±2.21 0.99±0.29 5.22±2.36 6.30±1.22 2.90±2.77 6 Glucobrassicin 0.06±0.04 0.75±0.67 1.71±0.82 1.49±0.16 2.24±0.82 1.34±0.54 1.07±0.52 0.10±0.17 1.11±0.53 0.07±0.13 0.86±0.33 7 4-Methoxyglucobrassicin 0.04±0.05 1.32±0.41 2.83±1.05 1.86±0.39 3.53±1.31 0.98±0.42 1.90±0.61 0.93±0.10 2.10±0.20 1.31±0.43 2.40±0.57 8 Gluconasturtiin 0.39±0.56 1.06±0.69 1.47±0.68 1.07±0.26 1.51±0.55 1.31±0.43 1.97±0.24 1.42±0.26 1.43±0.37 2.08±0.41 0.93±0.35 9 Neoglucobrasscin 5.08±7.13 1.40±1.33 6.18±5.14 1.04±0.88 1.90±0.92 1.80±1.59 4.81±3.24 1.47±0.37 1.48±0.21 4.32±2.95 1.89±1.97 Total 12.09±2.90 19.25±12.84 24.84±5.43 20.15±4.34 15.41±2.73 34.02±13.10 24.41±4.86 8.74±1.91 18.52±2.50 19.70±4.62 18.02±6.28
1)DAS, days after sowing. 2)ND, not detected.
았다. 따라서 12/12 h 조건 하에서 재배 하였을 때 기능성 성분이 높은 것으로 판단된다(Table 5).
(3) 광세기의 변화 따른 GSL 함량 변화
광세기 변화에 따른 총 GSL 함량은 42 DAS에서 100(24.84)
> 160(24.41) > 190(18.52) > 220(18.02) > 130 µmol/m2/s(15.41 µmol/g DW)순으로 높아 광세기 변화에 따른 총 GSL 함량 의 경향성을 보이지 않았으나, Charron et al.(2004)은 양 배추 잎의 총 GSL 함량이 200(8.4) > 300(7.1) > 400 µmol/m2/s(6.7 µmol/g DW)순으로 광세기가 약할수록 총
GSL 함량이 증가된다고 보고하였다. 본 실험에서 42 DAS 까지 190에서 총 GSL함량이 2.12배로 가장 많이 증가 하였 으며, 160µmol/m2/s에서 0.72배로 가장 많이 감소하였다.
42 DAS에서의 progoitirin 함량은 220(6.93) > 100(4.22)
> 160(3.79) > 190(3.36) > 130 µmol/m2/s(2.28 µmol/g DW)순으로 높았다. Progoitrin 함량은 42 DAS까지 190, 220 µmol/m2/s에서 증가(각 1.48, 2.41배) 하였으며, 100, 130, 160 µmol/m2/s에서 감소(각 0.71, 0.54, 0.51배) 하 였다. 42 DAS까지 220 µmol/m2/s에서 가장 높은 progoitrin 함량(6.93)을 나타내었으며, 130 µmol/m2/s에서 가장 낮
은 함량(2.28 µmol/g DW)을 나타내었다. 42 DAS에서의 glucobrassicin 함량은 130(2.24) > 100(1.71) > 190(1.11)
> 160(1.07) > 220 µmol/m2/s(0.86 µmol/g DW)순으로 높 았다. Glucobrassicin 함량은 28 DAS에서 42 DAS까지 모 든 광세기 에서 증가하였다. 130 µmol/m2/s에서 약 1.5배 증가하여 가장 높은 glucobrassicin 함량(2.24 µmol/g DW)을 나타내었으며, 220 µmol/m2/s에서 약 1.83배 증가 하여 가장 낮은 함량(0.86 µmol/g DW)을 나타내었다. 28 DAS에서 42 DAS까지 gluconasturtiin은 220 µmol/m2/s 에서 감소(약 0.45배)하여 가장 낮은 함량(0.93)을 나타내 었으며, 160 µmol/m2/s에서 약 1.5배로 가장 많이 증가하 여 가장 높은 함량(1.97 µmol/g DW)을 나타내었다. 42 DAS에서 가장 높은 총 GSL 함량을 나타낸 100 µmol/m2/s 에서 progoitrin 함량비율(17%)이 높고 상대적으로 낮은 glucobrassicin과 gluconasturtiin 함량비율(각 7과 6%) 을 나타내었다. 가장 낮은 총 GSL 함량을 나타낸 130 µmol/m2/s에서 progoitrin 함량(2.28 µmol/g DW)이 약 15%로 가장 낮은 비율을 나타내었으며, glucobrassicin 함 량(2.24)은 약 15%, gluconasturtiin 함량(1.51 µmol/g DW)이 약 10%로 가장 높았다. 또한 130 µmol/m2/s가 가장 높은 생체중을 나타냄으로써 기능성 성분의 함량을 증대시 키는 적합한 광세기로 판단된다(Table 6).
IV. 결 론
‘신홍쌈’ 배추를 식물공장에서 다양한 광조건을 조절하 여 재배한 후 생장단계별로 수확하여 GSL 함량 변화를 조 사하였다. 실험은 광원, 광주기, 광도로 나누어서 실시하였 으며 광원의 종류는 RW, RBW, FL을 사용하였다. RW에서 가축의 갑상선종을 유발하는 progoitrin의 함량(2.88)이 낮고 항암예방효과가 뛰어난 glucobrassicin과 gluconasturtiin 의 함량(각 4.58, 1.28 µmol/g DW)이 높아 고기능성 배추 재배 조건에 적합하였으나, 총 GSL 함량은 RBW(36.55 µmol/g DW)가 가장 높아 다음 실험의 광원으로 선택하였 다. 광주기에 따른 총 GSL 함량은 20/4 h(58.35 µmol/g DW)에서 가장 높았고, progoitrin이 다른 광주기에 비해 가장 높은 비율(약 75%)을 나타내어 고기능성 배추 생산에 적합하지 않다고 판단된다. 반면 12/12 h에서 가장 낮은 총 GSL 함량(9.49 µmol/g DW)을 나타내었지만 gluco- brassicin과 gluconasturtiin의 함량의 비율(16.65, 5.06%)
이 높아 기능성 성분 증대에 적합하다고 판단된다. 광도에 따른 총 GSL 함량은 100 µmol/m2/s(24.84)가 가장 높았 고, progoitrin 함량(4.22 µmol/g DW) 또한 높았다. 가장 낮은 총 GSL 함량을 나타낸 130 µmol/m2/s에서 progoitrin 의 함량(2.28 µmol/g DW)이 가장 낮고 생체중(7.48 g)이 가장 높아 고기능성과 생산성을 가진 재배 조건으로 판단 된다. 따라서 ‘신홍쌈배추’는 광원으로 RBW를 사용하고, 광주기를 20/4 h, 광도는 100 µmol/m2/s 의 조건에서 재 배하였을 때, 총 GSL 함량을 가장 높일 수 있다. 하지만 기능성 성분의 함량의 증대를 위해 progoitrin 함량비율이 높고 상대적으로 낮은 glucobrassicin과 gluconasturtiin 함량비율을 가지는 조건으로 광원은 RW, 광주기는 12/12 h, 광세기는 130 µmol/m2/s에서 재배하는 것이 가장 적합 하다고 판단된다.
감사의 글
본 연구는 농림축산식품부․해양수산부․농촌진흥청․산림 청 생명산업기술개발사업(311022-05 -3-SB020)에 의해 이루어 진 것임.
참 고 문 헌
Brown CS, Schuerger AC, Sager JC. 1995. Growth and photomorphogenesis of pepper plants grown under red light-emitting diodes supplemented with blue or far-red illumination. Journal of the American Society for Horti- cultural Science 120:808-813.
Burnside CA, Bohning RH. 1957. The Effect of Prolonged Shading on the Light Saturation Curves of Apparent Photosynthesis in Sun Plants. Plant Physiology 32:61.
Cartea ME, Velasco P. 2008. Glucosinolates in Brassica foods:
bioavailability in food and significance for human health.
Phytochemistry Reviews 7:213-229.
Charron CS, Sams CE. 2004. Glucosinolate Content and Myrosinase Activity in Rapid-cycling Brassica oleracea Grown in a Controlled Environment. Journal of the American Society for Horticultural Science 129:321-330.
Chen I, Safe S, Bjeldanes L. 1996. Indole-3-carbinol and diindolylmethane as aryl hydrocarbon (Ah) receptor agonists and antagonists in T47D human breast cancer cells. Bio- chemical pharmacology 51:1069-1076.
Clarke DB. 2010. Glucosinolates, structures and analysis in food. Analytical methods 2:310-325.
Deitzer GF, Hayes R, Jabben M. 1979. Kinetics and time dependence of the effect of far red light on the photo-
periodic induction of flowering in Wintex barley. Plant physiology 64:1015-1021.
Downs RJ. 1956. Photoreversibility of flower initiation. Plant physiology 31:279-284.
Goins GD, Yorio NC, Sanwo MM, Brown CS. 1997. Photomor- phogenesis, photosynthesis, and seed yield of wheat plants grown under red light-emitting diodes (LEDs) with and without supplemental blue lighting. Journal of experimental botany 48:1407-1413.
Greer MA. 1957. Goitrogenic substances in food. The American Journal of Clinical Nutrition 5:440–444.
Hayes JD, Kelleher MO, Eggleston IM. 2007. Anticarcinogenic effects of glucosinolate breakdown products. Dietary vitamins, polyphenols, selenium and probiotics: biomarkers of exposure and mechanisms of anticarcinogenic action. edited by Akesson B, Mercke P. pp. 140-159. Nofer Institute of Occupational Medicine. Lodz, Poland.
Higdon JV, Delage B, Williams DE, Dashwood RH. 2007.
Cruciferous vegetables and human cancer risk: epidemiologic evidence and mechanistic basis. Pharmacological Research 55:224-236.
International Standards Organization. 1992. Rapeseed: Determination of glucosinolates content - Part 1: Method using High performance liquid chromatography, ISO 9167-1: 1992. Geneva, Switzerland. pp. 1-9.
Kim JH. 2009. The trend and outlook of plant factory. Korea Rural Economic Institute. Accessed in http://imd.krei.re.kr:
8888/pdf/pdfsource/99240p.pdf.
Kim SJ, Ishii G. 2006. Glucosinolate profiles in the seeds, leaves and roots of rocket salad (Eruca sativa Mill.) and anti-oxidative activities of intact plant powder and purified 4-methoxyglucobrassicin. Soil science and plant nutrition 52:394-400.
Lee HA, Song YO, Jang MS, Han JS. 2013. Effect of Ecklonia cava on the quality Kimchi during fermentation. Journal of the Korean Society of Food Science and Nutrition 42:83-88.
Lefsrud MG, Kopsell DA, Sams CE. 2008. Irradiance from distinct wavelength light-emitting diodes affect secondary metabolites in kale. HortScience 43:2243-2244.
Luthy J, Carden B, Friederich U, Bachmann M. 1984. Goitrin a nitrosatable constituent of plant foodstuffs. Experientia 40:
452-453.
Massa GD, Kim HH, Wheeler RM, Mitchell CA. 2008. Plant productivity in response to LED lighting. HortScience 43:
1951-1956.
Matsuda RK, Ohashi-Kaneko, Fujiwara K, Goto E, Kurata K.
2004. Photosynthetic characteristics of rice leaves grown under red light with or without supplemental blue light.
Plant and Cell Physiology 45:1870-1874.
Morgan DC, Smith H. 1979. A systematic relationship between phytochrome-controlled development and species habitat, for plants grown in simulated natural irradiation. Planta 145:
253-258.
Schwartz A, Zeiger E. 1984. Metabolic energy for stomatal opening: Roles of photophosphorylation and oxidative phosphorylation. Planta 161:129-136.
Takatsuji M. 2007. Plant factory. pp. 1-3. World science publisher, Seoul, Korea.
Tazawa S. 1999. Effects of various radiant sources on plant growth (Part 1). Japan Agricultural Research Quarterly 33:
163-176.
Timergalina LN, Vysotskaya LB, Veselov SY, Kudoyarova GR.
2007. Effect of increased irradiance on the hormone content, water relations, and leaf elongation in wheat seedlings.
Russian Journal of Plant Physiology 54:633-638.
Yorio NC, Goins GD, Kagie HR, Wheeler RM, Sager JC. 2001.
Improving spinach, radish, and lettuce growth under red light- emitting diodes (LEDs) with blue light supplementation.
HortScience 36:380-383.
Zhang Y, Talalay P. 1994. Anticarcinogenic activities of organic isothiocyanates: chemistry and mechanisms. Cancer research 54:1976-1981.