1
CROP MANAGEMENT SYSTEM BASED ON HIGH SPATIAL RESOLUTION IMAGES
Seong Joon Kim
Associate Professor, Konkuk University, [email protected]
Hyung Joong Kwon
Ph.D. Candidate, Konkuk University, [email protected]
Geun Ae Park
Doctoral Student, Konkuk University, [email protected]
Mi Seon Lee
Doctoral Student, Konkuk University, [email protected]
ABSTRACT:
A crop management system was developed using Visual Basic and ArcGIS VBA. The system is operated on ArcGIS 8.3 with Microsoft Access MDB. Landsat +ETM, KOMPSAT-1 EOC, ASTER VNIR and IKONOS panchromatic (Pan) and multi-spectral (M/S) images were included in the system to understand what kind of agriculture-related information can be extracted for each images. Agriculture related data inventories using crop cover information such as texture and average pixel value of the crop based on cultivation calendar were designed and implemented. Three IKONOS images (May 25, 2001, December 25, 2001, October 23, 2003) were loaded in the system to show crop cover characteristics such as rice, pear, grape, red pepper, garlic, and surface water cover of reservoir with field surveys. GIS layers such as DEM (Digital Elevation Model), stream, road, soil, land use and administration boundary were also supplied and can be overlaid with images to enhance the understanding the general agricultural characteristics and identifying the location easily.
KEY WORDS: Crop management system, ArcGIS VBA, Agriculture-related information
1.
INTRODUCTION
All manuscripts, except Invited Papers, submitted in hard copy or electronically are limited to a size of no more than four (4) single-spaced pages (A4 size) in the printed version. For the printed version, the font type Times New Roman with a size of ten (10) points is to be used. A crop is a plant domesticated for use in agriculture.
The practice of agriculture is known as farming, while scientists, inventors and others devoted to improving farming methods and implements are also said to be engaged in agriculture. The development of digital information technologies has had a significant impact on both agriculture and crop management. Many information system applications have been used to facilitate the process of agriculture and crop management. As a consequence, precision farming or precision agriculture, which is an agricultural concept relying on the existence
of in-field variability, was intorduced. It requires the use of new technologies, such as global positioning system (GPS), sensors, satellites or aerial images, and information management tools (GIS) to assess and understand variations.
In the past, some tools have been dramatically developed for visualization and information representation to provide agricultural information, particularly through GIS technology with software packages such as ArcView and GeoMedia. However, they are largely concerned with supporting the static data, rather than providing a template for supporting decision and managing the crops. Due to the complexity of data types, the variety of users, and the need to synthesize data in the farming process, this problem is more obvious.
The very high satellite resolution imagery such as
IKONOS and KOMPSAT-II (the 2nd generation of
KOMPSAT series, which has a high performance MSC
2
(Multi-Spectral Camera) with 1m resolution as a main
payload) has a potential use for farm and crop management. To provide crop information at a regional scale, regular acquisition of images for the same area is critical. Analysis of multitemporal imagery in the phenological cycle provides information on how the specific crop variables are changing through time.
The purpose of system development using high spatial resolution images and GIS data for crop management is to develop a method of setting up a GIS/RS database prototype for organizing digital data, to facilitate information management, visualization and illustration, decision-making, and project organization in the process of crop management. This GIS/RS database will benefit all the users in the process of crop management, including administrative authorities, professionals, and the public.
The research focus is on the beginning of the GIS/RS database design. It is to set up a foundation or prototype for further development.
2.
DATABASE DESIGN
Database design addresses the contents, specifications, relationships, and sources of data to be incorporated into the GIS/RS database. Data is organized by layers, coverages or themes, with each theme representing common features. Layers or themes are related with precise geographic coordinates recorded for each theme.
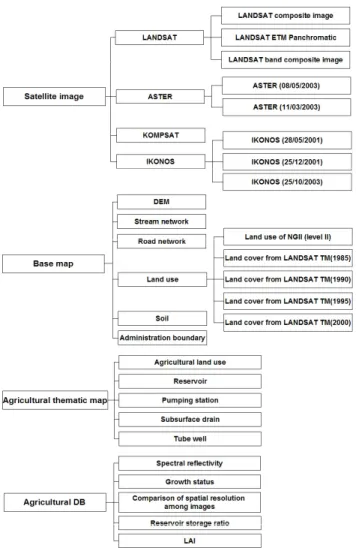
In a crop management system, 9 image layers (LANDSATs, ASTERs, KOMPSATs, IKONOSs), 10 base layers (DEM, stream & road network, the past and present land uses, soil, administration boundary) and 5 thematic layers (agricultural land use, reservoirs, pumping stations, subsurface drain, tube wells) are used to represent features of the crop related information. Five tables (spectral reflectivity, growth status, comparison of spatial resolution among images, reservoir storage ratio, LAI) are included in the database and linked to the relevant feature classes.
3.
SYSTEM IMPLEMENTATION
Getting the right software and hardware is essential for developing a system. The operating system is Windows 2000 Professional. ArcGIS 8.3 VBA and Visual Basic 6.0 for system development and Microsoft Office Access 2000 (MDB) for database management was selected.
Figure 1 and Figure 2 show the data structural tree and the menu screen for the system, respectively.
Figure 1. The data structural tree
Figure 2. The menu screen for the system
4.SUMMARY & CONCLUSION
A crop management system was designed and
implemented using ArcGIS VBA and Visual Basic. The
system is operated on ArcGIS 8.3 with Microsoft Access
MDB. Three IKONOS images (May 25, 2001, December
25, 2001, October 23, 2003) were loaded with GIS layers.
3
The system gives a clue to provide technique for
updating agriculture related GIS data, hydrologic applications coupling the agricultural land use and soil information, selection criteria of proper image for agricultural information required, data inventory of crop texture derived from high resolution images, and extraction and analysis method for agricultural related information.
4.1
References
Baumgartner, M. F., G. A. Schultz and A. I. Johnson, 1997. Remote sensing and geographic information systems for design and operation of water resources systems. Proceedings of a symposium held during the Fifth IAHS Scientific Assembly at Rabat, Morocco, April May.
Laboratory for Applications of Remote Sensing(LARS), September 2001. Remote Sensing Applicaions for Precision Agriculture. Purdue University, Indiana.
Robert J. Gilliom and Gail P. Thelin, 1997. Classification and mapping of agricultural land for national water- quality assessment. U.S. GEOLOGICAL SURVEY CIRCULAR, pp. 1131.
4.2