The Effects of Spring Kimchi Cabbage
Pre-treatment and Storage Conditions on Kimchi Quality Characteristics
Sun-Duk Cho
1, Eun-Ji Lee
1, Hye-Yeol Bang
1, Byeong-Sam Kim
2, and Gun-Hee Kim
1*1
Plant Resources Research Institute, Duksung Women's University, Seoul 01369, Korea
2
Research Group of Smart Food Distribution System, Korea Food Research Institute, Wanju 55365, Korea
*Corresponding author: [email protected]
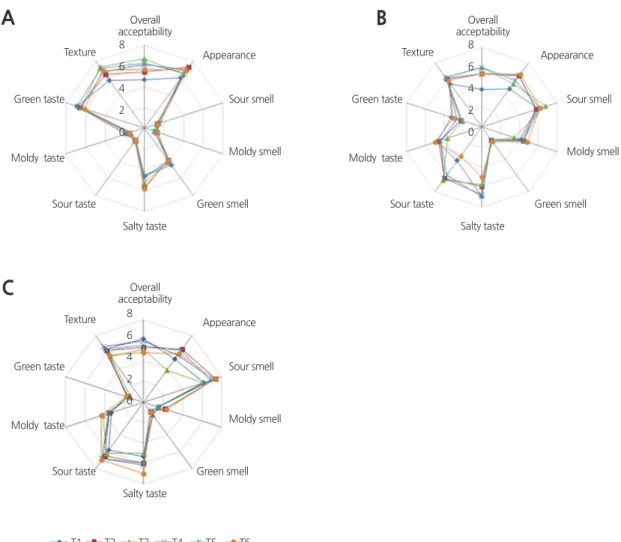
Kimchi is a widely consumed food in Korea, and the quality of the final fermented product is affected by properties of the cabbage used to produce it. The objective of this study was to determine optimal means of storing spring kimchi cabbage by analyzing kimchi produced from cabbage subjected to one of six combinations of pre-treatment and storage conditions. Kimchi quality evaluation was through sensory tests, measurement of antioxidant effects, and analysis of associated microorganisms. The kimchi produced from cabbage stored under T6 conditions (upside down orientation, pre-cooling, high density polyethylene (HDPE) film wrap, and photocatalytic storage) possessed a static pH, which implied a slow progression of ripening that was also verified in sensory tests by a low sour taste score of 3.60 and a high green taste score of 3.00. The kimchi produced from T3 cabbage (upright orientation and low-temperature storage) showed the highest consumer preference according to the sensory test results, with scores of 6.40 and 5.40 from the time of making kimchi through to the fourth week of ripening, respectively.
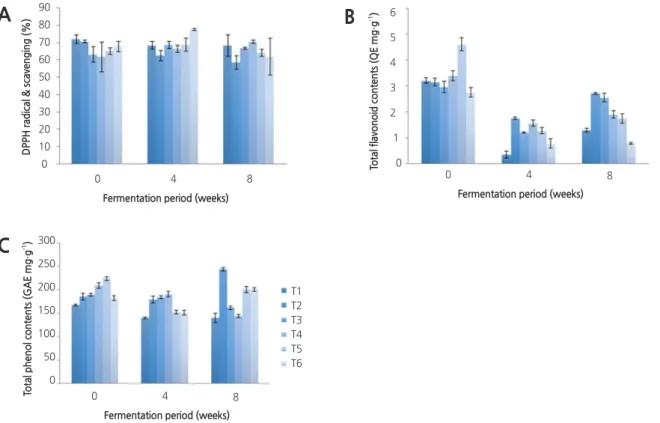
Analysis of antioxidant effects showed that the highest phenol content of 243.75 GAE mg·g
-1was in kimchi produced from T2 cabbage (upside down orientation, pre-cooling, HDPE film wrap, and plasma storage). Furthermore, both the highest flavonoid content of 70.54 QE mg·g
-1and the highest DPPH radical-scavenging activity level of 70.54% was in kimchi produced from T4 cabbage (upside down orientation, pre-cooling, HDPE film wrap, and low-temperature storage).
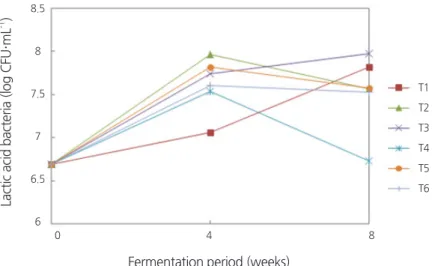
Over eight weeks of maturation, the volume of lactic acid bacteria constantly rose by 7.98 log CFU·mL
-1in kimchi produced from T3 cabbage and by 7.81 log CFU·mL
-1in kimchi produced from T1 cabbage (upright orientation and plasma storage). The results of this study indicate that the T3 cabbage storage conditions are optimal for producing high-quality kimchi.
This work was supported by Korea Institute of Planning and Evaluation for Technology in Food, Agriculture, Forestry and Fisheries (IPET) through Agri-Bio industry Technology Development Program, funded by Ministry of Agriculture, Food and Rural Affairs (MAFRA) (514002-03).
HORTICULTURAL SCIENCE and TECHNOLOGY 35(6):747-757, 2017
URL: http://www.kjhst.org pISSN : 1226-8763 eISSN : 2465-8588
This is an Open-Access article distributed under the terms of the Creative Commons Attribution NonCommercial License which permits unrestricted non-commercial use, distribution, and reproduction in any medium, provided the original work is properly cited.
Copyrightⓒ2017 Korean Society for Horticultural Science.
OPEN ACCESS Received:
Revised:
Accepted:
May 12, 2017 July 26, 2017 August 3, 2017
Abstract
Additional key words: photocatalysis, plasma, pre-cooling, quality evaluation, sensory tests
Introduction
Kimchi is a leading Korean food made with fermented vegetables . It has drawn global attention as a
health food because of its abundant lactic acid bacteria , vitamin , carotene , and acetate contents that have
outstanding anti - cancer , anti - inflammatory , and anti - mutagenic effects ( Bae et al ., 2009 ). The kimchi
cabbage (Brassica compestris L . ssp . pekinensis), one of the main ingredients for making kimchi , is a biennial leafy green of the family Cruciferae ( Jung et al ., 2009 ). Every year , two million tons of kimchi cabbage are produced in Korea , accounting for 25 % of national vegetable consumption ( Kim et al ., 2014 ). The cruciferous vegetable is rich in plant secondary metabolites such as glucosinolate , flavonoid , phenol , and sulfur compounds ( Cho et al ., 1993 ). The kimchi cabbage is particularly known for its abundant contents of antioxidative flavonols such as hydroxy benzoic acid , hydroxy cinamic acid , kaempferol , and quercetin ( Ku et al ., 2007 ). The kimchi cabbage is the fundamental ingredient , alongside white radish , scallions , and chili , to make kimchi , meaning that kimchi quality heavily depends on the variety of kimchi cabbage as well as growth time , climatic condition , cultivation method , and other environmental factors ( Lee et al ., 2008 ). The kimchi cabbage is large in size and has soft tissue , which creates difficulties for its storage and distribution . Thus , the price and supply of the kimchi cabbage vary substantially according to the season ( Han et al ., 2000 ). In the past , most kimchi was made with kimchi cabbage available in November . However , in current times , advanced breeding technology has made kimchi cabbage available to the market year round . The quality and processing suitability of kimchi cabbage are affected not only by the specific variety and genetic factors , but also by pre - harvest variables such as soil quality and time of cultivation and by post - harvest factors such as storage period and conditions . Subsequently , these same factors greatly influence the quality of kimchi made from the kimchi cabbage ( Lee et al ., 2013 ). The diversification of dietary choices resulting from recent social changes in Korea has increased the number of consumers purchasing kimchi cabbage regardless of season . The growth of kimchi export markets has also boosted the use of spring kimchi cabbage , because kimchi manufacturers need to sustain production year round . However , there is still a poor understanding of how properties of spring kimchi cabbage affect the quality characteristics of kimchi ( Cho et al ., 2016 ).
Therefore , the objective of this study was to establish optimal conditions for storing spring kimchi cabbage by analyzing kimchi made from cabbages that had been through various pre - treatment and storage conditions .
Materials and methods
Experimental Materials and Kimchi Production
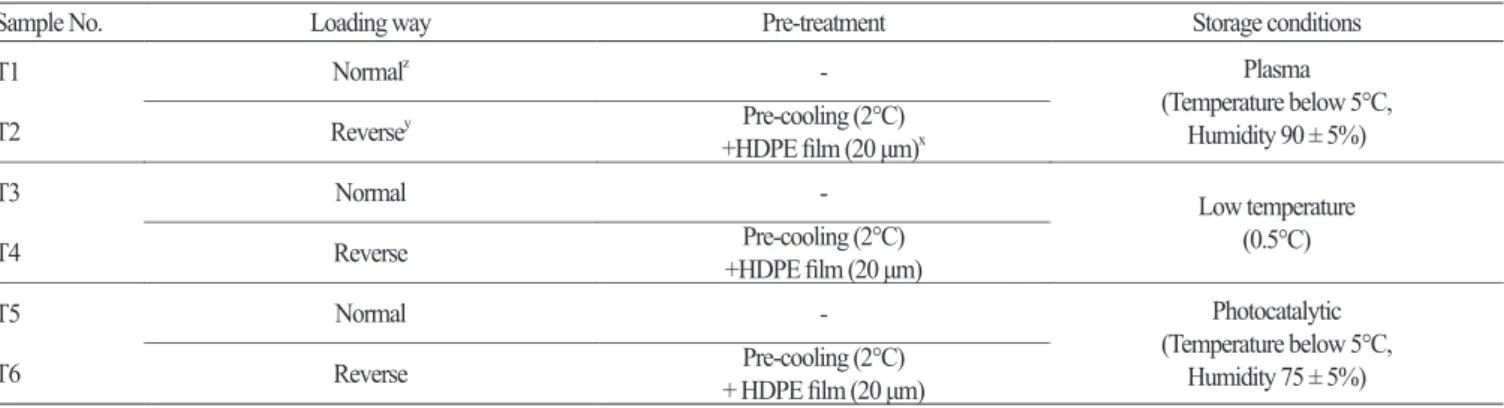
The spring kimchi cabbage ‘ Chunkwang ’ used in these experiments was sourced from a kimchi cabbage – growing district ( Pyeongchang ) where a certain quantity can be supplied , pretreated , and stored in early July . Immediately after the harvest , kimchi cabbage were treated and stored following one of six regimes , as described in Table 1 . Specifically , kimchi cabbage was placed in plastic containers ( 55 × 37 × 32 cm ) either in an upright or upside down orientation . Containers containing upside down cabbages were pre - cooled at 2 ° C and covered with HDPE film ( 20 mm ) to prevent water loss . Cabbages were then placed in either plasma curing storage ( temperature below 5 ° C , humidity 90 ± 5 %; Water Link Co ., Gyeonggi , Korea ), low temperature storage ( 0 . 5 ° C ), or photocatalytic storage ( temperature below 5 ° C , humidity 75 ± 5 %; Wizfresh Co ., Seoul , Korea ) to maintain freshness and prevent disease .
Prior to conducting the experiments , the kimchi cabbage was stored in the various conditions for six weeks at a storeroom
within the shipment control facilities of Daegwallyeong Horticultural Nonghyup . Each kimchi cabbage was cut in half , soaked
in brine with 15 % salt ( Solar Salt , Shinan , Korea ) content for 17 hours , washed three times , and dried for two hours . Following
this , seasoning was made by mixing 4 . 5 g of red pepper powder ( Sun Dried Red Pepper , Goesan ), 2 . 0 g of garlic ( Seosan ), 1 . 0 g
of ginger ( Seosan ), 5 . 0 mL of anchovy sauce ( CJ Cheiljedang , Korea ), and 0 . 5 g of white sugar ( Beksul , Korea ) per 100 g of salted
kimchi cabbage , which was according to the recipe for general kimchi seasoning of the Rural Development Administration . In addition , 10 g of white radish ( Jeju ) and 5 g of onions ( Muan ) were ground and added to the seasoned kimchi cabbage ( RDA , 2013 ). The final kimchi product was sealed in vacuum - packed polyethylene bags ( 200 × 300 × 55 mm ) and allowed to ripen at 4 ° C for eight weeks . In the meantime , experiments were carried out that analyzed the differences between each kimchi type regarding quality and sensual properties .
Quality Characteristics
Trimming loss rate and yields of salted kimchi cabbage and kimchi
To maintain the freshness of spring Kimchi cabbage and tap the possibility of commercializing kimchi , we calculated a trimming loss rate by measuring the weights of original kimchi cabbage and kimchi cabbage whose unusable outer leaves were removed because they were too dry or rotten . In addition , the weights of salted kimchi cabbage and kimchi were measured using the measurement method commonly used by kimchi manufacturers to determine each sample ’ s potential for becoming quality kimchi . Then the weight of salted kimchi cabbage was converted against that measured after selection into a percentage to calculate the yield of salted kimchi cabbage . For the yield of kimchi , we converted the total weight of kimchi against that of raw materials into a percentage as shown below .
Weight of raw materials - Weight measured after selection
Trimming loss rate (%) = × 100
Weight of raw materials
Weight of salted kimchi cabbage Yield of salted kimchi cabbage (%) = Weight measured after selection × 100
Weight of kimchi
Yield of kimchi (%) = Weight × of raw materials 100
Sample No. Loading way Pre-treatment Storage conditions
T1 Normal
z- Plasma
(Temperature below 5°C, Humidity 90 ± 5%)
T2 Reverse
yPre-cooling (2°C)
+HDPE film (20 μm)
xT3 Normal - Low temperature
(0.5°C)
T4 Reverse Pre-cooling (2°C)
+HDPE film (20 μm)
T5 Normal - Photocatalytic
(Temperature below 5°C, Humidity 75 ± 5%)
T6 Reverse Pre-cooling (2°C)
+ HDPE film (20 μm)
z
Placing cabbages in plastic containers (55 × 37 × 32 cm) by making their roots face downward.
y
Placing cabbages in plastic containers (55 × 37 × 32 cm) by making their roots face upward.
x
Packing the containers in pallets by using 20 μm HDPE film with micro orifices at 10 mm intervals, and pre-cooling at 2°C.
Table 1. Pre-treatment processes and storage conditions of spring Kimchi cabbage after the harvest
Measurement of pH, salinity and hardness
We took approximately 100 g of samples from each kimchi stored for various periods and made juice with juicer ( Do9901 , Dongaoscar , Korea ) to measure pH and salinity . The pH was measured by an automatic titrator ( Titroline easy , SchottInstruments , Mainz , Germany ) at room temperature , whereas a digital salimeter ( SB - 2000 , Gimisanggung , Korea ) was used to measure salinity . The hardness of kimchi was gauged by cutting off the seventh leaf from the outer leaves and measuring the thickest part of the stem , which is 5 cm away from its dwarf stem , by using a texture analyzer ( TAplus 2006 , LLOYD Instruments , USA ). At this point , the probe used a crisp fracture support rig and the measurement was performed at a test speed of 60 mm · min
-1and trigger of 0 . 5 N ( Lee , 2004 ).
Sensory Evaluation
For the sensory evaluation of kimchi , 10 evaluators under age 40 were invited to form a panel . After explaining the purpose of the tests to them , the kimchi was evaluated for appearance , texture , flavor , and overall acceptability based on a nine - point hedonic scale ( Kim et al ., 2014 ).
Analysis of Antioxidant Activity DPPH radical-scavenging activity
To measure the 1 , 1 - Diphenyl - 2 - picrylhydrazyl ( DPPH ) radical - scavenging activity of each extract , we slightly altered Blois ’ s method ( Blois , 1958 ). The experiment was performed by mixing a 0 . 2 mM DPPH solution ( Sigma Chemical Co ., St . Louis , MO , USA ) with individual samples of various concentrations , waiting for 25 minutes and measuring their absorbance at 515 nm . As a result , the samples showed activity in radical removal compared to those with no solution added . The experiment on DPPH radical - scavenging activity was conducted three times and suggested an average value through the following formula .
A - B
% DPPH = A × 100
A : Absorbance of the control B : Absorbance of the sample
Measuring total phenol content
To measure total phenol content , we followed the Folin - Denis method by mixing each extract ( 50 μL ) with 300 μL of folin reagent , exposing the extracts to room temperature for 3 min , adding 150 μL of 2 % Na
2CO
3to make them react at room temperature for two hours and measuring their absorbance at 760 nm . Gallic acid was used as a standard reference material and total phenol content was calculated from the calibration curve obtained through the same method for analyzing the specimens . This experiment was conducted three times to formulate an average value .
Measuring total flavonoid content
We followed the Davis method to measure total flavonoid content . Each sample solution ( 0 . 1 mL ) was mixed with 1 mL of
diethylene glycol and 0 . 1 mL of 1 N NaOH . The samples were exposed to a temperature of 30 ° C for 60 minutes and their
absorbance was measured at 420 nm . Quercetin was used as a standard reference material and total flavonoid content was calculated from the calibration curve obtained through the same method for analyzing the samples . This experiment was conducted three times to calculate an average value .
Quality Characteristics of Microorganisms
We applied 0 . 85 % NaCl sterile water to 10 g of the sample that combined the inner and outer leaves of kimchi . The total volume of the sterile water had to be 100 mL to become 1 : 10 w / v compared to the sample . Then a homogenizer was used to homogenize the sterile water whose homogenate was diluted 10 times at each phase and smeared on 3 m badges . After the inoculation , the sample was incubated at 37 ° C for 36 hours and colonies were counted . The number of detected lactic acid bacteria was expressed by the log colony forming unit per milliliter of sample .
Statistical Analyses
All experiments except those for measuring the loss rate and yields were repeated in triplicate to calculate average values and standard deviations . Each measured value went through the analysis of variance ( ANOVA ) using the SPSS Win program ( Version 19 . 0 , Chicago , IL , USA ), which was then verified by Duncan ’ s multiple range test where p < 0 . 05 .
Results
Trimming Loss Rate and Yields of Salted Kimchi cabbage and Kimchi
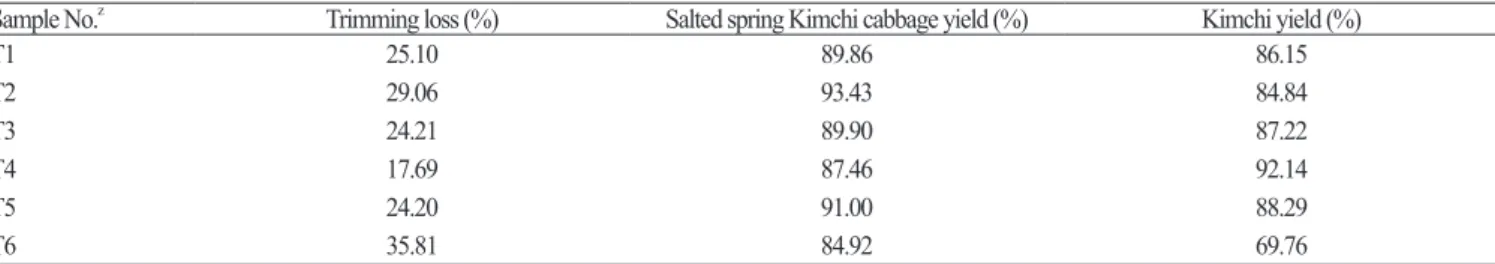
Pepper spot is a physiological disorder that affects the white midrib tissues of spring Kimchi cabbage . The first symptoms of pepper spots are small , dark , circular or elongated spots that first appear on the white midribs of the outer leaves and then spread to the middle inner leaves . Spots develop on both outer and inner surfaces of leaves ( Studistill et al ., 2007 ). Table 2 shows the results of trimming loss rate and yields of salted kimchi cabbage and kimchi for each combination of pre - treatment and storage conditions . The trimming loss rate among treated material ranged between 17 . 69 % and 35 . 81 %. For the T2 , T4 , and T6 cabbage , which were packed upside down , received a pre - cooling treatment , and were covered by HDPE film , subsequent low temperature storage of T4 cabbage resulted in a trimming loss rate of 17 . 69 %, which was substantially lower than the trimming loss rates from T2 ( 29 . 06 %) and T6 ( 35 . 81 %) cabbage that were stored under plasma and photocatalytic conditions , respectively . All treatments resulted in satisfactory yields of salted kimchi cabbage of over 80 %. The yield of
Sample No.
zTrimming loss (%) Salted spring Kimchi cabbage yield (%) Kimchi yield (%)
T1 25.10 89.86 86.15
T2 29.06 93.43 84.84
T3 24.21 89.90 87.22
T4 17.69 87.46 92.14
T5 24.20 91.00 88.29
T6 35.81 84.92 69.76
z
Abbreviations are same as in Table 1.
Table 2. Trimming loss, salted spring kimchi cabbage yield and kimchi yield of spring kimchi cabbage following different pretreatment processes
and storage conditions
kimchi , affected by the trimming loss rate , ranged widely from 69 . 76 % to 92 . 14 %. The yield of kimchi was in inverse proportion to the trimming loss rate , as reflected by the yield of kimchi from T4 cabbage ( 92 . 14 %), which was approximately 20 % higher than that from T6 cabbage ( 69 . 76 %).
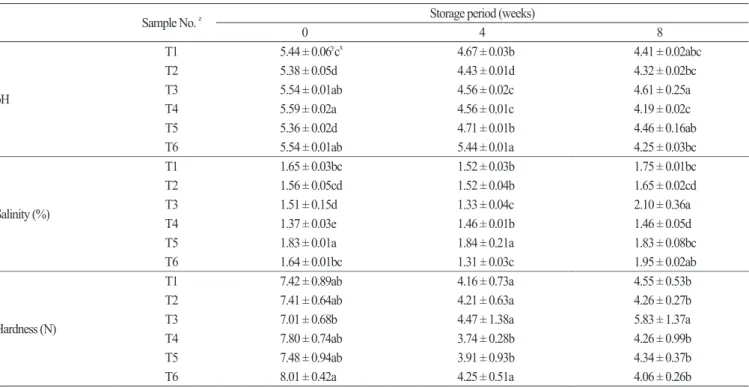
Kimchi pH, Salinity, and Hardness
A change in pH is a significant indicator of the degree of kimchi ripening ( Cho et al ., 2016 ), with kimchi at pH 4 . 2 - 4 . 6 with a lactic acid content of 0 . 50 - 0 . 75 % considered to be at optimum maturity . Kimchi produced from all treated material was ripened at 4 ° C over eight weeks , and the pH values , salinity , and hardness were measured following various ripening periods ( Table 3 ) . The pH prior to kimchi ripening was 5 . 36 - 5 . 59 , which decreased to 4 . 43 - 5 . 44 and 4 . 19 - 4 . 61 following four and eight weeks of ripening , respectively . Kimchi from T4 cabbage showed the largest drop in pH during ripening , and continued to ripen in the eighth week , whereas other treated cabbage produced kimchi that maintained a pH range within that of optimum maturity . Kimchi from T6 cabbage had a pH following four weeks of ripening that was considerably unchanged from that measured prior to ripening , indicating that the ripening process progressed slowly . The salinity prior to kimchi ripening was 1 . 51 - 1 . 83 %, which decreased to 1 . 31 - 1 . 84 % following four weeks of ripening and then increased to 1 . 46 - 2 . 10 % following eight weeks of ripening . The hardness of kimchi is a significant quality factor and is considered in the sensory test for evaluating kimchi texture . Hardness values prior to kimchi ripening were 7 . 01 - 8 . 01 N , with T6 cabbage producing kimchi exhibiting the highest value of 8 . 01 N .
Sample No.
zStorage period (weeks)
0 4 8
pH
T1 5.44 ± 0.06
yc
x4.67 ± 0.03b 4.41 ± 0.02abc
T2 5.38 ± 0.05d 4.43 ± 0.01d 4.32 ± 0.02bc
T3 5.54 ± 0.01ab 4.56 ± 0.02c 4.61 ± 0.25a
T4 5.59 ± 0.02a 4.56 ± 0.01c 4.19 ± 0.02c
T5 5.36 ± 0.02d 4.71 ± 0.01b 4.46 ± 0.16ab
T6 5.54 ± 0.01ab 5.44 ± 0.01a 4.25 ± 0.03bc
Salinity (%)
T1 1.65 ± 0.03bc 1.52 ± 0.03b 1.75 ± 0.01bc
T2 1.56 ± 0.05cd 1.52 ± 0.04b 1.65 ± 0.02cd
T3 1.51 ± 0.15d 1.33 ± 0.04c 2.10 ± 0.36a
T4 1.37 ± 0.03e 1.46 ± 0.01b 1.46 ± 0.05d
T5 1.83 ± 0.01a 1.84 ± 0.21a 1.83 ± 0.08bc
T6 1.64 ± 0.01bc 1.31 ± 0.03c 1.95 ± 0.02ab
Hardness (N)
T1 7.42 ± 0.89ab 4.16 ± 0.73a 4.55 ± 0.53b
T2 7.41 ± 0.64ab 4.21 ± 0.63a 4.26 ± 0.27b
T3 7.01 ± 0.68b 4.47 ± 1.38a 5.83 ± 1.37a
T4 7.80 ± 0.74ab 3.74 ± 0.28b 4.26 ± 0.99b
T5 7.48 ± 0.94ab 3.91 ± 0.93b 4.34 ± 0.37b
T6 8.01 ± 0.42a 4.25 ± 0.51a 4.06 ± 0.26b
z
Abbreviations are same as in Table 1.
y
Mean ± SD.
x