Introduction
The rotational alignment of the femoral and tibial components is closely related to the postoperative results after total knee ar
throplasty (TKA); rotational malalignment between the compo
nents may cause anterior knee pain, patellofemoral dysfunction, joint stiffness, and polyethylene wear, all of which eventually lead to poor outcomes15). Although numerous studies have examined rotational alignment in TKA, most considered only one com
ponent of the rotational alignment512) or focused on revealing specific anatomical landmarks that can be universally referenced in the larger patient population6,7,911,13,14). On the contrary, few studies4,15,16) have investigated the combined rotational alignment
Combined Rotational Alignment Change after Total Knee Arthroplasty in Different Tibial Component Designs: Implications for Optimal Tibial Component Rotational Alignment
Seung Joon Rhee, MD
1, Jae Young Cho, MD
2, Seung Hyeon Jeung, MD
1, Kein Boon Poon, MD
3, Yoon Young Choi, MD
4, and Jeung Tak Suh, MD, PhD
11Department of Orthopedic Surgery, Biomedical Research Institute, Pusan National University Hospital, Busan; 2Department of Orthopedic Surgery, Haeundae Bumin Hospital, Busan, Korea; 3Department of Orthopedic Surgery, Sengkang General Hospital, Singapore; 4Department of Diagnostic Radiology, Pusan National University Yangsan Hospital, Yangsan, Korea
Purpose: The rotational alignment of the femoral and tibial components is closely related to the results after total knee arthroplasty (TKA). In this study, we measured the combined rotational alignment change (ΔCR) after TKA and compared the different influence of symmetric and asymmetric tibial component designs on the combined rotational alignment.
Materials and Methods: Eightyfour patients (mean age, 67.9 years) were included. A symmetric tibial component was used in 51 knees (group I), whereas an asymmetric tibial component was used in 50 knees (group II). We measured the angles of four anatomical landmarks by using preoperative and postoperative computed tomography images. The combined rotational alignment and the amount of change were calculated. The correlation between the isolated tibial component rotation (ITR) and ΔCR was analyzed by using the Spearman correlation coefficient.
Results: The mean ΔCR was –0.1°±6.3° in group I and –4.8°±5.7° in group II after TKA. Excluding the intercomponent rotation, the change was –1.0°±7.3° and –6.7°±6.7° in group I and group II, respectively. A correlation analysis between the ITR and tibial component rotation relative to the tibial tuberosity showed a statistically significant correlation.
Conclusions: The combined lower limb rotational alignment was internally rotated in both symmetric and asymmetric tibial component designs after TKA. The asymmetric tibial component was better than the symmetric tibial component in achieving internally rotated combined lower limb rotational alignment. The internal rotation of the symmetric tibial component relative to the tibial tuberosity tip should fall within 20° to correct the externally deformed lower limb.
Keywords: Knee, Tibia, Arthroplasty, Rotation pISSN 2234-0726 · eISSN 2234-2451
Knee Surgery & Related Research
Received July 5, 2017; Revised (1st) November 3, 2017;
(2nd) December 1, 2017; Accepted December 22, 2017 Correspondence to: Seung Joon Rhee, MD
Department of Orthopaedic Surgery, Pusan National University Hospital, 179 Gudeokro, Seogu, Busan 49241, Korea
Tel: +82512407248, Fax: +82512478395 Email: [email protected]
Source of funding: This work was supported by clinical research grant from Pusan National University Hospital in 2017.
74
This is an Open Access article distributed under the terms of the Creative Commons Attribution NonCommercial License (http://creativecommons.org/licenses/bync/4.0/) which permits unrestricted noncommercial use, distribution, and reproduction in any medium, provided the original work is properly cited.
Copyright © 2018 KOREAN KNEE SOCIETY www.jksrr.org
in TKA. The lower extremity rotational alignment is determined by three components: 1) femoral anteversion, internal rotation of the distal femur relative to the femoral neck along the entire femoral shaft; 2) knee joint articulation between the distal femur and the proximal tibia, variable rotation from person to person while maintaining congruency; and 3) tibial torsion external ro
tation of the distal tibia relative to the proximal tibia. In patients who undergo TKA, rotational alignment changes occur at three interfaces including the femoral component–femur, femoral component–tibial component, and tibial component–tibia. The combination of rotations occurring in those three interfaces determines the change in lower extremity rotational alignment after TKA. Although restoration of normal knee alignment in the coronal and axial planes is among the primary goals of TKA, rotational alignment of TKA components in the axial plane re
mains controversial due to limited reproducibility and reliability caused by high interpersonal variations of the anatomical land
marks and low recognizability of the landmarks in the operative field. To our knowledge, the relationship between the combined rotational alignment and the tibial component design has not yet been scrutinized.
The purpose of this study was to reveal the true direction and amount of combined rotational alignment change after TKA by measuring and analyzing each component of the rotational alignment. Furthermore, we compared the different influence of symmetric and asymmetric tibial component designs on the combined rotational alignment.
We hypothesized that the combined rotational alignment change after TKA will differ between the patients with a symmet
ric tibial component and an asymmetric tibial component.
Materials and Methods
A total of 171 patients (208 knees) who underwent TKA at our institution from 2013 to 2015 were recruited. Informed consent was obtained from all patients, and Institutional Review Board approval was granted for the study protocol. Knees with an extra
articular deformity caused by a fracture or osteotomy, a varus deformity >15° or a valgus deformity >5° in the coronal plane, severe flexion contracture, and absence of a complete set of computed tomography (CT) measurement data were excluded from the study. A total of 101 knees of 84 patients were ultimately included. Demographic analysis showed that there were 11 male and 73 female patients (mean age, 67.9 years; range, 52 to 85 years), and their mean preoperative lower limb mechanical align
ment was 7.8° (range, 0.9° to 15°) varus. Fiftyone knees were operated by using a NexGen Legacy Knee LPSFlex (Zimmer, Warsaw, IN, USA) implant (group I), whereas 50 knees were op
erated by using a posterior stabilized Persona Knee System (Zim
mer, group II) (Table 1).
1. Surgical Technique
Following the standard medial parapatellar approach, subperi
osteal elevation of the medial collateral ligament sleeve and me
ticulous osteophyte removal were performed. The femoral troch
lear axis and the transepicondylar axis were drawn on the distal femoral articular cartilage surface with the knee flexed to 90°.
The distal femur and proximal tibia were cut using an intramed
ullary femoral cutting guide and an extramedullary tibial cutting guide, respectively. Next, the anterior referencing femoral sizing guide was attached and external rotation angles of 3°, 5°, and 7°
were applied according to the individual femoral rotational pro
file, which was preoperatively measured by using threedimen
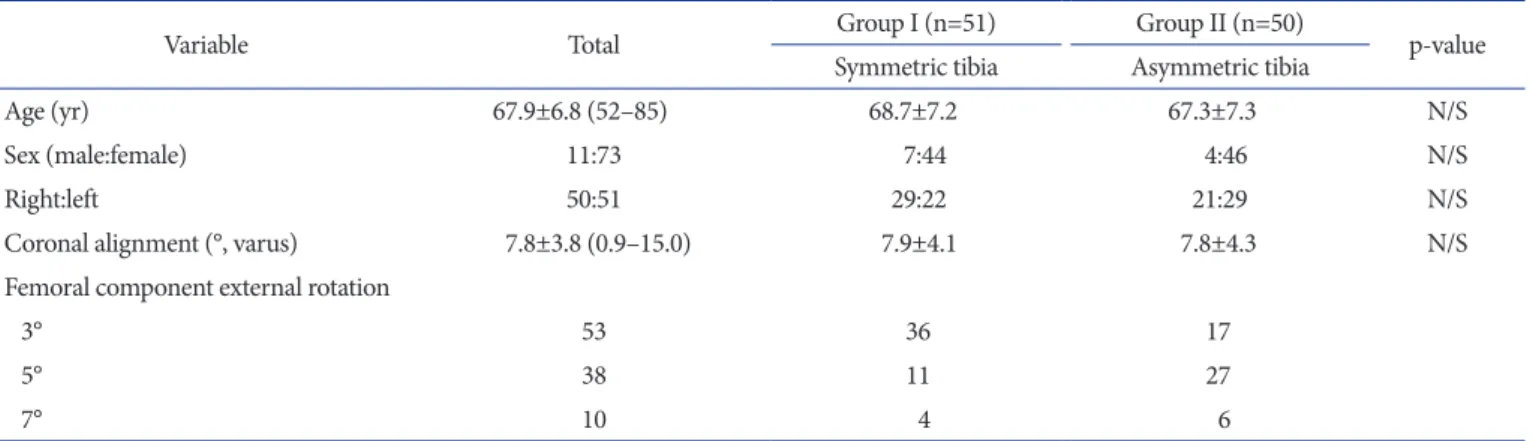
Table 1. Patient Demographics
Variable Total Group I (n=51) Group II (n=50)
pvalue Symmetric tibia Asymmetric tibia
Age (yr) 67.9±6.8 (52–85) 68.7±7.2 67.3±7.3 N/S
Sex (male:female) 11:73 7:44 4:46 N/S
Right:left 50:51 29:22 21:29 N/S
Coronal alignment (°, varus) 7.8±3.8 (0.9–15.0) 7.9±4.1 7.8±4.3 N/S
Femoral component external rotation
3° 53 36 17
5° 38 11 27
7° 10 4 6
Values are presented as mean±standard deviation (range) or number.
N/S: no significant.
sional CT as the angle between the anatomical transepicondylar axis and the femoral posterior condylar axis.
After the femoral bone cutting was complete, a spacer block was inserted in the gap between the femoral and tibial cut surfaces.
The alignment checking rod was inserted through the handle of the spacer block to reach from the femoral head center to the ankle center under fluoroscopic visualization, and the rotational position of the alignment rod was marked on the anterior border of the proximal tibia by using electrocautery. We determined the tibial component rotation at the point of maximal tibial cut sur
face coverage on the basis of the floating selfseeking technique in
90° knee flexion and full extension positions. Tibial preparation was done in a routine manner. After the bone preparation was complete, patellofemoral tracking and varus/valgus balancing were tested with all the trial components in position.
2. Radiographic Measurement
CT was performed according to a standard metal reduction protocol on a Siemens Sensation 64 (Siemens Medical Solutions USA Inc., Malvern, PA, USA) CT scanner with 0.6mm slices from the hip joint to the ankle joint preoperatively and at 2 weeks postoperatively. The knee was maintained at a flexion angle of
A B C
D E F
Fig. 1. (A) The FN was measured using two axial CT images: one with the femoral head in its largest and most rounded shape and the other with the femoral neck presenting innominate tubercle. The angle between the line drawn from the center of the femoral head to the innominate tubercle and the horizontal line was defined as FN. (B) The TMA was measured using a single axial CT image of the upper ankle joint at the syndesmosis level.
The lateral apex of the triangular fibula was easily identified and connected to the center of a line fitted to the medial edge of the medial malleolus, and the angle between the drawn line and the horizontal line was defined as TMA. (C) The aTEA is a line connecting the lateral epicondyle and the medial epicondyle, and the sTEA is a line connecting the lateral epicondyle and the medial sulcus of the medial epicondyle. The PCA is the tangential line of the posterior femoral condyles. (D) The tiblal tuberosity axis is a line connecting the tip of the tibial tubercle and the center of the oval that is sized and rotated to best fit the proximal tibia just distal to the tibial plateau using the picture archiving and communication system program (Marotech Inc.). (E) The femoral component posterior condylar axis is an angle between the PCA of the femoral component and the sTEA in the postoperative CT image. (F) The tibial component rotation angle is an angle between the tibial component anteroposterior axis and the horizontal line on the same CT image. FN: femoral neck axis, CT: computed tomography, SD: standard deviation, Min: minimum, Max: maximum, TMA: transmalleolar axis, aTEA: anatomical transepicondylar axis, sTEA: surgical transepicondylar axis, PCA: femoral posterior condylar axis.
0° by using a leg holder to minimize the motion of the lower ex
tremity. The Marosis mview 5.4 (Marotech Inc., Seoul, Korea) picture archiving and communication system program was used to measure the rotational alignment of the natural femoral and tibial anatomical landmarks and each TKA component.
Two boardcertified orthopedic surgeons and one board
certified radiologist measured the anatomical axes twice for each participant. The method of measurement was based on the Berger protocol6) except for the femoral neck axis (FN) and the transmalleolar axis (TMA), which were measured based on the Ulm protocol17). We preoperatively and postoperatively mea
sured the angles of the FN, surgical femoral transepicondylar axis (sTEA), femoral posterior condylar axis, tibial tuberosity axis (TT), and TMA relative to the horizontal line in each of the CT images (Fig. 1). On postoperative CT, femoral component rota
tion (FCR) which is the angle between the sTEA and the femoral component posterior condylar axis (FCA), angle between the tibial component anteroposterior axis (TCA) and the horizontal line, angle between the FCA and the line perpendicular to the TCA (intercomponental rotation [ICR]), and angle between the
TCA and the TT (tibial component rotation relative to the tibial tuberosity tip [TCR]) were also measured (Fig. 1). The TCA is a line perpendicular to the transverse axis of the tibial component in group I. However, in group II, a line that vertically bisects the anterior slot and the posterior Ushaped slot was considered the TCA (Table 2).
Relative angles between the axes were used to calculate the com
bined rotational alignment and enable the comparative analysis of combined rotational alignment between before and after TKA.
An angle between a specific axis in the femur and other specific axis in the tibia was defined as combined rotation (CR). The an
gles between the TMA and FN (CR1), TT and sTEA (CR2), TT and FN (CR3), and TMA and sTEA (CR4) on CT images were calculated preoperatively (preCR) and postoperatively (postCR).
The change of combined rotational alignment after versus be
fore TKA (ΔCR) was calculated by subtracting preCR from post
CR. The ΔCR1, ΔCR2, ΔCR3, and ΔCR4 values were calculated by inputting the relevant CR variables, and then adjusted by sub
tracting the ICR from the ΔCR values to exclude the influence of intercomponent rotation (Cal.ΔCR). The Cal.ΔCR assumes the state of perfect parallel alignment between the femoral and tibial components in the axial plane, and reveals the sum of the rota
tional alignment change that occurred solely in the bone–com
ponent interfaces of the femur and tibia. Subsequently, final ad
justment to exclude the influence of the FCR from the Cal.ΔCR was made. As the sTEA is widely accepted as a reliable reference axis of FCR in the coronal and axial planes610,12,18), we considered that subtracting the FCR from the Cal.ΔCR virtually assumes the state of ideal FCR. The resultant angle was defined as ITR (isolated influence of TCR in the combined rotational alignment change after TKA).
ΔCR=ICR+Cal.ΔCR Cal.ΔCR=FCR+ ITR 3. Statistical Analysis
Statistical analysis was performed with IBM SPSS ver. 21.0 (IBM Corp., Armonk, NY, USA). Reliability coefficients were obtained by using the intraclass correlation coefficient (ICC). To assess in
tra and interrater reliabilities, a twoway mixed singlemeasure consistency model was used. The MannWhitney Utest was used to compare the mean values between groups. The correla
tion between the TCR and ITR was assessed by using Spearman correlation coefficient. Statistical significance was established at p≤0.05.
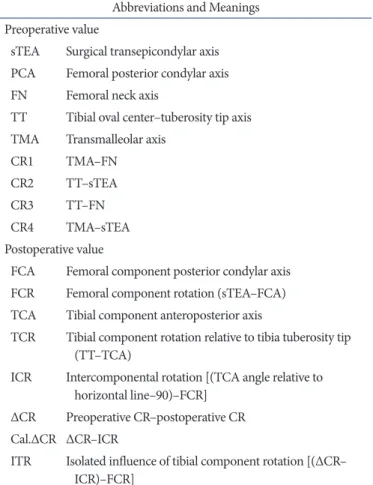
Table 2. Abbreviations of the Anatomical Axes and Relative Angles in the Order of Their Appearance
Abbreviations and Meanings Preoperative value
sTEA Surgical transepicondylar axis PCA Femoral posterior condylar axis FN Femoral neck axis
TT Tibial oval center–tuberosity tip axis TMA Transmalleolar axis
CR1 TMA–FN
CR2 TT–sTEA
CR3 TT–FN
CR4 TMA–sTEA
Postoperative value
FCA Femoral component posterior condylar axis FCR Femoral component rotation (sTEA–FCA) TCA Tibial component anteroposterior axis
TCR Tibial component rotation relative to tibia tuberosity tip (TT–TCA)
ICR Intercomponental rotation [(TCA angle relative to horizontal line–90)–FCR]
ΔCR Preoperative CR–postoperative CR Cal.ΔCR ΔCR–ICR
ITR Isolated influence of tibial component rotation [(ΔCR–
ICR)–FCR]
Results
The intrarater reliability and interrater reliability for all an
gular measurements were >0.96, which indicate high reliability, except for the tibial tuberosity angle, for which the coefficient was 0.87 (Table 3). The mean values of the preoperative combined rotational alignments and transepicondylar axis measurements of the three investigators were similar in both groups. However, the postoperative CR was smaller in group II, with especially CR2 and CR4 being statistically different. The femoral component and
tibial component were more externally rotated in group II. The mean ICR was 0.9° in group I and 1.9° in group II, which means slight external rotation of the tibial component relative to the femoral component in both groups, whereas the mean TCR was –19.3° and –12.4°, respectively, which indicates internal rotation of the TCA relative to the tip of the tibial tubercle (Table 4, Fig.
2). As the preCR and postCR values are highly variable patient
specific values, the mean values are less meaningful. However, concerning ΔCR and the associated derived values, the mean values among the patients were considered important.
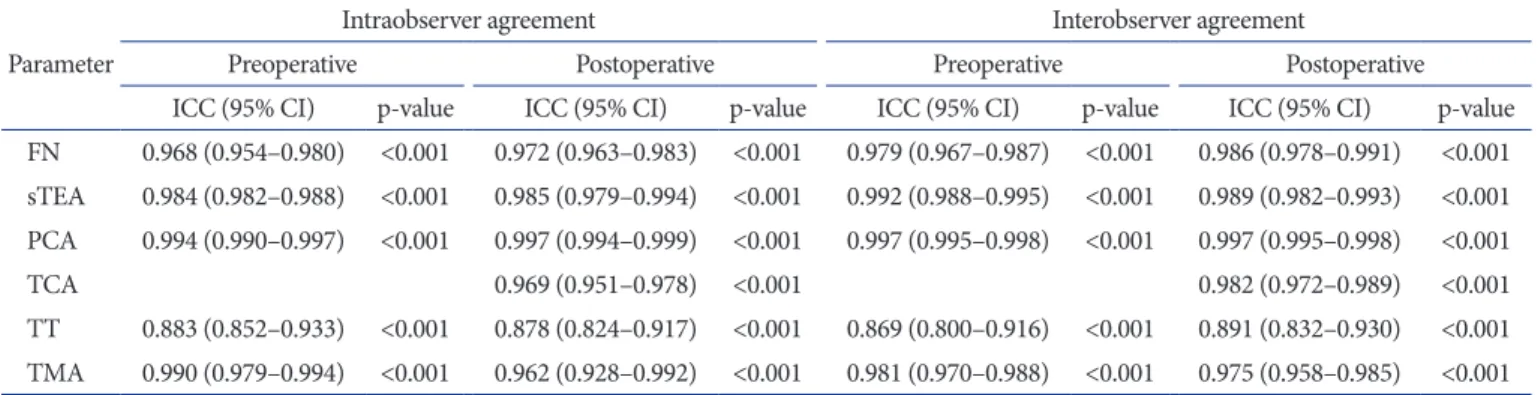
Table 3. Intraobserver and Interobserver Agreement for Preoperative and Postoperative Measurements Parameter
Intraobserver agreement Interobserver agreement
Preoperative Postoperative Preoperative Postoperative
ICC (95% CI) pvalue ICC (95% CI) pvalue ICC (95% CI) pvalue ICC (95% CI) pvalue FN 0.968 (0.954–0.980) <0.001 0.972 (0.963–0.983) <0.001 0.979 (0.967–0.987) <0.001 0.986 (0.978–0.991) <0.001 sTEA 0.984 (0.982–0.988) <0.001 0.985 (0.979–0.994) <0.001 0.992 (0.988–0.995) <0.001 0.989 (0.982–0.993) <0.001 PCA 0.994 (0.990–0.997) <0.001 0.997 (0.994–0.999) <0.001 0.997 (0.995–0.998) <0.001 0.997 (0.995–0.998) <0.001
TCA 0.969 (0.951–0.978) <0.001 0.982 (0.972–0.989) <0.001
TT 0.883 (0.852–0.933) <0.001 0.878 (0.824–0.917) <0.001 0.869 (0.800–0.916) <0.001 0.891 (0.832–0.930) <0.001 TMA 0.990 (0.979–0.994) <0.001 0.962 (0.928–0.992) <0.001 0.981 (0.970–0.988) <0.001 0.975 (0.958–0.985) <0.001 ICC: intraclass correlation coefficient, CI: confidence interval, FN: femoral neck axis, sTEA: surgical transepicondylar axis, PCA: femoral posterior condylar axis, TCA: tibial component anteroposterior axis (postoperative only), TT: tibial oval center–tuberosity tip axis, TMA: transmalleolar axis.
Table 4. Raw Measurement Data of the Combined Rotational Alignment
Variable Group I (n=51) Group II (n=50)
pvalue
Symmetric tibia (°) Asymmetric tibia (°)
Preoperative
CR1 16.9±12.2 (–19.9 to 41.1) 17.2±10.3 (–3.0 to 37.3) 0.891
CR2 109.7±7.4 (90.6 to 123.5) 109.8±6.9 (95.0 to 124.8) 0.962
CR3 101.0±9.7 (82.0 to 123.8) 102.8±10.0 (82.4 to 127.8) 0.362
CR4 25.6±8.3 (8.2 to 44.5) 24.1±9.2 (–1.4 to 46.8) 0.418
sTEA 3.0±2.1 (–3.3 to 8.9) 3.0±2.0 (–1.9 to 7.0) 0.935
Postoperative
CR1 14.5±12.2 (–12.1 to 36.5) 11.3±9.9 (–7.4 to 28.0) 0.178
CR2 110.8±6.3 (96.8 to 128.5) 106.1±5.1 (93.2 to 115.5) <0.001a)
CR3 102.3±9.4 (84.0 to 129.6) 99.7±8.6 (78.3 to 114.2) 0.141
CR4 23.3±9.2 (2.5 to 39.7) 17.7±8.1 (–2.0 to 37.5) 0.004a)
FCR 0.7±2.3 (–4.1 to 6.1) 1.9±2.8 (–2.8 to 10.2) 0.025a)
ICR 0.9±3.5 (–9.7 to 6.7) 1.9±3.2 (–6.2 to 8.3) 0.145
TCR –19.3±6.9 (–35.7 to –7.3) –12.4±4.7 (–21.3 to –2.8) <0.001a)
Values are presented as mean±standard deviation (range).
CR: combined rotation, sTEA: surgical transepicondylar axis, FCR: femoral component rotation, ICR: intercomponental rotation, TCR: tibial component rotation relative to the tibial tuberosity tip.
a)Values with statistically significant difference.
Most of the ΔCR values were negative, which suggests reduc
tion of the CR after TKA except for ΔCR3. Assuming the parallel alignment between the femoral component and the tibial com
ponent, subtracting the ICR from the ΔCR values turned all four ΔCR values into negative values (Cal.ΔCRs) with a mean –0.9°
and –1.9° of change in group I and group II, respectively. The mean ITR showed further negative values, –1.7°±7.6° (range, –23.7° to 14.2°) and –8.5°±6.3° (range, –24.5° to 8.7°) in group I and group II, respectively, which should not be confused with the tibial component internal rotation relative to any specific
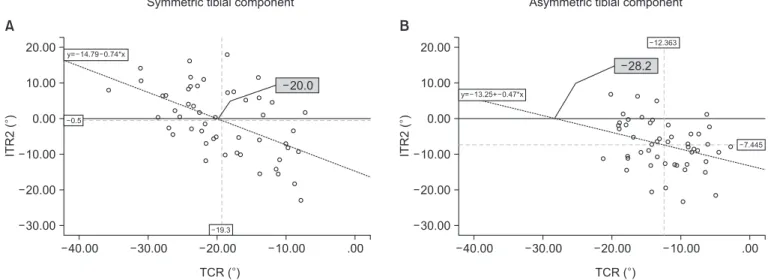
anatomical landmark. All the ΔCRs and the associated derived values were statistically different between the two groups (Table 5). The ITR2=0° point means a setting of complete parallel of the FCR with the sTEA and TCR, while the combined rotational alignment change does not occur compared with the preopera
tive state. Correlation analysis between the ITR2 and the TCR showed a significant negative correlation of –0.55 and –0.29 by using Spearman correlation coefficient in group I and group II, respectively. Equations could be derived from the scatter plot.
The TCR at the mean ITR2=0° point was –20.0° in group I and
A B
19.3 12.4
Fig. 2. (A) Illustration of the symmetric tibial component rotation relative to the proximal tibia according to the authors’
measurements. The symmetric tibial com
ponent was 19.3° internally rotated on av
erage from the tibial tuberosity, which was near the neutral rotation point (20.0°). (B) Illustration of the asymmetric tibial compo
nent rotation relative to the proximal tibia according to the authors’ measurements.
The asymmetric tibial component was 12.4° internally rotation on average from the tibial tuberosity, which had internal ro
tation effect on the combined rotation.
Table 5. Amount of Rotational Alignment Change according to the Different Anatomical References and Adjusted Values
Variable Group I (n=51) Group II (n=50)
pvaluea)
Symmetric tibia (°) Asymmetric tibia (°)
ΔCR1 –1.3±6.3 (–16.6 to 13.3) –5.9±5.7 (–20.4 to 9.9) 0.001
ΔCR2 1.1±8 (–15 to 20.7) –3.7±6.7 (–19.9 to 12.1) 0.002
ΔCR3 1.3±8.4 (–22.2 to 19.3) –3.2±7.2 (–18.4 to 19.7) 0.005
ΔCR4 –1.8±6 (–16 to 14.8) –6.4±5.7 (–16.6 to 10.7) <0.001
Mean ΔCR –0.1±6.3 (–15.8 to 17) –4.8±5.7 (–17.5 to 8) <0.001
Cal.ΔCR1 –2.1±7 (–21.7 to 9.3) –7.7±7.1 (–28.7 to 14.5) <0.001
Cal.ΔCR2 0.2±9 (–20.1 to 16.7) –5.6±7.3 (–21.1 to 9.7) 0.001
Cal.ΔCR3 0.4±9.3 (–27.3 to 19.1) –5.0±7.8 (–22.8 to 14.1) 0.002
Cal.ΔCR4 –2.5±7.1 (–18.6 to 10.8) –8.3±7.1 (–24.6 to 15.4) <0.001
Mean Cal.ΔCR –1.0±7.3 (–20.9 to 13) –6.7±6.7 (–23.7 to 12.1) <0.001
ITR1 –3.1±6.8 (–24.6 to 10.5) –9.6±6.7 (–29.5 to 11.1) <0.001
ITR2 –0.5±9.4 (–22.9 to 17.9) –7.4±6.8 (–23.4 to 6.8) <0.001
ITR3 –0.3±9.4 (–30.1 to 16.4) –6.9±7.5 (–23.6 to 14.4) <0.001
ITR4 –3.5±7 (–18.1 to 12) –10.2±6.5 (–25.4 to 11.9) <0.001
Mean ITR –1.7±7.6 (–23.7 to 14.2) –8.5±6.3 (–24.5 to 8.7) <0.001
Values are presented as mean±standard deviation (range).
ΔCR: change in the amount of combined rotational alignment, Cal.ΔCR: change in the amount of combined rotational alignment excluding the intercomponent rotation, ITR: isolated influence of tibial compoent rotation.
a)p<0.05 was considered statitically significant.
–28.2° in group II. ITR2 was selected, as the sTEA and TT were the selected reference frames in our ITR calculation (Fig. 3).
Discussion
We constructed four pairs of combined rotational alignment measurements (ΔCR1–4) by using two different anatomical axes from above (FN and sTEA) and below (TT and TMA) the knee level. Most of the ΔCR values were negative, which sug
gests gross internal rotation of the lower limb after TKA except for ΔCR3. In addition, the asymmetric tibial component tended to be inserted more externally rotated than the symmetric tibial component, which means more internal rotation in the perspec
tive of total lower limb rotation. Theoretically, ΔCR1–4 should be the same in one person; however, there were differences. The ΔCR2 and ΔCR3 values did not differ significantly (p>0.05) in each group, whereas the ΔCR1 and ΔCR4 values were similar to each other but smaller than the ΔCR2 and ΔCR3 values (p≤0.05).
We suspected that the difference came from the consistent over
estimation of the postoperative TT external rotation by all three investigators. However, no definite point of error was found in our investigation. In other words, the ΔCR values were nearly 0 referencing the TT (ΔCR2 and ΔCR3), compared with 3° inter
nal rotation referencing the TMA (ΔCR1 and ΔCR4). We could interpret the result as a further influence of tibial landmarks
than femoral landmarks on the combined rotational alignment measurement based on the fact that ΔCR1 and ΔCR4 were smaller than ΔCR2 and ΔCR3. Simultaneously considering vari
ous landmarks provided four different perspectives of combined rotational alignment change analysis and enabled the universal comparison of the results with other studies.
A few studies have scrutinized the combined rotational align
ment in TKA. Nicoll and Rowley4) conducted a comparative rotational alignment study between patients with and without pain after TKA by using CT analysis. As we adapted the sTEA and tibial tuberosity as anatomical reference points, our results are comparable to those of Nicoll and Rowley4). According to their results, the CR of the femoral and tibial components was a mean 1.3° of external rotation in the group without pain versus a mean 8.0° of internal rotation in the group with pain. In our study, the mean Cal.ΔCRs were –1.0 and –6.7 in group I and group II, respectively, which are equivalent to the 1.0° and 6.7°
combined component external rotation in their study. They as
sumed the neutral rotational alignment of the tibial component as 18° of internal rotation from the tibial tuberosity tip based on the study by Berger et al.7), which analyzed normal native articu
lar surface geometry. Differently from Nicoll and Rowley4), we assumed “neutral” rotation as the CR that maintains the preTKA state. Concerning the TCR, they concluded that 27° of internal rotation from the tip of the tibial tuberosity was a threshold value
40.00 .00
20.00
10.00
0.00
10.00
20.00
30.00
ITR2()
A
30.00 20.00 10.00
TCR ( )
40.00 .00
20.00
10.00
0.00
10.00
20.00
30.00
ITR2()
B
30.00 20.00 10.00
TCR ( )
19.3
20.0
0.5 y= 14.79 0.74*x
28.2
12.363
7.445 y= 13.25+ 0.47*x
Symmetric tibial component Asymmetric tibial component
Fig. 3. (A) Scatter plot depicting the correlation between TCR and ITR2 in the symmetric tibial component. The intersecting point between the ITR2=0 line and the trend line is TCR of 0° combined rotation change. Tibial component is –20.0° internally rotated relative to the tibial tuberosity at this point (CC, –0.55; p<0.05) (B) Scatter plot depicting the correlation between TCR and ITR2 in the asymmetric tibial component group The inter
secting point between the ITR2=0 line and the trend line is TCR of 0° combined rotation change. Tibial component is –28.2° internally rotated rela
tive to the tibial tuberosity at this point, which did not occur in the real situation (CC, –0.29; p<0.05). TCR: tibial component rotation relative to the tibial tuberosity tip, ITR2: isolated influence of tibial component rotation in the combined rotational alignment change after total knee arthroplasty with regard to surgical femoral transepicondylar axis and tibial tuberosity tip axis, CC: correlation coefficient.
for producing knee pain. In our study, seven cases in group I but none in group II appeared to have >27° of internal rotation from the tibial tuberosity tip, which suggests the advantage of an asymmetric tibial component in rotational alignment. Similar to the concept of ΔCR1 in our study, Hauschild et al.15) reported that the femoral and tibial components influence the rotation of the whole leg, whereas external rotation of the femoral and tibial components compared with the preoperative situation resulted in approximately 5° of increased internal rotation of the entire limb. In our study, the mean ΔCR1 and Cal.ΔCR1 were –1.3°
and –2.1°, respectively. Our results showed slightly less internal rotation compared with the results of Hauschild et al.15); how
ever, the tendency of internal rotation relative to the preTKA state was similar in both studies. Watanabe et al.16) compared the knee rotational angle between the preTKA and postTKA states.
They separated the postTKA knees into rotationally matched and mismatched groups according to the angle formed by the tibial AP axis and the axis perpendicular to the femoral TEA.
The ICR primarily originates from the design feature of implants that do not have fully conforming femorotibial articular surfaces or a fully constraining cam–post interspace19). Changed soft
tissue tension and rotational force vectors excursed by adjacent muscles secondarily influence the ICR. According to Watanabe et al.16), a rotationally matched group showed a mean 3.3° com
bined internal rotation. As they used a medial pivot knee design implant that allows 15° of rotational motion between the femoral and tibial components, the rotationally matched and unmatched groups could be obviously separated. On the contrary, we used a fixed bearing implant, and there could be a rotational limita
tion between the femoral and tibial components. Our ICR was a mean 0.9° external rotation of the tibial component relative to the femoral component and ranged from 9.7° internal rotation to 6.7°
external rotation in group I. The ICR was not significantly differ
ent between groups I and II.
The asymmetric tibial component has a known advantage of covering more tibial cut surface as it is shaped to best fit the natu
ral tibial shape, and recent studies are reporting better rotational alignment results by using the asymmetric tibial component2022). According to our measurements, the asymmetric tibial compo
nent was less internally rotated relative to the tibial tuberosity than symmetric tibial component. The resulting change of lower extremity rotational alignment after TKA in group II was a mean 6° of internal rotation relative to the preTKA state. Dai et al.20) reported an internal rotation tendency of the symmetric tibial component relative to the proximal tibia in maximizing the tibial cut surface coverage, whereas the asymmetric tibial component
was less internally rotated than the symmetric tibial component but featured maximal coverage. As surgeons generally attempt to cover as much of the tibial cut surface as possible while maintain
ing good TCR, we can surmise that the symmetric tibial compo
nent will be more internally rotated than the asymmetric compo
nent when implanted based on the results of Dai et al.20). This can be interpreted as an undesirable influence of a symmetrical tibial component on the combined rotational alignment in TKA. In our study, the difference between the asymmetric and symmetric tibial components was consistent with the findings of Dai et al.20).
The ITR is our new concept to explain the contribution of the TCR in the combined rotational alignment change. Correlating the ITR with TCR enabled the translation of CR into the rotation relative to the tibial tuberosity. At the ITR=0 point, the postop
erative CR equals the preoperative CR. Considering that the pro
gression of an external rotation deformity mainly occurs in the tibia proportionate to the osteoarthritis grade23), the ITR=0 point only recovers the arthritic and externally deformed lower limb rotational alignment. On the basis of common knowledge, the final target combined rotational alignment should fall within the range of “neutral” to “not intoeing.” According to our correlation analysis, the TCR was influencing the external rotation effect on the CR in half of group I patients. However, in group II, the tibial component mostly internally rotated the combined rotational alignment. The linear correlation showed that a 20.0° internal rotation of the symmetric tibial component relative to the tibial tuberosity is the borderline of therapeutic combined rotational alignment. With the asymmetric tibial component, the negative effect on CR was minimal because the borderline was too far from the mean TCR. To our knowledge, no study has compared the symmetrical and asymmetrical tibial components in the con
text of the combined rotational alignment.
1. Limitations
As with other rotational alignment studies, our study was not free from problems related to axis measurement precision9,1215), and we also adapted the ICC to guarantee the reliability of our measurements. The ICC results of this study ranged from 0.87 to 0.97. Additionally, we made 4 pairs (CR1–4) of measurement sets to reduce the errors originating from measuring specific anatomical landmarks with high intra interobserver disparity.
Second, in this study, the measured angles could be affected by the patient’s rotational position (pevis or limb) during the CT scan despite we tried to regulate the position. Although we knew that using one of the patient’s own anatomic structures as a refer
ence point would be an ideal method to overcome this limitation,
we adapted the method assuming the difference originating from the two methods would be subtle. Third, this study was limited by its small population, which means less power. Finally, this study did not consider foot or gait status. Although the change in combined lower limb rotation eventually resulted in the change of foot progression, we could not merge this study with a foot progression angle study owing to the absence of a gait laboratory.
Conclusions
The combined rotational alignment was internally rotated in both the symmetric and asymmetric tibial component designs.
From the perspective of combined rotational alignment, the asymmetric tibial component was better than the symmetric tibial component in achieving more internally rotated lower limb.
The internal rotation of the symmetric tibial component relative to the tibial tuberosity tip should fall within 20° to avoid aggrava
tion of osteoarthritic rotational deformity of lower limb.
Conflict of Interest
No potential conflict of interest relevant to this article was re
ported.
References
1. Akagi M, Matsusue Y, Mata T, Asada Y, Horiguchi M, Iida H, Nakamura T. Effect of rotational alignment on patellar tracking in total knee arthroplasty. Clin Orthop Relat Res.
1999;(366):15563.
2. Barrack RL, Schrader T, Bertot AJ, Wolfe MW, Myers L.
Component rotation and anterior knee pain after total knee arthroplasty. Clin Orthop Relat Res. 2001;(392):4655.
3. Berger RA, Crossett LS, Jacobs JJ, Rubash HE. Malrotation causing patellofemoral complications after total knee arthro
plasty. Clin Orthop Relat Res. 1998;(356):14453.
4. Nicoll D, Rowley DI. Internal rotational error of the tibial component is a major cause of pain after total knee replace
ment. J Bone Joint Surg Br. 2010;92:123844.
5. Rhoads DD, Noble PC, Reuben JD, Mahoney OM, Tullos HS. The effect of femoral component position on patellar tracking after total knee arthroplasty. Clin Orthop Relat Res.
1990;(260):4351.
6. Berger RA, Rubash HE, Seel MJ, Thompson WH, Crossett LS. Determining the rotational alignment of the femoral component in total knee arthroplasty using the epicondylar
axis. Clin Orthop Relat Res. 1993;(286):407.
7. Berger RA, Seel MJ, Schleiden M. Computerized tomo
graphic determination of the normal tibiofemoral rotational angle: a guide to tibial component rotational alignment in TKA. Orthop Trans. 1993;17:1174.
8. Griffin FM, Math K, Scuderi GR, Insall JN, Poilvache PL.
Anatomy of the epicondyles of the distal femur: MRI analy
sis of normal knees. J Arthroplasty. 2000;15:3549.
9. Kobayashi H, Akamatsu Y, Kumagai K, Kusayama Y, Ishi
gatsubo R, Muramatsu S, Saito T. The surgical epicondylar axis is a consistent reference of the distal femur in the coro
nal and axial planes. Knee Surg Sports Traumatol Arthrosc.
2014;22:294753.
10. Victor J. Rotational alignment of the distal femur: a literature review. Orthop Traumatol Surg Res. 2009;95:36572.
11. Victor J, Van Doninck D, Labey L, Van Glabbeek F, Parizel P, Bellemans J. A common reference frame for describing rota
tion of the distal femur: a ctbased kinematic study using cadavers. J Bone Joint Surg Br. 2009;91:68390.
12. Wai Hung CL, Wai Pan Y, Kwong Yuen C, Hon Bong L, Lei Sha LW, Ho Man SW. Interobserver and intraobserver er
ror in distal femur transepicondylar axis measurement with computed tomography. J Arthroplasty. 2009;24:96100.
13. Cobb JP, Dixon H, Dandachli W, Iranpour F. The anatomical tibial axis: reliable rotational orientation in knee replace
ment. J Bone Joint Surg Br. 2008;90:10328.
14. Sahin N, Atici T, Ozturk A, Ozkaya G, Ozkan Y, Avcu B.
Accuracy of anatomical references used for rotational align
ment of tibial component in total knee arthroplasty. Knee Surg Sports Traumatol Arthrosc. 2012;20:56570.
15. Hauschild O, Muenzberg M, Knothe D, Konstantinidis L, Helwig P, Sudkamp NP, Thielemann FW. Rotational limb alignment changes following total knee arthroplasty. Knee Surg Sports Traumatol Arthrosc. 2013;21:234654.
16. Watanabe S, Sato T, Omori G, Koga Y, Endo N. Change in tibiofemoral rotational alignment during total knee arthro
plasty. J Orthop Sci. 2014;19:5718.
17. Waidelich HA, Strecker W, Schneider E. Computed tomo
graphic torsionangle and length measurement of the lower extremity: the methods, normal values and radiation load.
Rofo. 1992;157:24551.
18. Tanifuji O, Sato T, Kobayashi K, Mochizuki T, Koga Y, Ya
magiwa H, Omori G, Endo N. Threedimensional in vivo motion analysis of normal knees employing transepicondy
lar axis as an evaluation parameter. Knee Surg Sports Trau
matol Arthrosc. 2013;21:23018.
19. Matsuda S, Mizuuchi H, Fukagawa S, Miura H, Okazaki K, Matsuda H, Iwamoto Y. Mobilebearing prosthesis did not improve midterm clinical results of total knee arthroplasty.
Knee Surg Sports Traumatol Arthrosc. 2010;18:13116.
20. Dai Y, Scuderi GR, Bischoff JE, Bertin K, Tarabichi S, Rajgo
pal A. Anatomic tibial component design can increase tibial coverage and rotational alignment accuracy: a comparison of six contemporary designs. Knee Surg Sports Traumatol Arthrosc. 2014;22:291123.
21. Martin S, Saurez A, Ismaily S, Ashfaq K, Noble P, Incavo SJ.
Maximizing tibial coverage is detrimental to proper rota
tional alignment. Clin Orthop Relat Res. 2014;472:1215.
22. Wernecke GC, Harris IA, Houang MT, Seeto BG, Chen DB, MacDessi SJ. Comparison of tibial bone coverage of 6 knee prostheses: a magnetic resonance imaging study with con
trolled rotation. J Orthop Surg (Hong Kong). 2012;20:1437.
23. Matsui Y, Kadoya Y, Uehara K, Kobayashi A, Takaoka K.
Rotational deformity in varus osteoarthritis of the knee:
analysis with computed tomography. Clin Orthop Relat Res.
2005;(433):14751.