* 정회원 ․ 경북대학교 토목공학과 박사 (Kyungpook National University ․ [email protected])
** 종신회원 ․ 교신저자 ․ 경북대학교 토목공학과 교수 (Corresponding Author ․ Kyungpook National University ․ [email protected]) Received February 12, 2020/ revised February 26, 2020/ accepted March 27, 2020
Copyright ⓒ 2020 by the Korean Society of Civil Engineers
This is an Open Access article distributed under the terms of the Creative Commons Attribution Non-Commercial License (http://creativecommons.org/licenses/by-nc/3.0)
DOI: https://doi.org/10.12652/Ksce.2020.40.4.0417
www.kscejournal.or.kr
하천재해예방사업의 성과에 미치는 리스크 영향요인
조진호*ㆍ김병수**
Cho, Jin-Ho*, Kim, Byung-Soo**
Risk Influencing Factors in Performance of River Disaster Prevention Project
ABSTRACT
The characteristics of the construction project involved various stakeholders’ involvement from the planning stage until completion of the object, which caused the uncertainty to increase. Successful construction projects require risk analysis and appropriate responses.
Therefore, this study aimed to confirm the influence of risk management factors on the success of river disaster prevention construction in construction projects and the effect of moderating communication between stakeholders involved in the construction process. The Delphi method was used to derive the risk management factors of the construction process. The survey used a snow ball sampling method. For analysis, SPSS Statistic 20 and SmartPLS 2.0 were used. As a result of the study, the impact of risk management factors on project performance was found to be large in the order of time risk, quality risk, cost risk, safety risk, and construction environment risk. In addition, the impact of the communication moderating effect was large in the order of cost risk, quality risk, construction environment risk, time risk, and safety risk. In this study, it was confirmed that communication between stakeholders related to river disaster prevention work has a moderating effect that changes the ranking of impacts on project performance. This shows the importance of communication in the construction process of river disaster prevention works. This study has important significance in that it identifies the importance of risk management factors and communication in river disaster prevention works.
Key words : River disaster prevention project, Risk management factors, Communication, Project performance 초 록
건설프로젝트 특성은 기획단계에서부터 목적물이 완공될 때까지 다양한 이해관계자의 참여가 수반되며, 이러한 특성은 불확실성을 높이는 원인 이 된다. 건설프로젝트 성공을 위해서는 리스크에 대한 분석과 적절한 대응이 필요하다. 따라서 본 연구는 건설프로젝트 중 하천재해예방사업의 성공을 위한 리스크 관리요인의 영향력과 시공과정에서 관련된 이해관계자 간의 커뮤니케이션 조절효과를 확인하고자 하였다. 시공과정의 리스 크 관리요인의 도출은 델파이기법과 설문조사는 스노우볼 샘플링 방법을 그리고 분석은 SPSS Statistic 20과 SmartPLS 2.0을 이용하였다. 연 구결과, 프로젝트 성과에 대한 리스크 관리 요소의 영향력은 공기리스크, 품질리스크, 원가리스크, 안전리스크, 건설환경리스크 순으로 나타났 다. 또한, 커뮤니케이션 조절효과의 영향력은 원가리스크, 품질리스크, 건설환경리스크, 공기리스크, 안전리스크 순으로 나타났다. 본 연구에서 하천재해예방사업 관련 이해관계자 간의 커뮤니케이션은 프로젝트성과에 미치는 영향력의 순위를 바꿀 만큼 조절효과가 있다는 것을 확인할 수 있었다. 이는 하천재해예방사업 시공과정에서 커뮤니케이션의 중요성을 보여주는 결과이다. 본 연구는 하천재해예방사업의 리스크 관리요인과 커뮤니케이션의 중요성을 규명했다는 점에서 중요한 의의를 가진다.
검색어 : 하천재해예방사업, 리스크관리요인, 커뮤니케이션, 프로젝트성과
Construction Management
시공관리1. 서 론
1.1 연구의 배경 및 목적
시공평가액 상위 10개사의 경우 대부분 PRM (Project Risk Management)팀이 구성되어 전문적인 리스크 관리를 수행한다.
그리고 PRM CHECK-LIST를 통해 수익성 있는 프로젝트 수주에 매진한다. 하지만 그 외 건설기업 특히, 지역 종합건설사의 경우 PRM팀의 구성과 PRM CHECK-LIST를 활용하는 경우는 극히 드물다.
건설프로젝트는 다양하고 복잡한 공정으로 이루어져 있다. 특히 하천재해예방사업은 준설, 매립, 축제, 보축, 도로, 교량, 보, 수로박 스, 옹벽, 배수구조물 등 거의 모든 토목공정을 포함한다. 건설프로 젝트는 특성상 불확실성이 내재하여 있다. 이러한 불확실성은 리스 크를 수반한다. 리스크를 기회로 활용하여 성과를 달성하는 것이 리스크관리의 목적이다(Kang and Hong, 2014). 하지만 리스크는 손실을 초래한다. 리스크의 효과적인 관리를 통해 최소화하는 것은 건설프로젝트 목표 달성에 매우 중요하다(Han et al., 2001).
리스크 관리는 건설프로젝트에서 원가, 공기, 품질, 안전 등의 목표 달성에 큰 영향을 미친다(Lee et al., 2010). 건설프로젝트 특성은 기획단계에서부터 목적물이 완공될 때까지 다양한 이해관 계자의 참여가 수반된다. 이러한 특성은 불확실성을 높이는 원인이 된다(Cho, 2017). 건설프로젝트 성공을 위해서는 리스크에 대한 분석과 적절한 대응이 필요하다(Kang and Hong, 2014).
프로젝트 과정별 리스크 관리요인의 수행 단계는 기획·타당성 분석, 계획·설계, 견적·입찰, 계약, 시공, 시운전·준공 순이다(Seo et al., 2010). 건설프로젝트의 입찰경쟁률과 낙찰률을 고려할 때 계약 이전 단계에서의 리스크 관리는 실현 불가능하다. 평균적으로 입찰에 참가하는 업체 수는 200개가 넘고 낙찰사로 선정될 확률은 0.5 % 정도인 점을 고려할 때 입찰에 참여한 건설업체가 계약이전 단계의 리스크 분석을 잘해서 입찰한다고 해도 낙찰사로 선정될 확률은 매우 낮기 때문이다. 그리고 입찰에 참여하는 건설업체의 리스크관리 역량 또한 이에 못 미친다. 따라서 건설업체의 리스크관 리 범위는 계약 이후 단계 즉, 시공 및 시운전·준공 단계로 한정하는 것이 현실적이다.
본 연구에서는 경상북도 관내 10개 지구 하천재해예방사업을 수행하고 있는 도급업체 현장대리인을 대상으로 델파이 기법을 통해 실제로 체감하는 시공, 시운전·준공에 관한 리스크 관리요인을 도출하고 이를 바탕으로 프로젝트성과에 미치는 영향력을 파악하 여 하천재해예방사업에서 중점적으로 관리해야 할 시공, 시운전·준 공에 관한 핵심 리스크 관리요인이 무엇인지를 파악하고자 한다.
또한, 하천재해예방사업의 성공을 위해서는 다양한 이해관계자 간의 커뮤니케이션이 매우 중요하다는 현장대리인들의 공통된 의
견을 수렴하여 커뮤니케이션의 조절효과를 확인하고자 한다. 연구 결과를 바탕으로 핵심 리스크 관리요인의 영향력 순위를 통해 하천재해예방사업에서 주목해야 할 리스크 관리요인을 제안하고자 한다.
1.2 기존연구동향
1.2.1 리스크 관리요인과 프로젝트성과에 관한 연구
Kaplan and Norton(2001)은 기업의 성과측정지표를 전략지도 (Strategy Map)을 통해 재무, 고객, 내부조직, 혁신과 학습으로 선정하였다. 그들은 조직의 성과측정 시스템은 관리자와 직원의 행동에 강한 영향을 미치고 투자의 반환 같은 전통적인 금융 회계 조치를 할 수 있으며, 지속적인 개선 및 혁신에 대한 잘못된 신호를 줄 수 있으므로 균형 잡힌 전략지도를 제시하여 커뮤니케이션 도구로 진화시켰다.
리스크 관리에 대해 Cohen and Brand(1990)는 조직 내 모든 직급의 구성원뿐만 아니라 최고경영자의 품질경영활동을 촉진하여 기업의 성과달성을 견인할 수 있으며, 리스크 관리의 장점으로 조직원의 낭비요소 제거, 제안활동을 통한 업무 효율성 및 생산성 향상, 조직원의 동기유발과 상호 커뮤니케이션 상승효과, 조직원의 권한과 자율적인 커뮤니케이션의 촉진, 고객의 수요 증가, 조직원의 목표 달성을 가능하게 한다는 점을 제시하였다.
Lee et al.(2014)는 건설 관련 기업에 근무하는 프로젝트 관련 인원 60명을 대상으로 한 실증연구에서 모든 리스크요인의 관리수 준이 프로젝트성과와 정(+)의 상관관계가 있고, 재무·경제 리스크 관리, 운영 리스크관리, 건설 리스크관리, 정치·사회 리스크관리 순으로 프로젝트성과에 영향을 미치고 있음을 밝혔다. 그들은 리스 크 관리는 프로젝트의 성공과 실패에 가장 직접적인 영향을 미치므 로 프로젝트의 완수를 위해서는 치밀한 리스크 관리에 관한 전략이 필요하다고 주장하였다.
1.2.2 커뮤니케이션의 조절효과에 관한 연구
Ahn(2015)과 Hong et al.(2003)은 건설프로젝트는 복합공정으 로 다수의 공정별 계획에 따라 발주되고 자원, 장비와 인력 등이 투입됨에 따라 사업 기간과 사업비 등에 영향을 미칠 수 있는 리스크가 잠재되어 있다는 것을 밝혀냈다.
Ahn and Chung(2018)은 건설프로젝트에 영향을 미치는 불확 실한 리스크요인 및 상황에 대한 사전 인지와 인지된 리스크를 구체적으로 관리하기 위해서는 이해관계자 간의 커뮤니케이션이 리스크 관리요인과 프로젝트 성과 간의 조절변수로서 매우 중요하 다고 하였다.
Kwon and Kim(2011)은 커뮤니케이션은 조직 구성원이 조직에
서 활동하는 기본과정으로써 구성원 사이에 정보가 이동하는 과정
의 경로이며, 구성원 상호 간의 지식, 정보, 의견, 신념과 감정 등을 전달 또는 공유하는 상호작용의 행동이라고 하였다.
Kim et al.(2013)은 정보이론에서 커뮤니케이션의 핵심은 송신자 의 전달 메시지가 최소한 정보 왜곡이나 오류 없이 수신자에게 전달되 는 것이며, 커뮤니케이션 없이는 조직이 존재할 수 없는 이유가 구성원 들의 행동이 커뮤니케이션에 의해 영향을 받기 때문이라고 하였다.
Cho(2017)는 무엇보다 건설프로젝트 성공을 위해서는 최고경 영자의 리더십이 가장 중요하며, 전 조직구성원과의 커뮤니케이션 이 조직 활성화의 근간임을 주장하였다. 그리고 건설프로젝트에서 커뮤니케이션의 부족 즉, 조직구성원의 공감대 형성의 부족으로 성과달성에 실패할 수가 있다고 하였다. 또한, 품질경영활동을 통해 건설프로젝트 전 과정에서 발생하는 리스크와 기회에 대한 대응방법을 수립하고 리스크에 따른 예방과 건설프로젝트 성과에 영향을 미치는 요인을 파악함과 동시에 분석함으로써 잠재적인 리스크에 대해 회피, 감소, 제거, 변경과 공유를 통해 전체 조직구성 원에 전파되도록 하기 위해서는 최고경영자와 고위 임직원의 관심 과 참여가 필요하다고 하였다.
2. 연구방법
2.1 연구모형 및 가설 설정
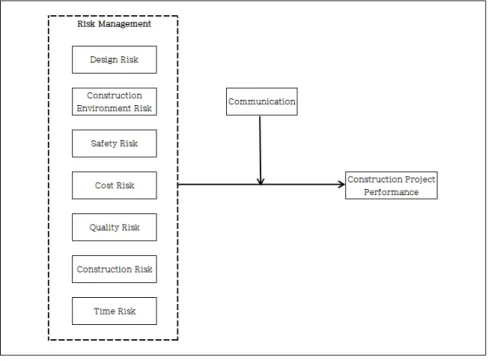
건설프로젝트관리와 리스크에 대한 선행연구를 기초로 하여 Fig. 1의 연구모형을 설정하였다. 하천재해예방사업에서 리스크관 리 실행요인으로 중요하게 인식된 설계리스크, 시공환경리스크,
안전리스크, 원가리스크, 품질리스크, 시공리스크, 공기리스크 관리 요인과 프로젝트성과 그리고 커뮤니케이션에 관한 연구변수의 구성 개념을 도출하고 이들 변수 간의 관계에 대한 가설을 정립하였다.
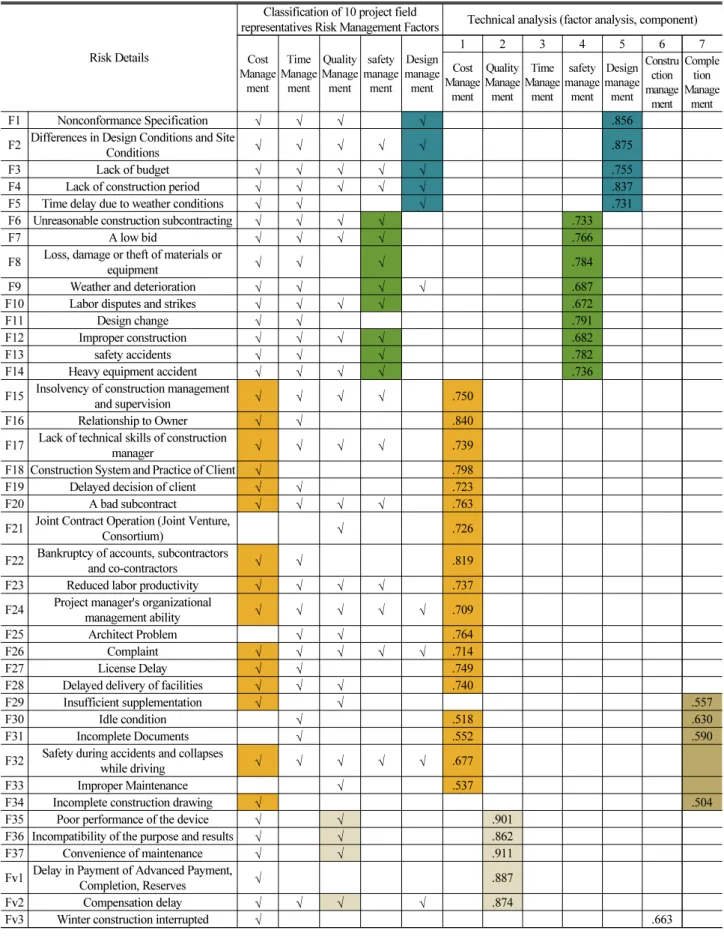
건설프로젝트의 리스크 분류체계에 관한 선행연구에서 제시된 리스크요인(Zhi, 1995; Chapman, 2001; Jung, 2005; Choi et al., 2011)을 바탕으로 해외공사와 관련된 항목은 제외하고 영역을 구분하지 않고 37개(F1~F37) 요인과 현장의 목소리 21개(Fv1~
Fv21) 요인을 포함한 총 58개 세부항목으로 취합하여 1차 분석을 수행하였다. 현장의 목소리는 전문가의 경험적 지식을 통한 문제해 결 및 미래예측을 위한 기법으로 전문가합의법이라고도 하는 델파 이(Delphi) 기법을 활용하여 경상북도 관내 하천재해예방사업을 수행 중인 현장대리인(10명)을 통해 도출하였다. 리스크요인을 건설프로젝트 현장에서 요구되는 관리요인으로 분류하기 위하여 Tables 1 and 2에서와 같이 58개 리스크요인에 대해 델파이 기법으 로 프로젝트성과에 영향을 미칠 수 있다고 판단되는 리스크요인을 선택하게 하였다. 여기서 원가관리, 공기관리, 품질관리, 안전관리, 설계관리의 5가지 관리요인을 도출하였다.
다음으로 정량적 분석을 위해 SPSS Statistic 20을 이용하여 베리맥스(Varimax) 회전법으로 요인분석을 수행하였다. 베리맥스 회전분석법은 데이터 축소를 통해 정보를 함축적으로 사용할 수 있는 기법으로서 본 연구에서는 측정도구의 구성개념 타당성을 검증하기 위해 정보의 손실을 최소화하면서 많은 변수를 가능한 한 적은 수의 요인으로 줄이는 주성분 분석인 베리맥스 직각 회전을 사용하였다.
Fig. 1. Research Model
Table 1. Delphi Classification and Technical Analysis (Factor Analysis) (Phase 1)
Risk Details
Classification of 10 project field
representatives Risk Management Factors Technical analysis (factor analysis, component) Cost
Manage ment
Time Manage
ment Quality Manage ment
safety manage ment
Design manage ment
1 2 3 4 5 6 7
Cost Manage
ment Quality Manage ment
Time Manage
ment safety manage ment
Design manage ment
Constru ction manage
ment Comple
tion Manage
ment
F1 Nonconformance Specification √ √ √ √ .856
F2 Differences in Design Conditions and Site Conditions √ √ √ √ √ .875
F3 Lack of budget √ √ √ √ √ .755
F4 Lack of construction period √ √ √ √ √ .837
F5 Time delay due to weather conditions √ √ √ .731
F6 Unreasonable construction subcontracting √ √ √ √ .733
F7 A low bid √ √ √ √ .766
F8 Loss, damage or theft of materials or
equipment √ √ √ .784
F9 Weather and deterioration √ √ √ √ .687
F10 Labor disputes and strikes √ √ √ √ .672
F11 Design change √ √ .791
F12 Improper construction √ √ √ √ .682
F13 safety accidents √ √ √ .782
F14 Heavy equipment accident √ √ √ √ .736
F15 Insolvency of construction management and supervision √ √ √ √ .750
F16 Relationship to Owner √ √ .840
F17 Lack of technical skills of construction manager √ √ √ √ .739
F18 Construction System and Practice of Client √ .798
F19 Delayed decision of client √ √ .723
F20 A bad subcontract √ √ √ √ .763
F21 Joint Contract Operation (Joint Venture, Consortium) √ .726
F22 Bankruptcy of accounts, subcontractors and co-contractors √ √ .819
F23 Reduced labor productivity √ √ √ √ .737
F24 Project manager's organizational
management ability √ √ √ √ √ .709
F25 Architect Problem √ √ .764
F26 Complaint √ √ √ √ √ .714
F27 License Delay √ √ .749
F28 Delayed delivery of facilities √ √ √ .740
F29 Insufficient supplementation √ √ .557
F30 Idle condition √ .518 .630
F31 Incomplete Documents √ .552 .590
F32 Safety during accidents and collapses
while driving √ √ √ √ √ .677
F33 Improper Maintenance √ .537
F34 Incomplete construction drawing √ .504
F35 Poor performance of the device √ √ .901
F36 Incompatibility of the purpose and results √ √ .862
F37 Convenience of maintenance √ √ .911
Fv1 Delay in Payment of Advanced Payment, Completion, Reserves √ .887
Fv2 Compensation delay √ √ √ √ .874
Fv3 Winter construction interrupted √ .663
Table 1. Delphi Classification and Technical Analysis (Factor Analysis) (Phase 1) (Continue)
Risk Details
Classification of 10 project field
representatives Risk Management Factors Technical analysis (factor analysis, component) Cost
Manage ment
Time Manage
ment
Quality Manage ment
safety manage ment
Design manage ment
1 2 3 4 5 6 7
Cost Manage
ment Quality Manage ment
Time Manage
ment safety manage ment
Design manage ment
Constru ction manage
ment Comple
tion Manage
ment Fv4 Supply and demand imbalance of
subsidiary materials √ √ √ .727
Fv5 Insufficient capacity of construction
manager √ √ √ √ √ .732
Fv6 Occurrence of complaints about
business feasibility of residents √ √ √ √ √ .730
Fv7 Insufficient capacity of heavy
equipment engineer √ √ .706
Fv8 Non-cooperation and non-cooperation of related agencies √ √ √ √ √ .838
Fv9 Contractor's failure to contract √ √ √ .825
Fv10 Delay of Real Information √ √ .859
Fv11 Time and Attendance of Subcontract Employees √ √ √ √ √ .823 Fv12 Subcontractor's Negligence, Delay, and Service Suspension √ √ √ √ √ .752 Fv13 Insufficient technical level of
subcontractors √ √ √ .785
Fv14 Poor performance of operating
facilities √ √ .871
Fv15 Unfairness of the Terms √ √ .858
Fv16 Unreasonable Dispute Resolution
Procedures for Compensation √ √ √ .890
Fv17 Rapid changes in new technology and new methods √ √ .835
Fv18 Force majeure in operation and
contract √ .884
Fv19 Headquarters Credit and Liquidity
Risk √ .861
Fv20 Preliminary adequacy √ √ .802
Fv21 Rapid change in the construction
system √ √ √ √ √ .828
58 Item Selection sum 51 43 37 24 18
Table 2. Total Variance Described (Phase 1)
Component Initial Eigen Value Extraction Sum Square Loading Rotation Squared Sum Loading Sum % Of Variance Cumulative Rate (%) Sum % Of Variance Cumulative Rate (%) Sum % Of Variance Cumulative
Rate (%)
1 23.825 41.077 41.077 23.825 41.077 41.077 12.228 21.084 21.084
2 7.275 12.542 53.619 7.275 12.542 53.619 8.269 14.257 35.340
3 5.816 10.027 63.647 5.816 10.027 63.647 7.210 12.431 47.771
4 3.717 6.408 70.055 3.717 6.408 70.055 6.955 11.992 59.763
5 2.249 3.877 73.932 2.249 3.877 73.932 4.543 7.833 67.596
6 1.750 3.017 76.949 1.750 3.017 76.949 4.228 7.290 74.886
7 1.548 2.669 79.618 1.548 2.669 79.618 2.745 4.732 79.618
8 .988 1.949 81.666
9 .974 1.679 83.345
10 .888 1.531 84.876
≀ ≀ ≀ ≀
58 .001 .002 100.000
Table 3. Technical Analysis (Factor Analysis) (Phase 2)
Factor Risk Details
Component
1 2 3 4 5 6 7 8 9
Cost Manage
ment
Construction management
Design manage ment
Construction Environment Management
Quality Manage ment
Time Manage
ment
Commu nication
Project perfor mance
safety manage ment
F1 Nonconformance Specification .886
F2 Differences in Design Conditions and Site Conditions .892
F3 Lack of budget .787
F4 Lack of construction period .842
F5 Time delay due to weather conditions .743
F6 Unreasonable construction subcontracting .790
F7 A low bid .831
F8 Loss, damage or theft of materials or equipment .840
F9 Weather and deterioration .700
F10 Labor disputes and strikes .768
F12 Improper construction .568
F13 safety accidents .745
F14 Heavy equipment accident .751
F15 Insolvency of construction management and supervision .774 F16 Relationship to Owner .851 F17 Lack of technical skills of construction manager .785 F18 Construction System and Practice of Client .831 F19 Delayed decision of client .612 F20 A bad subcontract .671 F22 Bankruptcy of accounts, subcontractors and co-contractors .715 F32 Safety during accidents and collapses while driving .631 F35 Poor performance of the device .888
F36 Incompatibility of the purpose and results .899
F37 Convenience of maintenance .932
Fv2 Compensation delay .870
Fv3 Winter construction interrupted .817 Fv4 Supply and demand imbalance of subsidiary materials .871 Fv5 Insufficient capacity of construction manager .846 Fv6 Occurrence of complaints about business feasibility of residents .848 Fv7 Insufficient capacity of heavy equipment engineer .819 Fv12 Subcontractor's Negligence, Delay, and Service Suspension .838
Fv13 Insufficient technical level of subcontractors .827
Fv15 Unfairness of the Terms .746
Fv16 Unreasonable Dispute Resolution Procedures for Compensation .793
Fv17 Rapid changes in new technology and new methods .876
PP1 Achieved target execution rate for the first half of this year .842
PP2 Higher performance compared to investment in the first half of this year .833
PP3 On-site accident rate decreased in the first half of this year .763
C1 Know about issues and share with others .817
C2 Active efforts to convey relevant information .860
C3 Start conversations with others about related issues .865
요인분석에 따른 요인 적재값(Factor loading)은 0.5 이상을 권고한다(Hair Jr et al., 2016). Table 1과 같이 도출된 리스크요인 F1~Fv21에 대해 스노우볼 샘플링(snowball sampling) 설문기법 으로 수집된 자료를 델파이기법을 통해 도출된 관리요인과 매칭시 키고 권고사항 0.5 이상인 요인들에 대해 색깔별로 그룹화하였다.
분석결과, Tables 1 and 2와 같이 설명된 총 분산은 고윳값 1.0 이상인 요인으로 7개 리스크 관리요인(원가관리, 품질관리, 공기관 리, 안전관리, 설계관리, 시공관리, 준공관리)이 도출되었다. 따라서 델파이기법을 통해 도출된 리스크요인(5개 요인)과 매칭되지 않은 추가요인이 도출되어 2차 요인분석을 수행하였다.
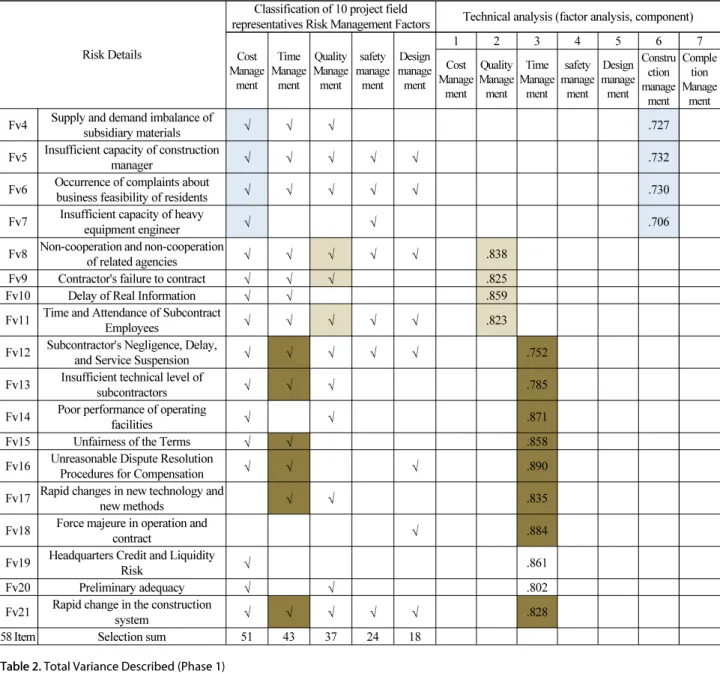
리스크요인이 권고사항 0.5 이상이나 서로 매칭되지 않은 리스크 요인 F1~Fv21 항목에 대해 2차로 Table 3과 같이 SPSS Statistic 20을 이용하여 베리맥스(Varimax) 회전법으로 요인분석을 하였 다. 이후 2차로 시행한 요인분석을 통해 Table 3과 같이 추가로 그룹화되어 도출된 독립변수 7개의 리스크요인과 종속변수인 건설 프로젝트 성과, 조절변수인 커뮤니케이션이 도출되어 최종 리스크 요인으로 설정하였다.
끝으로 가설검증을 위해 독립변수와 종속변수 그리고 조절변수 를 모두 투입하여 베리맥스(Varimax) 회전법으로 요인분석을 수행 하였다. 분석결과, 독립변수인 리스크 관리요인(원가관리, 시공관 리, 설계관리, 건설환경관리, 품질관리, 공기관리, 안전관리)으로 재분류 되었으며, 종속변수(프로젝트 성과) 그리고 조절변수(커뮤 니케이션)가 도출되었다. Table 4와 같이 설명된 총 분산은 고윳값 1.0 이상인 요인으로 9개 요인이 도출되었다.
프로젝트성과 측정항목은 Table 3에서와 같이 Cho(2017)이 제시한 목표 실행률 달성(PP1), 투자대비 높은성과 달성(PP2), 현장재해율 감소(PP3)로 구성하였다. 하천재해예방사업은 다양한 이해관계자의 커뮤니케이션이 프로젝트의 성공과 실패에 미치는
영향력이 크다는 현장대리인들의 공통된 의견을 수렴하여 커뮤니 케이션을 조절변수로 설정하였다. 이를 통해 리스크 관리요인 중 어떠한 관리요인이 프로젝트성과에 더 큰 영향을 미치는지 파악하 여, 중점을 두고 관리해야 할 리스크 관리요인인지를 규명하였다.
조절변수인 이해관계자 간의 커뮤니케이션은 Table 3과 같이 Jung(2016)이 제시한 이슈에 대해 알고 다른 사람들과 공유(C1), 관련된 정보를 전달하는 데 적극적인 노력(C2), 관련된 이슈에 관해 다른 사람들과 대화 시작(C3)으로 구성하였다.
선행연구를 바탕으로 다음과 같은 가설을 설정하였다.
H1 : 리스크 관리요인의 수준이 높을수록 프로젝트성과에 정(+) 의 영향을 미칠 것이다.
H2 : 커뮤니케이션의 조절효과는 리스크 관리요인의 수준과 프로젝트성과의 관계에서 정(+)의 영향을 미칠 것이다.
2.2 자료 분석방법
연구가설의 검증을 위해 경상북도 하천재해예방사업을 수행 중인 현장대리인(10명)을 통해 델파이 기법을 이용하여 7개 리스크 관리요인을 추출하였다. 추출된 리스크 관리요인이 프로젝트성과 에 미치는 영향을 파악하기 위해 실험 참가자를 뽑는 비확률적 샘플링(non-probability sampling) 기법인 스노우볼 샘플링으로 온라인 설문을 진행하였다. 가설 검증을 위해 표준화된 설문지를 사용하였으며, 하천재해예방사업을 시공 중인 건설업체 직원을 대상으로 하여 자료를 수집하였다.
설문문항은 각 변수의 정의를 확인할 수 있는 내용으로 구성하였 다. 설문대상자의 다양한 경험에 따른 주관적 답변을 피하고자 구조 화된 설문문항으로 구성하였다. 자료수집 방법은 모바일 문자메시지, SNS와 e-mail을 이용하여 온라인으로 설문에 응답하도록 하였다.
설문지 배부는 2019년 9월 2일부터 10일까지 총 170부의 설문
Table 4. Total Variance Described (Phase 2)Component Initial Eigen Value Extraction Sum Square Loading Rotation Squared Sum Loading
Sum % Of
Variance Cumulative
Rate (%) Sum % Of
Variance Cumulative
Rate (%) Sum % Of
Variance Cumulative Rate (%)
1 14.702 35.858 35.858 14.702 35.858 35.858 5.784 14.106 14.106
2 6.185 15.085 50.943 6.185 15.085 50.943 4.939 12.046 26.153
3 3.887 9.480 60.423 3.887 9.480 60.423 4.504 10.987 37.139
4 2.425 5.915 66.338 2.425 5.915 66.338 4.482 10.932 48.071
5 2.143 5.227 71.565 2.143 5.227 71.565 3.858 9.409 57.480
6 1.881 4.588 76.153 1.881 4.588 76.153 3.845 9.379 66.859
7 1.488 3.630 79.782 1.488 3.630 79.782 2.725 6.646 73.505
8 1.083 2.642 82.424 1.083 2.642 82.424 2.657 6.480 79.985
9 1.079 2.217 84.642 .909 2.217 84.642 1.909 4.656 84.642
10 .909 1.691 84.292
≀ ≀ ≀ ≀
41 .013 .032 100.000
지를 회수하여 불완전답변 11부를 제외한 159부의 설문지를 통계 분석에 사용하였다.
수집된 자료에 대하여 SPSS Statistic 2.0으로 표본의 특성을 파악하기 위한 빈도분석과 요인분석을 하였다. 가설검증은 SmartPLS 2.0으로 구조방정식 모형 분석을 하였다.
3. 분석결과
3.1 측정변수의 신뢰성 및 타당성 검증
본 연구에서 측정변수로 사용한 리스크 관리요인의 수준, 프로젝 트성과, 커뮤니케이션의 측정항목들에 대한 신뢰성 분석은 기존
Table 5. Item Loadings and Validity
Variable Operational Definition Factor
Loading AVE Composite
Reliability Cronbach’s Alpha
Design Risk
F1 Nonconformance Specification .890
.788 .949 .935
F2 Differences in Design Conditions and Site Conditions .943
F3 Lack of budget .899
F4 Lack of construction period .883
F5 Time delay due to weather conditions .819
Construction Environment
Risk
F6 Unreasonable construction subcontracting .917
.840 .963 .955
F7 A low bid .921
F8 Loss, damage or theft of materials or equipment .973
F9 Weather and deterioration .929
F10 Labor disputes and strikes .838
Safety Risk
F12 Improper construction .809
.818 .931 .905
F13 safety accidents .954
F14 Heavy equipment accident .942
Cost Risk
F15 Insolvency of construction management and supervision .896
.743 .959 .953
F16 Relationship to Owner .902
F17 Lack of technical skills of construction manager .821 F18 Construction System and Practice of Client .861
F19 Delayed decision of client .877
F20 A bad subcontract .912
F22 Bankruptcy of accounts, subcontractors and co-contractors .839 F32 Safety during accidents and collapses while driving .779
Quality Risk
F35 Poor performance of the device .946
.900 .973 .963
F36 Incompatibility of the purpose and results .960
F37 Convenience of maintenance .961
Fv2 Compensation delay .927
Construction Risk
Fv3 Winter construction interrupted .941
.838 .963 .956
Fv4 Supply and demand imbalance of subsidiary materials .942 Fv5 Insufficient capacity of construction manager .921 Fv6 Occurrence of complaints about business feasibility of residents .905 Fv7 Insufficient capacity of heavy equipment engineer .865
Time Risk
Fv12 Subcontractor's Negligence, Delay, and Service Suspension .811
.723 .929 .905
Fv13 Insufficient technical level of subcontractors .829
Fv15 Unfairness of the Terms .862
Fv16 Unreasonable Dispute Resolution Procedures for Compensation .864 Fv17 Rapid changes in new technology and new methods .883 Communicati
on
C1 Know about issues and share with others .940
.872 .953 .927
C2 Active efforts to convey relevant information .933 C3 Start conversations with others about related issues .928 Project
Performance
PP1 Achieved target execution rate for the first half of this year .938
.891 .961 .939
PP2 Higher performance compared to investment in the first half of this year .949 PP3 On-site accident rate decreased in the first half of this year .945
참고논문들에 의해 타당성이 확보되었기 때문에 별도의 타당성 검증은 시행하지 않았다.
측정도구의 신뢰도를 측정하기 위해 크론바흐 알파(Cronbach’s Alpha) 계수를 사용하였다. 크론바흐 알파 계수는 0.8~0.9 이상이 면 바람직하고 0.6~0.7이면 수용할만한 것으로 0.6 이하는 내적일 관성이 없는 것으로 본다(Hair Jr et al., 2016).
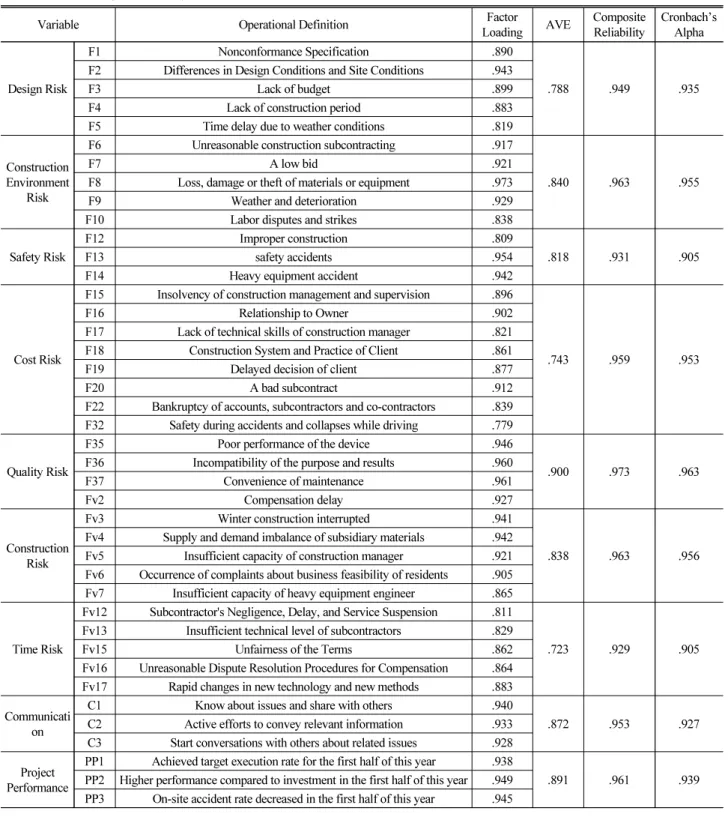
Table 5에서 본 연구의 측정도구에 대한 신뢰성 분석결과 신뢰도 에는 문제가 없어 모든 변수를 다음 단계인 타당성 검증을 위한 자료로 사용하였으며, 타당성 분석을 위해 요인분석을 하였다.
요인의 수는 Eigen value가 1 이상인 요인만 선택하였다. 각 항목의 요인적재값이 0.5 이상인 경우에만 문항이 유의한 것으로 간주하였다.
3.2 측정모형 평가 분석
단일차원 구조로 변환한 측정모형의 평가는 측정변수 간의 타당 성과 신뢰성을 평가한다. 타당성은 개념 간의 차이를 나타내는 판별타당성과 측정변수와 요인 간의 상관관계 정도를 나타내는 집중타당성을 평가한다(Hair Jr et al., 2016).
측정지표의 신뢰성 검증을 위해 복합신뢰도(Composite Reliability) 값이 0.7 이상, 내적 일관성 확보를 위해 평균분산추출(AVE:
Average Variance Extracted) 값이 기준치인 0.5 이상, 크론바하 알파값이 0.7 이상이면 측정도구의 신뢰성이 있다(Fornell and Larcker, 1981). 분석결과, Table 5와 같이 모든 잠재변수의 크론바 흐 알파 값이 0.905~0.963으로 기준치 0.7 이상으로 신뢰성은 높았다. 복합신뢰도는 0.929~0.973으로 기준치 0.7 이상으로 구성 개념에 대한 신뢰도는 높았다. 평균분산추출 값은 0.723~0.900으로 모든 요인에서 0.5 이상으로 구성개념의 신뢰성은 확보되었다. 또한, 측정항목에 대한 집중타당성 검증을 위해 PLS의 부트스트랩 (bootstrap) 방식을 이용하여 구성개념에 대한 요인 적재값을 검증하 였다(Hair Jr et al., 2016). 일반적으로 요인적재값은 0.7 이상을 권장하는데, 요인적재값이 0.876~0.982로 나타나 측정항목의 집중 타당성은 확보되었다. 판별타당성은 모든 변수의 AVE의 제곱근 값이 다른 변수와의 상관계수보다 커야 한다(Hair Jr et al., 2016).
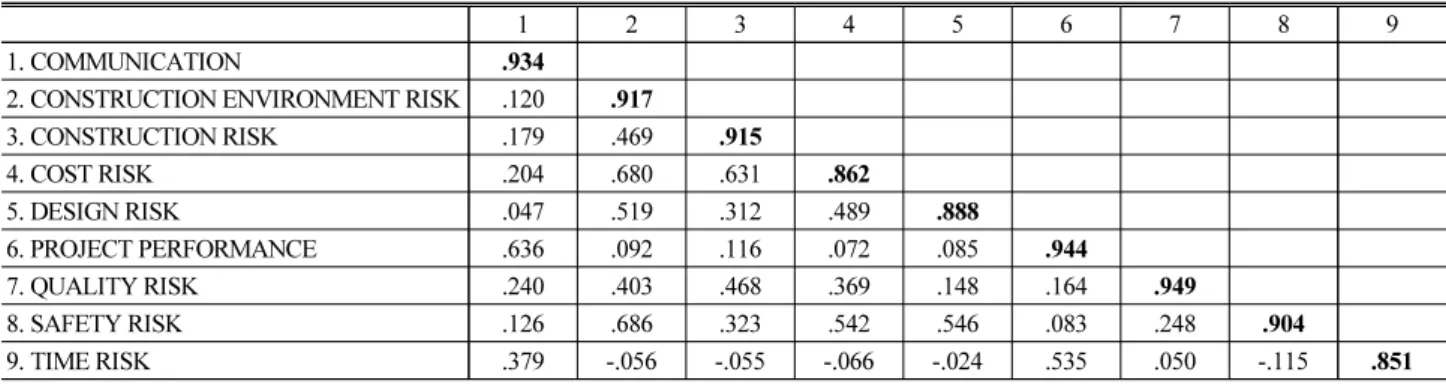
Table 6과 같이 분석결과, 측정변수들의 AVE의 제곱근 값을 다른 변수들의 상관계수 값과 비교했을 때 모두 기준값보다 높았다.
3.3 구조모형 평가 분석
Hair Jr et al.(2016)은 선행변수에 의해 설명되는 최종변수의 적정 검정력(R
2)을 10 %로 제시하였다. 그들은 적합도를 각 구성요 인의 R
2의 값이 0.26 이상이면 ‘상’, 0.26~0.13이면 ‘중’, 0.13~0.02 이면 ‘하’로 평가하였다. 공통성(Communality)은 경로모형의 적합 도를 나타내며, 중복성(Redundancy)은 구조모형의 통계 추정량으 로 적합성을 나타내는데 그 값이 양수이어야 한다고 하였다. 또한, 구조모형의 전반적 적합도 평가를 위해 R
2의 평균값과 공통성의 평균값을 곱한 값의 제곱근 값이 0.36 이상이면 ‘상’, 0.36~0.25이면
‘중’, 0.25~0.1이면 하’로 평가하였다. Table 7과 같이 분석 결과, 최종변수인 프로젝트 성과에 대한 R
2의 값은 52.0 %로 나타났다.
그리고 중복성 값이 모두 양수이고 구성요인들의 R
2의 평균값이 0.520이며, 구조모형의 전체적인 적합도가 0.654로 양호하였다.
4. 가설검증
4.1 기본가설검증 분석
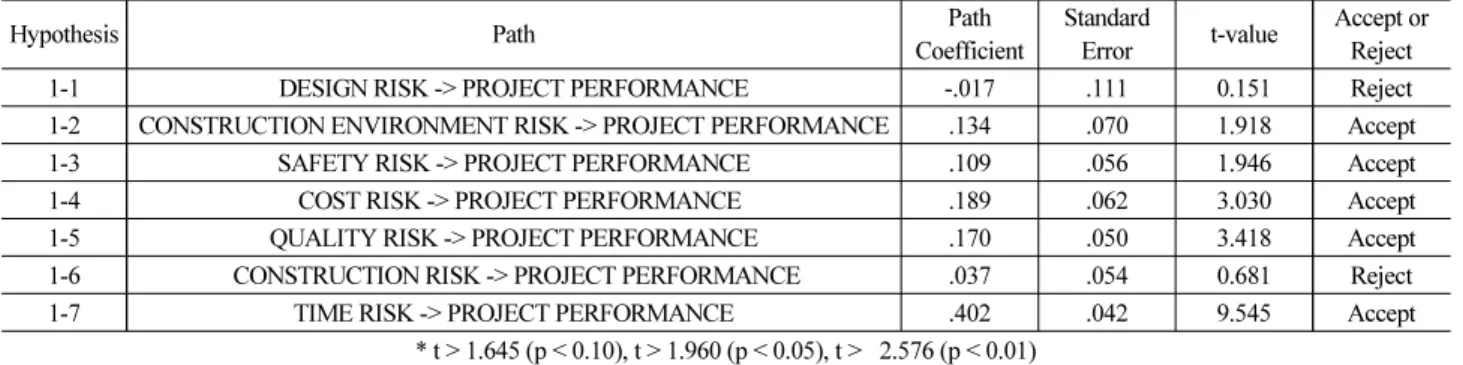
가설 검증은 PLS-SEM을 이용하였다. 전체 표본에서 구조모형에 대한 경로계수를 구하고, 구조모형의 경로 간 유의성 검정을 위해 반복적으로 표본을 추출하여 t-값을 제시하는 부트스트랩 방식(Hair Jr et al., 2016)으로 5,000회의 re-sampling을 실시하여 경로계수 t-값을 산출하였다. 유의성 검정 t-값이 ㅣtㅣ> 1.645이면 경로계수 와 가설이 유의하다(Hair Jr et al., 2016)는 조건을 반영하였다.
분석결과, Table 8과 같이 건설환경 리스크(β=0.134, t=1.918, p<0.001), 안전리스크(β=0.109, t=1.946, p<0.05), 원가리스크(β
=0.189, t=3.030, p<0.01), 품질리스크(β=0.170, t=3.418, p<0.005), 공기리스크(β=0.402, t=9.545, p<0.001)는 프로젝트성 과에 정(+)의 영향을 미쳐 가설 1-2, 1-3, 1-4, 1-5, 1-7은 채택되었다.
반면에 설계리스크(β=-0.017, t=0.151, p<0.447)와 시공리스크
Table 6. Correlation Coefficient Matrix and Roots of the AVEs (Shown as Diagonal Elements)
1 2 3 4 5 6 7 8 9
1. COMMUNICATION .934
2. CONSTRUCTION ENVIRONMENT RISK .120 .917
3. CONSTRUCTION RISK .179 .469 .915
4. COST RISK .204 .680 .631 .862
5. DESIGN RISK .047 .519 .312 .489 .888
6. PROJECT PERFORMANCE .636 .092 .116 .072 .085 .944
7. QUALITY RISK .240 .403 .468 .369 .148 .164 .949
8. SAFETY RISK .126 .686 .323 .542 .546 .083 .248 .904
9. TIME RISK .379 -.056 -.055 -.066 -.024 .535 .050 -.115 .851
(β=0.037, t=0.681, p<0.258)는 프로젝트성과에 정(+)의 영향을 미치지 않아 가설 1-1과 1-6은 기각되었다.
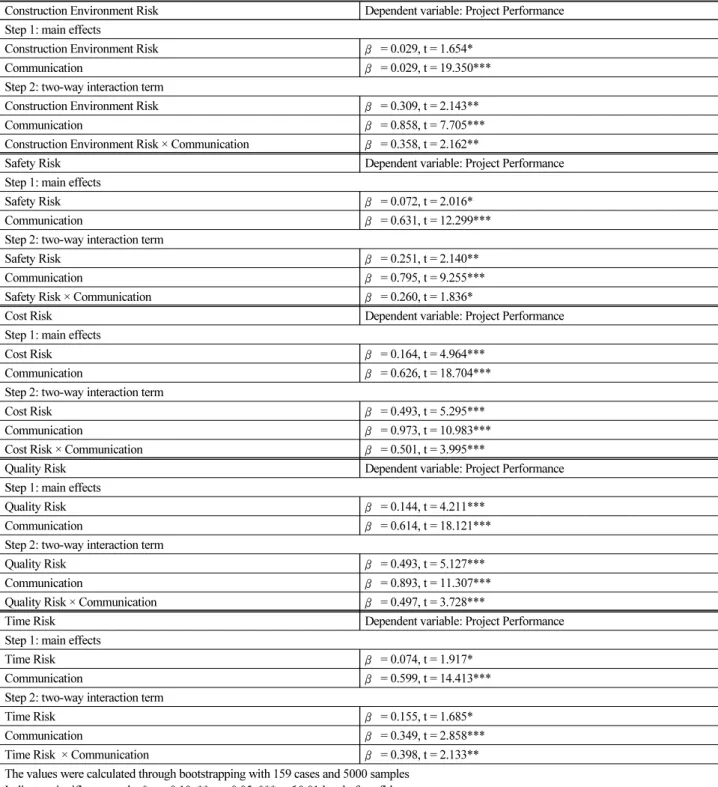
4.2 커뮤니케이션의 조절효과 검증 분석
커뮤니케이션의 조절효과를 검증하기 위하여 본 연구에서 설정 한 두 번째 가설의 세부항목인 리스크 관리요인을 Table 9에서와 같이 설계리스크를 2-1, 건설환경리스크를 2-2 등으로 표현한다.
커뮤니케이션의 조절효과 검증은 Chin(1998)이 제안한 방법인 1단계의 주효과가 유의해야 하며, 2단계의 양방향 상호작용 효과가 유의해야 하고, 1단계와 2단계가 모두 유의하면 조절효과가 있는 것으로 판단한다.
분석결과, Table 9와 같이 높은 수준의 커뮤니케이션은 가설 2-2, 2-3, 2-4, 2-5, 2-7에서 제안한 대로 건설환경리스크, 안전리스 크, 원가리스크, 품질리스크, 공기리스크와 프로젝트성과의 관계를 강화하는 것으로 나타났다.
5. 결 론
건설분야의 리스크관련 연구는 프로젝트성과에 미치는 리스크 관리요인을 파악하는 것을 목적으로 주로 수행되었다. 하지만 본
연구에서는 리스크 관리요인이 프로젝트 성과에 미치는 영향력과 시공과정에서 관련된 이해관계자 간의 커뮤니케이션 조절효과를 확인하고자 하였다.
본 연구의 결과 하천재해예방사업의 리스크 관리요인이 프로젝 트성과에 미치는 영향력은 공기리스크, 품질리스크, 원가리스크, 안전리스크, 건설환경리스크 순으로 나타났으며, 리스크 관리요인 과 프로젝트성과 간의 커뮤니케이션 조절효과의 영향력 크기는 원가리스크, 품질리스크, 건설환경리스크, 공기리스크, 안전리스크 순으로 나타났다.
본 연구에서 하천재해예방사업 관련 이해관계자 간의 커뮤니케 이션은 프로젝트성과에 미치는 영향력의 순위를 바꿀 만큼 조절효 과가 있다는 것을 확인할 수 있었다. 발주처(자), 건설사업관리기술 인, 현장 민원인 등과의 원활한 커뮤니케이션은 프로젝트를 수행하 면서 건설사 입장에서 가장 중요한 원가리스크 관리가 향상되는 것으로 나타났다. 이는 하천재해예방사업 시공과정에서 커뮤니케 이션의 중요성을 보여주는 결과이다. 본 연구는 하천재해예방사업 의 리스크관리와 관련된 정책을 수립하고 운영하는 과정에서 유용 한 기초자료로 활용될 수 있을 것이다. 그리고 리스크 관리요인과 커뮤니케이션의 중요성을 규명했다는 점에서 프로젝트성과 연구의 기초자료로 활용될 수 있을 것이다.
Table 7. Goodness of Fit Analysis
Variable R Square (R2) Communality Redundancy
Design Risk .788
Construction Environment Risk .840
Safety Risk .818
Cost Risk .743
Quality Risk .900
Construction Risk .838
Time Risk .723
Communication .872
Project Performance .520 .891 .343
Average value .520 .823 .343
Goodness of fit √ (0.520 × 0.823) = 0.654
Table 8. Results of Hypothesis Testing
Hypothesis Path Path
Coefficient Standard
Error t-value Accept or Reject
1-1 DESIGN RISK -> PROJECT PERFORMANCE -.017 .111 0.151 Reject
1-2 CONSTRUCTION ENVIRONMENT RISK -> PROJECT PERFORMANCE .134 .070 1.918 Accept
1-3 SAFETY RISK -> PROJECT PERFORMANCE .109 .056 1.946 Accept
1-4 COST RISK -> PROJECT PERFORMANCE .189 .062 3.030 Accept
1-5 QUALITY RISK -> PROJECT PERFORMANCE .170 .050 3.418 Accept
1-6 CONSTRUCTION RISK -> PROJECT PERFORMANCE .037 .054 0.681 Reject
1-7 TIME RISK -> PROJECT PERFORMANCE .402 .042 9.545 Accept
* t > 1.645 (p < 0.10), t > 1.960 (p < 0.05), t > 2.576 (p < 0.01)
본 연구는 모집단의 추정이 어려운 관계로 스노우볼 샘플링으로 자료를 수집하였다. 그리고 연구자의 시·공간상의 한계로 설문응답 자를 직접 접촉하지 못하였다. 따라서 연구의 일반화에 관련된 변수 간의 설명력이 높은 연구를 위해서는 많은 모집단 표본을 확보한 추가 연구가 필요할 것으로 판단된다.
감사의 글
이 성과는 2018년도 정부(과학기술정보통신부)의 재원으로 한 국연구재단의 지원을 받아 수행된 연구임(NRF-2018R1A2B60 09111).
Table 9. Result of Moderation Test of Communicatithe RM and PP Relationship
Construction Environment Risk Dependent variable: Project Performance Step 1: main effects
Construction Environment Risk β = 0.029, t = 1.654*
Communication β = 0.029, t = 19.350***
Step 2: two-way interaction term
Construction Environment Risk β = 0.309, t = 2.143**
Communication β = 0.858, t = 7.705***
Construction Environment Risk × Communication β = 0.358, t = 2.162**
Safety Risk Dependent variable: Project Performance
Step 1: main effects
Safety Risk β = 0.072, t = 2.016*
Communication β = 0.631, t = 12.299***
Step 2: two-way interaction term
Safety Risk β = 0.251, t = 2.140**
Communication β = 0.795, t = 9.255***
Safety Risk × Communication β = 0.260, t = 1.836*
Cost Risk Dependent variable: Project Performance
Step 1: main effects
Cost Risk β = 0.164, t = 4.964***
Communication β = 0.626, t = 18.704***
Step 2: two-way interaction term
Cost Risk β = 0.493, t = 5.295***
Communication β = 0.973, t = 10.983***
Cost Risk × Communication β = 0.501, t = 3.995***
Quality Risk Dependent variable: Project Performance
Step 1: main effects
Quality Risk β = 0.144, t = 4.211***
Communication β = 0.614, t = 18.121***
Step 2: two-way interaction term
Quality Risk β = 0.493, t = 5.127***
Communication β = 0.893, t = 11.307***
Quality Risk × Communication β = 0.497, t = 3.728***
Time Risk Dependent variable: Project Performance
Step 1: main effects
Time Risk β = 0.074, t = 1.917*
Communication β = 0.599, t = 14.413***
Step 2: two-way interaction term
Time Risk β = 0.155, t = 1.685*
Communication β = 0.349, t = 2.858***
Time Risk × Communication β = 0.398, t = 2.133**
The values were calculated through bootstrapping with 159 cases and 5000 samples Indicates significance at the * p < 0.10, ** p < 0.05, *** p≤0.01 level of confidence