†Corresponding author: Sang-Mook Lee, Dept. of Hospitality and Tourism Management, Kyungsung University, 309 Suyeong-ro, Nam-gu, Busan
608-736, South Korea, Tel. +82-10-663-4474, Fax. +82-51-627-6830, E-mail. [email protected]
Effect of Food Neophobia on the Relationships among Perceived Service Attributes, Brand Trust, Satisfaction and
Behavioral Intention of Franchise Snack Bar
Sang-Mook Lee
†Dept. of Hospitality and Tourism Management, Kyungsung University
ABSTRACT
This study performed to test the effect of food neophobia on the formulated model on the relationships among perceived service attributes(food, employee, and physical attributes), brand trust, satisfaction and behavioral intention as perceived by franchise snack bar consumers. Total 299 respondents were used for statistical analysis and SPSS 21.0 and AMOS 21.0 program were employed. The findings of current study verified that food attribute among perceived service attributes has positively influence on brand trust and satisfaction, and the employee attribute has only effect on the brand trust. Additionally, the brand trust was critical predictor of satisfaction, but it was not significant antecedent of behavioral intention in context of franchise snack bar restaurant. Furthermore, this study found the moderating effect according to level of food neophobia on the designed hypothesizes, so it has been identified the importance of people’s propensity about food neophobia can significantly effect on brand trust and satisfaction in franchise snack bar restaurant. These findings will contribute to provide meaningful suggestion to develop marketing strategic in franchise snack bar business as well as provide the theoretical evidence in the new segmentation.
Keywords: food neophobia, perceived service attributes, brand trust, satisfaction, behavioral intention, franchise snack bar
INTRODUCTION
Modern consumers may face excessive foods and related industries, so it makes consumer better smart by considering various elements when they buy or select any products inclu- ding foods. The snack bar restaurant industry has been also developed to adapt the fastidious consumers by considering not only taste, price, and amount of foods, but also image of company, environmental elements, convenience and so on (Park, Lee, & Yoo, 2016; Lee, Lee, & Hahm, 2015). Therefore, many companies including franchise snack bar restaurant in foodservice industry keep trying to improve diverse factors according to consider several perceived service attributes to derive positive brand image as well as consumer satisfaction and behavioral intention.
This study is performed to test the relationships among overall service attributes of franchise snack bars and other critical dependent variables such as brand trust, satisfaction, and behavioral intention. To verify the relationships, present
study consider various service factors (food, employee, and physical attributes) perceived by franchise snack bars and identify these factors have an effect on brand trust, satisfaction, and positive intention toward the snack bar restaurants.
In the prior scholars demonstrated the relationships among restaurants’ service factors, food related elements, image, cus- tomers’ satisfaction, and future intention to revisit or recom- mend (Kim & Oh, 2005; Sulek & Hensley, 2004; Wu & Liang, 2009). For instance, previous study revealed that consumers’
behaviors are influenced not only from visible factors such as
restaurants’ interior like physical environment but also by
nonvisible factors such as perceived personal value from
employees (Sulek & Hensley, 2004). In addition, other scholar
demonstrated that the numberous service attributes including
employees service, food, attractiveness, and convenience are
significantly related to consumers’ satisfaction in restaurant
context (Kim & Oh, 2005). Although previous studies reported
the significant relationships among the various visible and
nonvisible service attributes, but verifying the relationships in
context of franchise snack bar restaurant is still insufficient.
In the other words, general restaurant and franchise snack bar business are different service sector and it needs to evaluate to better comprehense the relationships in diverse service sec- tors. Furthermore, the foods especially in snack bar restaurants have been estimated as low quality foods to consumers, even though well-organized franchise companies are consistently investigating for the snack bar restaurant business.
Hence, present study conducted to identify the relationships among perceived service attributes (food, employee, and phy- sical attributes) and other variables in context of franchise snack bar restaurant. In this study, specifically, consumers’
propensity toward food neophobia can be critical moderator on the formulated model, so it was test the moderating effect to find any impacts on the formated hypothesizes.
LITERATURE REVIEW
Food Neophobia
Food neophobia is generally interpreted as a individual cha- racteristics that people can be characterized according as their tendency to avoid or accept unfamiliar food (Piner & Salvy, 2006). Previous study identified that people with high level of food neophobia rated the taste pleasantness of new foods than people who are lower lever of food neophobia (Arvola et al., 1999; Choe & Cho, 2011). Since food neophobia can impact preferences toward unfamiliar foods (Tuorila et al., 2001), better understanding about food selection along with propensity of food neophobia has been an significant issue for food marketers and developers. Especially, the snack food can be recognized a street food or unsanitary food, and it can directly influence on consumers’ food select attribution. There- fore, this study performed the effect of food neophobia’s effect on the formulated model by using Food Neophobia Scale devloped by Pilner & Hobden (1992) to provide practical im- plications for franchise snack bar business.
Perceived Service Attributes
Current study has employed three major attributes : 1) food attribute (e.g., amount, color, temperature), 2) service attribute (e.g., kindness of employee, employee appearance), and 3) phy- sical attribute (e.g., interior or exterior, facilities) to access the
perceived service attributes in context of franchise snack bar restaurants
Food Attribute
Visible factors have considered any representative service or products made by company or manufacturers, and it has been regarded as a fundamental element for successful busi- ness (Wall & Berry, 2007). Various functional factors of foods such as the decoration and variety, taste of food, freshness, and temperature can be important predictor, which has influ- ence on customer’s perceived value, image, and so on. In food-service studies, visible factors were employed as food or food-related elements that can be a crucial clue for successful management in the business (Namkung & Jang, 2007; Wall
& Berry, 2007). The functional elements such as food is con- sistently proved through significant impact on customers’
experience, future behaviors (Choi & Jung, 2006; Quan &
Wang, 2004).
Service Attribute
Service attributes are closely linked to the service providers (Bitner, 1992; Wall & Berry, 2007). In previous studies, some attributes related to employees are used for accessing general service from the destination. Specifically, previous study found that workers’ kindness have positively influence on evaluation of restaurant service and it can derive people’s revisit intention (Grandey et al., 2005). In similar vein, restaurant employees can contribute to built positive brand image and sustainable loyalty directly (Noone, 2008). In prior studies, various factors assessed to measure service attribute such as food, employee, environmental elements, internal factor like emotional aspects, conveience, and so on. Hence, any factors related to humanic clue in foodservice segment are considered as vital antecedents that can affect consumers’ perception about brand trust, satis- faction as well as behavioral intention.
Physical Attribute
Physical attribute is visible and touchable factor that can
be controlled by person, so it has been used as a significant
internal element for successful business (Bitner, 1992). In other
words, the consumers enable receive direct impact because the
visitors can feel through senses from the physical attribute
(Santos, 2002). In previous research, physical attribute has been regarded as an important predictor (Namasivayam &
Mattila, 2007; Suh & Kim, 2011; Choi & Jang, 2006). For instance, physical facility such as music, interior, and scents have a critical impact on visitors final decision in franchise restaurant (Namasivayam & Mattila, 2007). Furthermore, com- fortable equipment can be significant predictor of select attributes in franchise Bakery sector (Choi & Jang, 2006). In sum, physical attribute has been estimated as an essential factor and it can be significant antecedent with various dependent variables in context of franchise restaurant.
Brand Trust
Trust has been defined as a belief of certain brand that customers recognized and the belief is an critical element that affects customers’ final decision when people purchase or re- purchase any brands or service (Chaudhuri & Holbrook, 2001).
For example, a consumer was satisfied from a product or service, it contributes to develop positive brand image and it can lead to trust of the brand (Delgado & Munuera, 2000).
Therefore, if high brand trust was established through percei- ved service attribute (s), it is going to satisfy consumer as well as recommend or repurchase the product/service in the future.
Satisfaction
Satisfaction has been used as a vital determinant factor from long-term consumers future behaviors in the various hos- pitality sector (Chang & Chen, 2008; Mithas et al., 2005;
Oliver, 1980). Numerous studies have demonstrated the rela- tionships among the diverse antecedents along with dependent factors to better comprehend consumers’ level of satisfaction (Hing, 2013; Kim & Kim, 2016). For instance, Kim & Kim (2016) identified positive relationships among predictors (e.g., visible and nonvisible factors), brand value, and satisfaction.
Therefore, current study has been considered the satisfaction as an important dependent variable as well as vital mediator between other predictors and behavioral intention.
Behavioral Intention
Behavioral intention is kind of personal efforts to achieve a desired goal, and it has been identified as a direct antecedent of customer future behavior (Ryu & Han, 2010; Warshaw &
Davis, 1985). Warshaw and Davis (1985) defined behavioral intention as the degree to which a person has formulated a conscious plan to perform or not perform some specified future behavior.
In foodservice contexts, numerous studies shown that be- havioral intention is an outcome variables that influenced by other constructs (Jang & Namkung, 2009; Parasuraman, Zei- thaml, & Berry, 1985; Oliver, 1980). Therefore, the present study proposes that positive brand trust and satisfaction associates with positive behavioral intention in franchise snack bar restaurants.
METHODOLOGY
Current study distributed total of 350 questionnaires over about two weeks from October 1
stto 17
th, 2016 in Busan area.
From the collected data 51 respondents were not included for the statistical analysing because of unfaithful respondents and unsuitable data through outlier verification method. Total 299 questionnaires were analyzed by SPSS 21.0 and AMOS 21.0.
The confirmatory factor analysis and structural equation mo- deling (SEM) have been employed to verified the formulated hypothesizes along with general statistical analysis including frequency analysis and reliability analysis.
The moderating effect of food neophobia was confirmed by comparing constrained model and unconstrained model. Es- timation of the significant differences in Chi-square value between the constrained model and unconstrained model, with one degree of freedom, used the critical value of 3.84 at the 0.05 level of significance (Anderson & Gerbing, 1988). The differences between high level of food neophobia and low level of food neophobia was only with respect to each path’s coefficient, so the constrained model sets each of the structural coefficients to be equal between the two groups, but the un- constrained model allows this parameter to vary among groups.
RESULTS
Demographic Information
The demographic results shows that male was 51.8% and
female was 48.2%. The average monthly visiting indicates that
34.8% people were the largest group visiting 2 times for a
Table 1. General characteristics of the subjects
Characteristic n %
Gender
Male 155 51.8
Female 144 48.2
Average monthly visit (times)
1 37 12.4
2 104 34.8
3∼4 84 28.1
5∼6 41 13.7
Over 7 33 11.0
Companion
Family 11 3.7
Couple 47 15.7
Friend 206 68.9
Colleague 2 0.7
Alone 32 10.7
Others 1 0.3
Average payment per visit
Under 3,000 9 3.0
3,001∼5,000 82 27.4
5,001∼10,000 179 59.9
10,001∼20,000 29 9.7
Total 299 100.0
month on average followed by 3 ∼4 times (28.1%), 5∼6 times (13.7%). In addition, almost 70% respondents visited the fran- chise snack bar restaurants with their friends, and around 60%
consumers are spending between 5,001 ∼10,000 won followed by 3,001 ∼5,000 won (27.4%) when they visit a franchise snack bar restaurant.
Measurement Model and Discriminant Validity Analysis
1) CFA
To verify the structure of the six variables: food attribute, service attribute, physical attribute, brand trust, satisfaction, and behavioral intentions, present study identified reliability, unidimensionality, and validity of the factors before analyzing the structural model. The scores of Cronbach’s alpha confirm- ed the internal consistency of the constructs on the formulated model and the reliability of the measurement. The results indicated that the ranges of Cronbach’s alpha for the constructs (0.797 to 0.932) were acceptable for the level of internal con-
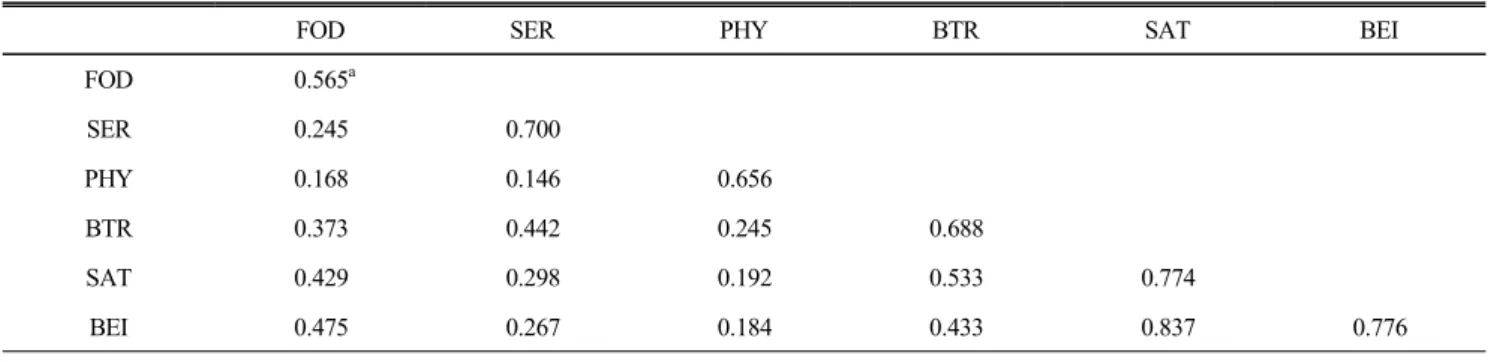
sistency (Nunnally, 1978). The ranges of composite reliabili- ties (0.795 to 0.912) were also suitable (Fornell & Larcker, 1981). Average variance extracted (AVE) of the variables (0.565 to 0.776) were sufficient according to the suggested level (Fornell & Larcker, 1981).
Discriminant validity was confirmed by comparing the AVE scores with the squared correlation between constructs (Fornell & Larcker, 1981); the range of AVE (0.565 to 0.776) exceeded the range of squared correlations for each pair of constructs (0.168 to 0.533) except the relationship between satisfaction and behavioral intention. Therefore, the two con- structs was combined to make constrained model and compared the Chi-square difference the two model. Result found that the Chi-square difference was significant and verified the two constructs’ discriminant validity. In addition, confirmatory mea- surement models identified the reliability of the measurement properties (χ
2=370.282, p<0.05, χ
2/df=2.128, Incremental fit index (IFI)=0.960, Tucker Lewis index (TLI)=0.951, Compara- tive fit index (CFI)=0.960, Goodness-of-fit index (GFI)= 0.890, and Root mean square error of approximation (RMSEA)=
0.062) (Table 2).
2) SEM
The results of structural equation modeling (SEM) validated the formulated model and tested assessment of the hypotheses.
The Chi-square statistic for the structural model was 361.676 with 175 degrees of freedom (p<0.01; CMIN/DF=2.067; IFI=
0.962; TLI=0.954; CFI=0.962, GFI=0.893, and RMSEA=0.060), so general model fit was acceptable based on previous study reported by Anderson & Gerbing (1988). Table 4 indicates the path coefficients for all hypothesized paths in current model.
The results shown that Hypothesis 1 and 2, which assumed that food attribute of the franchise snack bar restaurant would positively influence both brand trust (H1: β=0.317, t=4.882;
p<0.001) and consumer satisfaction (H2: β=0.345, t=4.993, p<
0.001) received support. Also, Hypothesis 3, which assumed
that service attribute positively influences brand trust received
support (H3: β=0.432, t=6.991, p<0.001). Likewise, Hypothesis 5,
which indicated that physical attribute was critical antecedent
of brand trust (H5: β=0.199, t=3.615, p<0.001). Furthermore,
current study verified that brand trust was significant predictor
of satisfaction (H7: β=0.458, t=5.867, p<0.001) and the satis-
Table 2. Confirmatory factor analysis and discriminant validity
FOD SER PHY BTR SAT BEI
FOD 0.565
aSER 0.245 0.700
PHY 0.168 0.146 0.656
BTR 0.373 0.442 0.245 0.688
SAT 0.429 0.298 0.192 0.533 0.774
BEI 0.475 0.267 0.184 0.433 0.837 0.776
χ
2=370.282, d.f.=174, IFI=0.960, TLI=0.951, CFI=0.960, GFI=0.890, RMSEA=0.062
FOD=Food attribute, SER=Service attribute, PHY=Physical attribute, BTR=Brand trust, SAT=Satisfaction, BEI=Behavioral intention, IFI=Incremen- tal fit index, TLI=Tucker-Lewis index, CFI=Comparative fit index, GFI=Goodness-of-fit index, RMSEA=Root mean square error of approximation.
Note: a AVE is on the diagonal. Squared of paired constructs are on the off-diagonal.
Table 3. Structural parameter estimates
Hypothesized path Coefficient
t-valueResults Hypothesis 1: Food attribute
→ Brand trust 0.317 4.882
***Supported Hypothesis 2: Food attribute
→ Satisfaction 0.345 4.993
***Supported Hypothesis 3: Service attribute
→ Brand trust 0.432 6.991
***Supported Hypothesis 4: Service attribute
→ Satisfaction 0.060 0.978 Not
supported Hypothesis 5: Physical attribute
→ Brand trust 0.199 3.615
***Supported Hypothesis 6: Physical attribute
→ Satisfaction 0.056 1.070 Not
supported Hypothesis 7: Brand trust
→ Satisfaction 0.458 5.867
***Supported Hypothesis 8: Brand trust
→ Behavioral intention —0.045 —0.799 Not supported Hypothesis 9: Satisfaction
→ Behavioral intention 0.958 14.472
***Supported χ
2=361.676, d.f.=175, IFI=0.962, TLI=0.954, CFI=0.962, GFI=0.893,
RMSEA=0.060
* p<0.05, ** p<0.01, *** p<0.001.
faction was significant predictor of behavioral intention (H9:
β=0.958, t=14.472, p<0.001) on the model. However, the relationship between service attribute and satisfaction (H4: β=
0.060, t=0.978), physical attribute and satisfaction (H6: β=
0.056, t=1.070), and brand trust and behavioral intention (H8:
β= —0.045, t=—0.799) were not supported in current study.
These findings show that critical elements of service attributes that can differently influence on brand trust and customer sa- tisfaction in context of franchise snack bar restaurants, and the relationships among brand trust, satisfaction, and behavioral intention need to be identified in various sectors.
Moderating Effect
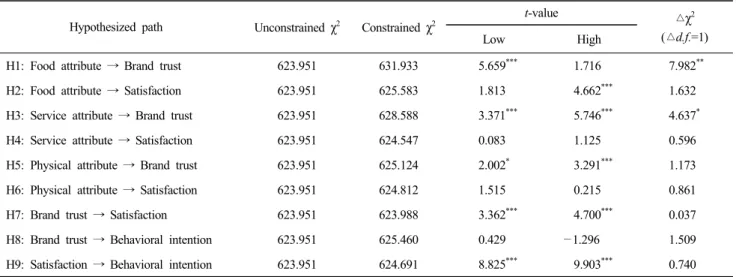
To prove the influence of perception toward food neopho- bia on formulated nine paths, chi-square differences has been compared the two models (constrained model versus uncon- strained model) with one degree of freedom for each of the three paths’ coefficients. The χ
2score from the unconstrained model was subtracted from the χ
2score of the constrained model. Table 4 indicates the differences of χ
2between the unconstrained model and the constrained model on constructs along with the t-value of the two different level of food neophobia group: high and low. The results demonstrated that there were moderating effects from two paths for the associ- ation between food attribute and brand trust for the difference of χ
2between the constrained model (χ
2=631.933, df=176) and the unconstrained model (χ
2= 623.951, df=175) was significan- tly different at p<0.001 level (Δχ
2=7.982, df=1). In addition, the relationship between service attribute and brand trust for the difference of χ
2between the constrained model (χ
2= 628.588, df=176) and the unconstrained model (χ
2=623.951, df=175) was also significantly different at p<0.05 level (Δχ
2= 4.637, df=1).
In addition, the differences of t-value identified which group
has more significant influence on the relationships. Interes-
Table 4. Moderating effects of level of food neophobia
Hypothesized path Unconstrained χ
2Constrained χ
2t-value
△ χ
2(△d.f.=1)
Low High
H1: Food attribute → Brand trust 623.951 631.933 5.659
***1.716 7.982
**H2: Food attribute → Satisfaction 623.951 625.583 1.813 4.662
***1.632
H3: Service attribute → Brand trust 623.951 628.588 3.371
***5.746
***4.637
*H4: Service attribute → Satisfaction 623.951 624.547 0.083 1.125 0.596
H5: Physical attribute → Brand trust 623.951 625.124 2.002
*3.291
***1.173
H6: Physical attribute → Satisfaction 623.951 624.812 1.515 0.215 0.861
H7: Brand trust → Satisfaction 623.951 623.988 3.362
***4.700
***0.037
H8: Brand trust → Behavioral intention 623.951 625.460 0.429 —1.296 1.509
H9: Satisfaction → Behavioral intention 623.951 624.691 8.825
***9.903
***0.740
* p<0.05, ** p<0.01, *** p<0.001.