- 289 -
An air flow resistance model for a pressure cooling system based on container stacking methods
Oui-Woung Kim1, Hoon Kim1, Jae-Woong Han2, Hyo-Jai Lee1*
1Division of Convergence Technology, Korea Food Research Institute, Sungnam 463-420, Korea2 Division of Bio-Industry Engineering, Kongju National University, Yesan 340-702, Korea
차압예냉에서 청과물 상자의 적재방법에 따른 송풍저항 예측모델 개발
김의웅1․김훈1․한재웅2․이효재1*
1한국식품연구원 융합기술연구본부, 2공주대학교 생물산업기계공학전공
Abstract
The capacity of a pressure fan can be designed based on the air flow resistance of containers packed with fruits and vegetables in a pressure cooling system. This study was conducted to develop an air flow resistance model that was dependent on changes in the air flow rate and the method of stacking containers. The air flow resistance of a container packed with uniformly shaped balls was 1.5 times greater than the sum of the air flow resistance of a vacant container and that of a wire net container packed with only balls. In addition, the air flow resistance increased exponentially as the width of the stacks increased; however, the air flow resistance did not increase greatly as the length and height of the stacks increased, which indicates that the air flow resistance is primarily influenced by the width of the stack in the air flow direction. The air flow resistance in two lines of stacking was up to 17% less than that of the width of the stack. It was also possible to determine the air flow resistance using a function of the air flow resistance through a single container and develop a prediction model. A prediction model of air flow resistance that is dependent on the stacking method and the air flow resistance of a single container was developed.
Key words:air flow rate, cooling deviation, cooling rate, pressure fan
Introduction
1)
The precooling of fruits and vegetables is used as an initial process in low-temperature distribution systems as a quality control measure. Because this process removes the field heat and thereby delays respiration, enzymatic reaction and metabolism, it also restrains the propagation of microorganisms before storage and the transfer of cultivated agricultural products (1,2).
Pressure cooling was developed to improve weaknesses in room precooling and forced-air cooling when the cooling
*Corresponding author. E-mail:[email protected] Phone:82-31-780-9043, Fax : 82-31-780-9059
rate is slow and cooling deviations are large. Pressure cooling using a pressure fan or pressure cover can accelerate the cooling rate by increasing the amount of effective cooling air flowing in containers packed with fruits and vegetables.
Pressure cooling is considered the best method of cooling with respect to cooling rate, cooling deviation and cost of the overall system (3,4). In evaluating commercial cherry coolers, it was found that the effectiveness of room cooling to be variable, depending on the management and adequacy of refrigeration and air circulation, the spacing and positioning of the containers and the time allowed for cooling (5).
Forced-air cooling was developed for rapid removal of ground heat from fruits and vegetables (6). Pressure cooling systems are used in many countries, including Japan and the USA.
of reliable experiments but rather on the basis of experience due to a lack of research on precooling (7,8). This has been particularly problematic in Japan, where air flow resistance was not precisely measured in many cases of failure due to an over-range design of the pressure fan (9). Air flow resistance is caused by the resistance of objects to the flow of cooling air. When air flow resistance increases, high static pressure is needed, and the air flow rate dramatically decreases. This causes cooling deviations, a decrease in the cooling rate of fruits and vegetables and an increase in energy consumption.
Therefore, a method to precisely estimate air flow resistance is needed for the efficient design and operation of a pressure cooling system. Air flow resistance varies primarily with the stacking shape of fruits and vegetables within containers, the shape of the containers and the method used to stack the containers. In addition, air flow resistance in the stacking bed of fruits and vegetables is affected by the shapes of fruits and vegetables, the method of stacking, the void fraction and the shapes of the pores. The air flow resistance of the container is affected by the opening ratio, size, shape, number and locations of the container’s ventilating holes.
However, when fruits and vegetables are stacked in the containers, they block the ventilating holes. Therefore, the air flow resistance through containers packed with fruits and vegetables is greater than the sum of the air flow resistance through empty containers and the air flow resistance through stacks of fruits and vegetables not in containers (10). In addition, because many types of fruit, such as pears and peaches, are wrapped individually to protect them from impacts and maintain their freshness, the relationship between the components of air flow resistance and the total air flow resistance is different. It was reported that air flow resistance through a single container is proportional to the air flow rate to a power of “m” and the opening ratio to a power of “n”
(11). It was reported that air flow resistance is proportional to the air flow rate to the second power (10,12). Nevertheless, there is a huge discrepancy between the results of the different models, even though the same air flow rate and opening ratio data were used. This discrepancy is most likely due to the low of the size, shape, location, and number of ventilating holes.
The air flow resistance through containers stacked in the air flow direction was measured (13,14). It was assumed that the outflow rate of cooling air through gaps between
into the containers through ventilating holes and, based on air flow resistance (A mmH2O) through as ingle container, estimated that when N containers were stacked in the air flow direction, the air flow resistance should be to obtain the same cooling rate in a single container (9). The air flow resistance through empty corrugated fiberboard containers was measured when different stacking methods were employed but found it difficult to obtain a general air flow resistance formula for this experiment (15). The cooling air flow rate through the gaps between 24 stacked containers packed with Tsugaru apples was measured in a pressure cooling system that was 20 m2in size. The cooling air flow rate through the gaps between the containers was 1.3~1.7 times greater than the effective cooling air flow rate; however, the effects of gaps on variations in air flow resistance were not analyzed.
Therefore, this study was conducted to develop an air flow resistance formula that takes into account changes in the air flow rate through a single container and a total air flow resistance model that depends on the method used to stack the containers. To develop these models, the air flow resistance at different air flow rates through a single container was measured, and the air flow resistance when different stacking methods were employed using uniformly shaped balls and acrylic containers was measured. In addition, the changes in the air flow resistance affected by the various gaps between the containers were analyzed using data from previous experiments (15).
Materials and Methods
Experiment apparatus
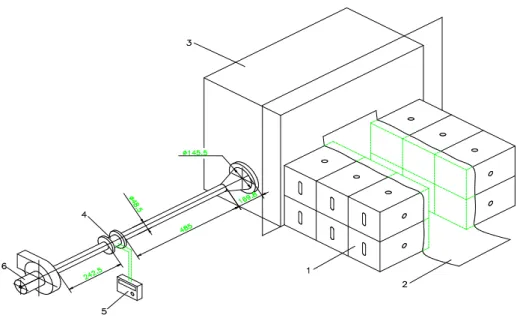
The equipment used to measure air flow resistance at different air flow rates and with different stacking methods consisted of a pressure room, a vent hole, a pressure cover, containers, a flow nozzle, and a fan (Fig. 1) set up to measure air flow resistance. The pressure cooling room and vent hole were 0.5×0.4×0.52 m(L×W×H) and 0.1×0.2 m(L×H), respectively. The fan (a centrifugal fan, 1 kW, 6 m3/min×50 mm H2O) had a variable-speed motor to control the air flow rate, and the flow nozzle (Φ0.05 m) was used to measure the air flow rate. A duct based on the Korean standard (KSA0612) for measuring the air flow rate was installed.
1. Container 2. Sheet 3. Plenum chamber 4. Flow nozzle 5. Digital manometer 6. Fan
Fig. 1. Schematic diagram of the experimental apparatus to measure the air flow resistance of stacked containers.
Two types of containers were used in these experiments.
The first type (Type A) was the same size as a 15-kg apple box and was used to examine the properties of air flow resistance at different air flow rates. The second type (Type B) was smaller and was used to measure the air flow resistance when different stacking methods were employed. The dimensions of the Type A container were 0.5×0.27×0.36 m (L×W×H), and it was made of acrylic resin that was 0.003 meter thick. Two ventilating holes (13.54 cm2, a rectangle of 0.052×0.02 m plus two semicircles of Φ 0.02 m) were bored in the side of the container. The side of the container with the two ventilating holes was separable so that when the side of the container was removed, it was possible to replace it with a wire net to maintain the shape of the stacked fruits and vegetables. The type B container had dimensions of 0.125×0.180×0.135 m (L×W×H), which are 1/4, 1/2, and 1/2 of a 15-kg apple box’s length, width, and height, respectively. The type B containers were made of acrylic resin that was also 0.003meter thick. Three ventilating holes, one rectangle (0.001 m × 0.028 m) and two semicircles (diameter=0.001 m, 3.59 cm2), were bored in the side of the type B containers. In addition, three holes (Φ 0.009 m) were bored in the top of each container and one hole (Φ 0.009 m) was bored in the side of each container to measure the air flow velocity through the ventilating hole and the static pressure in the container.
Experimental methods
To measure the air flow resistance through a single container, uniformly shaped tennis balls were used instead of fruits and vegetables. In the empty Type A container, the air flow resistance was measured under two different conditions. First, the container was packed with balls, and the acrylic wall was removed from the side of the container and replaced with a wire net. The wire net was then removed from the side of the container, and the wire net was replaced with the acrylic wall. In these experiments, the air flow resistance was measured using the variable-speed motor in the fan, and the air flow rate ranged from 2.5–10.0 m3/min.
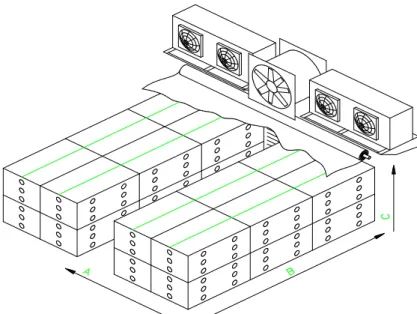
The effect of the stacking method on air flow resistance was measured at each air flow rate by changing the number of containers and the stacking methods. Between 2 and 8 containers were stacked along air flow direction A, stack length direction B, and stack height direction C (Fig. 2). The gaps between the containers were blocked using polypropylene tape to eliminate the effect of the air flow resistance of the gaps. The resulting air flow rate ranged from 8.0 to 26.5 m3/min/m2.
To determine the influence of the gaps between the containers on the air flow resistance, corrugated fiberboard containers were packed with Tsugaru apples under the same conditions (15), and the resulting air flow resistance through a single container was measured at air flow rates ranging from 1.8 to 8.0 m3/min/m2 (Fig. 3).
A. width of stack in air flow direction B. length of stack C. height of stack Fig. 2. Schematic diagram of the method to stack the containers.
Static pressure was measured using a digital pressure- measuring instrument (VELOCICAL 8360, TSI Incorporated, USA) whose resolving power is 0.254 mmH2O, and the static pressure around the flow nozzle was converted to an air flow rate based on the Korean standard (KSA0612).
Results and Discussions
Air flow resistance through a single container
A general formula for the air flow resistance through a single container was difficult to obtain because of the many variables involved, including the opening ratio, shape, size, and number of ventilating holes. In addition, when the packing containers contained fruits and vegetables, the air flow resistance was not equal to the sum of the air flow resistance through empty containers and through the stacks of fruits and vegetables.
In this study, the air flow resistance was measured at different air flow rates. The results obtained showed that the air flow resistance through the container packed with balls was over 1.5 times higher than the sum of the air flow resistance through the empty container and through the fruit and vegetable stacks. These results are similar to those obtained (10). This discrepancy is believed to be due to the presence of balls that blocked portions of the ventilating holes.
Fig. 3. Comparison of the air flow resistance through packed only balls, empty container and container packed with balls.
The relation between air flow resistance and air flow rate is expressed as follows.
× (1)
where ∆ is the air flow resistance[mmH2O], V is the air flow rate[m3/min/m2] and K and m are experimental constants.
The constants obtained by the least squares method for this relation are shown in Table 1.
Table 1. Constants in equation(1)
Constants Empty container Packed balls only Container packed with balls
K 648.63 338.77 1023.29
M 2.08 2.15 2.01
r² 0.998 0.986 0.997
Air flow resistance when different stacking methods were employed
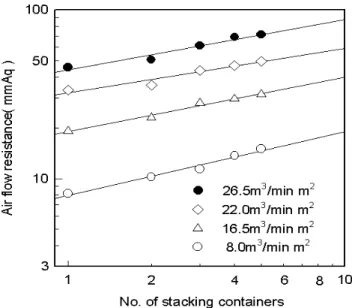
To determine the effects of stacking containers in the air flow direction, air flow resistance was measured for a range of air flow rates from 8.0 to 26.5 m3min-1per m2with five Type B empty acrylic containers stacked in arow. In this experiment, the air flow resistance was found to increase exponentially as the number of stacked empty containers increased from 1 to 5 (Fig. 4).
Fig. 4. Relationship between the air flow resistance through empty containers and the number of containers stacked in the air flow direction at different air flow rates.
Based on the air flow resistance of a single container, the air flow resistance for a number of containers stacked in the air flow direction was found to be proportional to the number of containers to the power of “N,” and the value of the experimental constant “n” was found to be 0.27 using the least squares method.
× (2)
where is the air flow resistance (mmH2O) when stacking N containers in the air flow direction, is the air flow resistance (mmH2O) through a single container, N is the number of containers stacked in the air flow direction and n is the experimental constant.
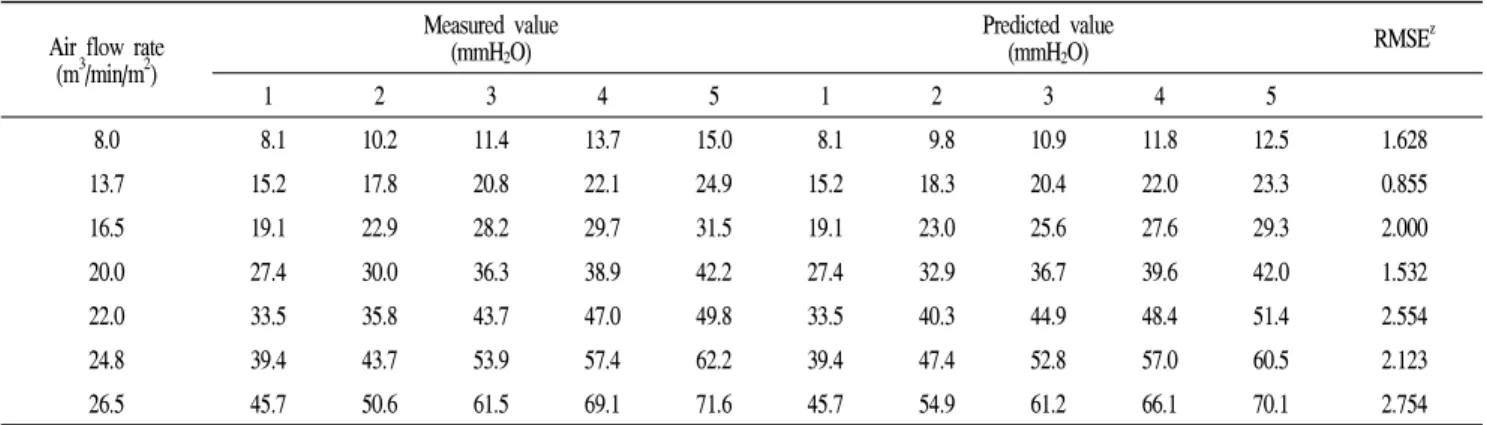
The RMSE of the predicted versus the measured values ranged from 0.855 to 2.754 mmH2O (Table 2). The coefficient of determination of the measured versus predicted values was 0.931, which indicates a strong relationship between the air flow resistance and the number of containers stacked in the air flow direction.
The air flow resistance in the two-line stacking system was measured using the same stacking method used in the pressure cooling system with the central vent type. Containers were placed in two rows at the right and left side of the center vent line, and the air flow resistance was measured after stacking 2 to 8 in the length direction and 2 to 6 containers in the height direction. The results of these experiments showed that no matter how many containers were stacked in the length and height directions, the air flow resistance did not change at a given air flow rate.
The relationship between the total air flow resistance and the air flow resistance through the width of the stack is shown in Fig. 5. The slight difference between the total air flow resistance and the air flow resistance through containers stacked in the air flow direction is considered to be influenced by the center vent line of the system (r2=0.989).
× ∆ (3) where : total air flow resistance (mmH2O) in the
two-line stacking system
: air flow resistance (mmH2O) through containers in the air flow direction In two-line stacking and with a pressure cooling system of the central vent type, it is possible to determine the total air flow resistance. In this calculation, the static pressure of the pressure fan must be expressed as a function of the air flow resistance through a single container, as shown below.
× × (4) where ∆ : total air flow resistance (mmH2O)
∆ : air flow resistance (mmH2O) through a single container
N : the number of containers stacked in the air flow direction
n : an experimental constant
Table 2. Comparison of measured and predicted air flow resistance through containers stacked in the air flow direction Air flow rate
(m3/min/m2)
Measured value
(mmH2O) Predicted value
(mmH2O) RMSEz
1 2 3 4 5 1 2 3 4 5
8.0 8.1 10.2 11.4 13.7 15.0 8.1 9.8 10.9 11.8 12.5 1.628
13.7 15.2 17.8 20.8 22.1 24.9 15.2 18.3 20.4 22.0 23.3 0.855
16.5 19.1 22.9 28.2 29.7 31.5 19.1 23.0 25.6 27.6 29.3 2.000
20.0 27.4 30.0 36.3 38.9 42.2 27.4 32.9 36.7 39.6 42.0 1.532
22.0 33.5 35.8 43.7 47.0 49.8 33.5 40.3 44.9 48.4 51.4 2.554
24.8 39.4 43.7 53.9 57.4 62.2 39.4 47.4 52.8 57.0 60.5 2.123
26.5 45.7 50.6 61.5 69.1 71.6 45.7 54.9 61.2 66.1 70.1 2.754
zRoot mean square error
Fig. 5. Relationship between the total air flow resistance and air flow resistance of the width of the stack in the two line stacking system.
Influence of gaps between containers on air flow resistance The air flow resistance in the pressure cooling system is influenced by gaps between the containers, the air flow resistance through containers stacked in the air flow direction, and the air flow resistance along the vent line (15).
A corrugated fiberboard container was packed with Tsugaru apples and the air flow resistance through a single container was measured with the equipment shown in Fig.
1. The results of these experiments at different air flow rates are shown in Fig. 6. The values of the experimental constants obtained using the least squares method were K=987.87 and m=2.38, and the coefficient of determination obtained was 0.995.
In the case of the air flow resistance through a single
container, the air flow resistance in the air flow direction and total air flow resistance were determined to be 8.2 mm H2O, 7.5 mmH2O and 16.1 mmH2O for pressures in the pressure room of 10 mmH2O, 18.8 mmH2O and 20 mmH2O, respectively. The air flow resistance is believed to have been lower than the pressure in the pressure room because of the gaps between containers.
For pressures in the pressure room of 10 mmH2O and 20 mmH2O, the values of the constants obtained by applying the effective cooling air flow rate in a container were n=0.70 and n=1.08, respectively. These values are greater than n=0.27, which was the value obtained when the influence of the gaps between containers was ignored, but are less than the value of n=3 estimated (9). Because the typical pressure in a pressure room is approximately 20 mmH2O, these values can be used in the design of a pressure fan.
Fig. 6. Air flow resistance of a container packed with apples.
요 약
차압예냉시스템을 설계하기 위해서는 송풍저항을 정확 하게 예측해야 하며, 송풍저항은 청과물의 적재방법에 따 라 크게 달라진다. 본 연구는 차압예냉시스템에서 송풍량 에 따른 송풍저항식과 상자의 적재방법별로 송풍저항을 측정할 수 있는 모델을 개발하기 위하여 수행되었다. 공을 퇴적한 모형상자에서의 송풍저항은 빈 상자에서의 송풍저 항과 공 퇴적층만의 송풍저항을 합한 값보다 1.5배 정도 높게 나타났다. 또한, 적재상자에서의 송풍저항은 통기폭 방향 적재상자수의 증가에 따라 지수적으로 증가하였으나, 적재길이와 적재높이의 영향은 거의 받지 않았다. 상자를 2열로 적재하는 차압예냉시스템에서 송풍저항은 1개 상자 에서의 송풍저항을 기초로 예측이 가능하였으며, 예측모델 을 제시하였다.
References
1. Chagn MS, Lee DU, Cho SD, Jhune CS (2012) Survey on packing status and effects of precooling on the quality ofAgaricus bisporus. Korean J Food Presev, 12, 67-73 2. Park S (2003) Storage enhancement of grape through precooling process. Korean J Food Sci Technol, 35, 1093-1097
3. Parsons RA, Mitchell FG, Mayer G (1972) Forced-air cooling of palletized fresh fruit. Trans ASAE, 15, 729-731 4. Puttaraju TB, Reddy TV (1997) Effect of precooling on the quality of mango (cv. ‘Mallika’). J Food Sci Technol, 34, 24-27
5. Micke WC, Mitchell FG, Maxie EC (1965) Handling
sweet cherries for fresh shipment. Calif Agri, 19, 12-13 6. Guillou R (1960) Coolers for fruits and vegetables. Calif
Agri Expt Sta Bul, USA, 733, p 6
7. Ishibashi S, Shiga T, Tanaka S (1989) Fundamental concept and procedure of cooling. Refrigeration, 64, 127-137
8. Wu Z, Miao Y (2008) Mathematical model of spheral fruit-vegetable in the pressure-difference precooling. J Anhui Agri Sci, 4, 1279-1280
9. Okubo M (1991) Keeping fresh of vegetable. Yokendo, Tokyo, Japan, p 90-108
10. Yoon HS, Cho YK, Park KK (1995) Resistance to air flow through packed fruits and vegetables in vented box.
J Korean Soc Agri Mach, 20, 351-359
11. JA equipment & material division (1982) Precooling system of green grocery. JA, Tokyo, Japan, p 1-80 12. Chau KV, Gaffney JJ, Baird CD, Church GA (1985)
Resistance to air flow of oranges in bulk and in cartons.
Trans ASAE, 28, 2083-2088
13. Aus United Fresh (1989) Fresh produce manual -handling storage practices for fresh produce-. Fruit and Veg Assn Ltd, Aus, p 25-44
14. Tanaka S, Ishibashi S, Nakano K (1991) Development of the pressure cooling system (part 2) - Resistance to air flow of agricultural containers. Trans JAR, 8, 213-220 15. Kim OW, Kim BS, Nahm GB, Jeong JW, Kim DC, Keum DH (1995) The effect of air vent hole and stacking methods of fruit and vegetables boxes on static pressure drop in pressure cooling system. J Korean Soc Agri Mach, 20, 360-367
(접수 2012년 11월 12일 수정 2013년 6월 21일 채택 2013년 6월 24일)