Predicting the Greenhouse Air Humidity Using Artificial Neural Network Model Based on Principal Components Analysis
PCA에 기반을 둔 인공신경회로망을 이용한 온실의 습도 예측
Abdulhameed B. Owolabi
*・ Jong W Lee
**・ Shanika N. Jayasekara
*・ Hyun W. Lee
*,**,†오우라비압둘하메드바바툰데 ・ 이종원 ・ 메쓰캄카남즈사니카닐란가니자야세카라 ・ 이현우
Abstract
A model was developed using Artificial Neural Networks (ANNs) based on Principal Component Analysis (PCA), to accurately predict the air humidity inside an experimental greenhouse located in Daegu (latitude 35.53°N, longitude 128.36°E, and altitude 48 m), South Korea. The weather parameters, air temperature, relative humidity, solar radiation, and carbon dioxide inside and outside the greenhouse were monitored and measured by mounted sensors.
Through the PCA of the data samples, three main components were used as the input data, and the measured inside humidity was used as the output data for the ALYUDA forecaster software of the ANN model. The Nash–Sutcliff Model Efficiency Coefficient (NSE) was used to analyze the difference between the experimental and the simulated results, in order to determine the predictive power of the ANN software. The results obtained revealed the variables that affect the inside air humidity through a sensitivity analysis graph. The measured humidity agreed well with the predicted humidity, which signifies that the model has a very high accuracy and can be used for predictions based on the computed R2 and NSE values for the training and validation samples.
Keywords: Greenhouse, Artificial neural network, Principal component analysis, Inside humidity
*
Department of Agricultural Engineering, Institute of Agricultural Science & Technology, Kyungpook National University
**
Institute of Agricultural Science & Technology, Kyungpook National University
† Corresponding author
Tel.: +82-53-950-5736 Fax: +82-53-950-6752 E-mail: [email protected]
Received: July 26, 2017 Revised: September 1, 2017 Accepted: September 12, 2017
Ⅰ. Introduction
Greenhouses provide a controlled environment for plant production, with sufficient sunlight temperature and humidity.
The greenhouse heats up because the incoming solar radiation from the sun warms the plants, soil, and other elements inside the building faster than the heat can escape from the structure (Okunlola, 2013). The air warmed by the heat from the hot interior surfaces is retained in the building by the roof and walls. Hence, at night, when the temperature drops as the air cools to the dew point, condensation occurs and water droplets are formed on the plant surfaces. The moist air condenses on the plant because the dew point temperature inside the green-
house is high. This process results in high humidity, on which the growth and development of all major greenhouse vege- tables and fruits is based (Bakker, 1991). This humid environ- ment is the result of complex mass exchanges between the inside air, the multiple elements in the greenhouse, and the outside boundaries (Fen and Chengwei, 2010). The humidity inside the greenhouse increases, owing to plant transpiration, irrigation, and insulation of the structure, which may lead to loss of crop quality when the plant is exposed to fungal diseases of varying severity, calcium deficiency, and scarcity of water (Fen and Chengwei, 2010).
The principal component analysis (PCA) is a variable reduction technique used to reduce highly correlated variables into a smaller number of principal components, while retaining the properties of all the variables. It is also a mathematical analysis method used in substituting a few linear combi- nations of the original variables (Fen and Chengwei, 2010).
It reveals the relations between the original variables, and translates them into less integrative variables. The PCA re- orients the data so that the multiplicity of original variables can be summarized by relatively few components that capture the maximum possible information (variations) from the
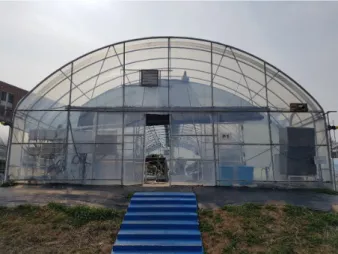
Fig. 1 Experimental greenhouse at Daegu (latitude 35.53°N, longitude 128.36°E)
original variables. In this case, these few components can be further used to predict the air humidity inside a greenhouse using an artificial neural network (ANN).
ANNs are relatively crude electronic models based on the neural structure of the brain (Owolabi et al., 2016). It is a non-linear mathematical model that imitates the way in which the human brain interprets graphical information (Carvajal et al., 2006). Since the mid-1980s, ANNs have been used in economic, energy, and environmental modeling, and for extending the field of statistical methods (Pahlavan et al., 2012). The back propagation neural network has extensively been applied in many fields of engineering in order to perform some types of non-linear processing on data generated by a wide variety of systems. Ehret et al. (2008) described the ANNs as non-linear modeling techniques that find patterns in data sets. They have been praised as the wave of the future in computing, because they are self-learning mechanisms that do not require the traditional skills of a programmer (Owolabi, et al., 2016). Moreover, ANNs have achieved popularity as tools that can model complex systems with greater efficiency and less time consumption compared to other mathematical models, because they require no assumptions in the form of fitting functions. Instead, ANNs are trained with experimental data to find the relationships (Pahlavan et al., 2012).
Ferreira et al. (2002) and Ruano et al. (2006) used ANN models to predict the air temperature inside greenhouses.
Fourati and Chtourou (2007) and Seginer (1997) used neural networks to control the overall environmental condition of greenhouses. Trigo and Palutikof (1997) used an ANN for the daily simulations of temperature in Portugal. However, Fen and Chengwei (2010) are the only researchers that have combined the ANN with the PCA to predict the air humidity inside a greenhouse. They considered weather parameters that are different from those used for this research, and their work did not include a sensitivity analysis of the model for determining the actual variables that affect the inside air humidity in the greenhouse.
The main purpose of a greenhouse is to improve the environmental conditions in which plants are grown (Ferreira et al., 2002) and, when provided with the appropriate equip- ment, these conditions can be further improved by means of climate control. The greenhouse climate is mainly influenced by three factors: the weather both inside and outside, the
actuators, and the crops. For efficiently controlling the green- house climate environment, these influences must be taken into consideration, which is achievable only by the use of models. The main objective of this work was to develop a model that accurately predicts the inside humidity of a greenhouse by means of an ANN based on PCA, and use the model to determine the variables from the principal com- ponents that affect the inside humidity.
Ⅱ. Materials and Methods 1. Experimental data
The experimental greenhouse is located at the Kyungpook National University (KNU) in Daegu (latitude 35.53°N, longitude 128.36°E, and altitude 48 m), South Korea. It was designed as a round shaped, single-span greenhouse covered with a double-layered polyethylene (PE) material, as shown in Fig. 1. The dimensions of the greenhouse are 8.4 m (W)
×4 m (H) ×22 m (L), with a total volume and floor area of 556.8 m3 and 184.8 m2, respectively. Strawberries were planted inside the greenhouse that comprises of 6 gutters built for the planting which was filled with coconut coir and the supply of water with nutrients were done through drip irrigation system.
The night and day temperature inside the greenhouse was set as 10 oC and 25 oC respectively after the installation of boiler.
The weather data were measured for the complete autumn season from September 1 to November 30 2016. Generally,
Table 1 The weather data used for the simulations
Weather parameter Unit Time interval Sensor Data recorded
Temperature °C 10 min TR-76Ui-H, TECPEL Field recorded
Relative humidity % 10 min TR-76Ui-H, TECPEL Field recorded
Solar radiation kJ h
-110 min CMP3, Kipp & Zonen Field recorded
Carbon dioxide ppm 10 min TR-76Ui-H, TECPEL Field recorded
Measuring period: 1 September, 2016 ~ 30 November, 2016 Location: Daegu (latitude 35.53°N, longitude 128.36°E)
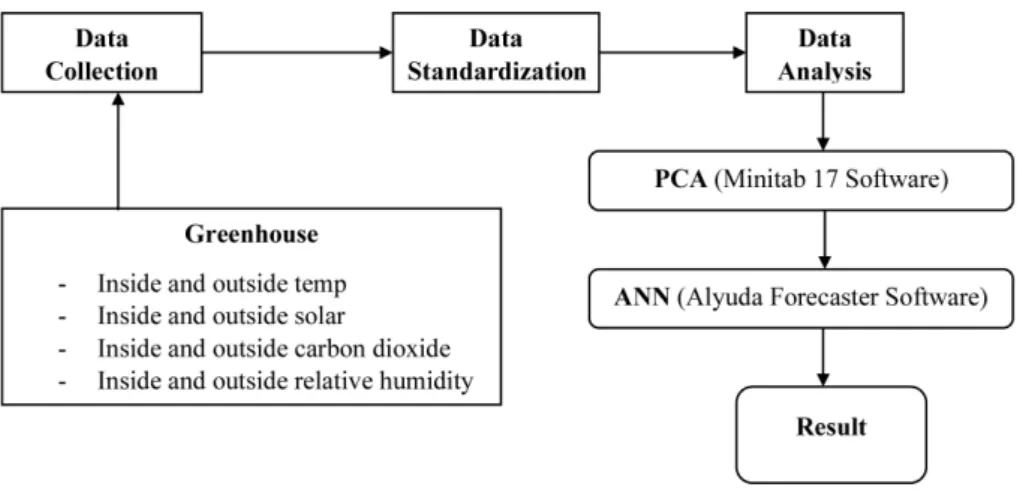
Fig. 2 Flow Chart of the Model using ANN based on PCA
the relative humidity inside the greenhouse in Korea peaksin the winter season, but the humidity level in the autumn season of 2016 at the experimental site was far greater than in the winter season of the same year. The characteristics of the weather data used are presented in Table 1. The weather parameters, specifically, air temperature, relative humidity, solar radiation, and carbon dioxide, inside and outside the greenhouse, were monitored by mounted sensors.
2. PCA description
PCA with a correlation matrix was used to standardize the collected data, thus removing the effect of dimensions and grades between the variables. For this purpose, the Minitab 17 software (Eretec Inc., Australia) was employed. Because the main aim of the work was to develop a model to accu- rately predict the inside humidity of the greenhouse, by using the PCA before building the neural network model, it was possible to simplify the data samples and network structure by reducing the neural network dimensions and eliminating the relation of the input factors. The variance contribution
rate and the cumulative variance of each principal component were calculated to determine the number of components needed for use as neural network model inputs.
3. ANN description
The flow chart of the model using ANN based on PCA was shown in Fig. 2. The ANN software used for data analysis was ALYUDA Forecaster (Alyuda Research, LLC, USA), and three layer feed-forward models with back-propagation multi-layer perceptron’s (MLPs) were utilized. The neural network was divided into input layer data, hidden layer data, and output layer data (Fen and Chengwei 2010; Owolabi et al., 2016). The input data were the principal components data and the output data was the predicted humidity. The input data sets were divided into two sets, called the training set and validation set. In training the network, 83 % of the data was used while the remaining 17 % was used to validate the network. The supervised model type was used to run the program in order to arrive at a best network or minimum error, because this network is reliable and efficient in the
Table 2 Eigenvalue and cumulative variance contribution rate
Components Eigenvalue Variance contribution rate Cumulative variance contribution rate
PC1 3.6935 0.528 0.528
PC2 1.3447 0.192 0.720
PC3 0.8342 0.119 0.839
PC4 0.6780 0.097 0.936
PC5 0.3657 0.052 0.988
PC6 0.0777 0.011 0.999
PC7 0.0062 0.001 1.000
Total variance 7
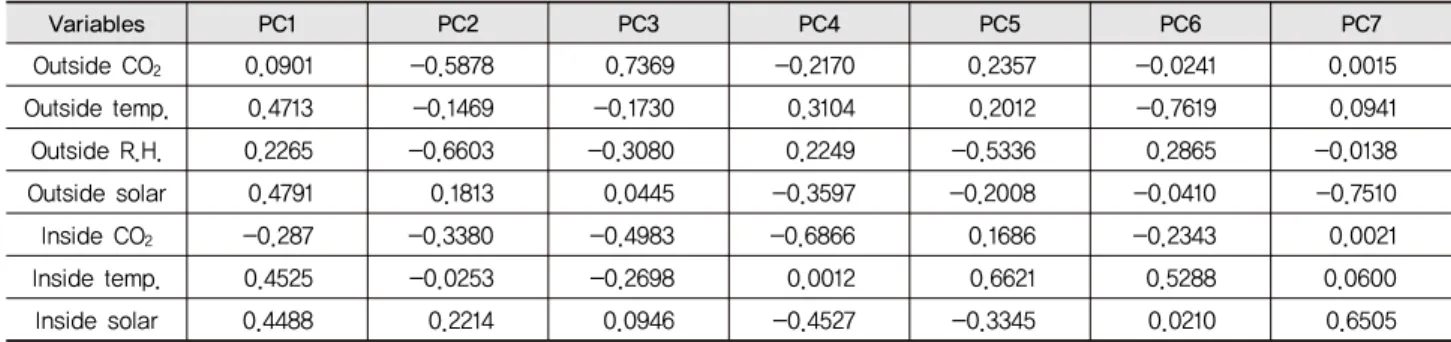
Table 3 Loading values of principal components
Variables PC1 PC2 PC3 PC4 PC5 PC6 PC7
Outside CO
20.0901 -0.5878 0.7369 -0.2170 0.2357 -0.0241 0.0015
Outside temp. 0.4713 -0.1469 -0.1730 0.3104 0.2012 -0.7619 0.0941
Outside R.H. 0.2265 -0.6603 -0.3080 0.2249 -0.5336 0.2865 -0.0138
Outside solar 0.4791 0.1813 0.0445 -0.3597 -0.2008 -0.0410 -0.7510
Inside CO
2-0.287 -0.3380 -0.4983 -0.6866 0.1686 -0.2343 0.0021
Inside temp. 0.4525 -0.0253 -0.2698 0.0012 0.6621 0.5288 0.0600
Inside solar 0.4488 0.2214 0.0946 -0.4527 -0.3345 0.0210 0.6505
distribution of the error. Moreover, this is the most widely used type of ANN.
4. Model evaluation
For evaluating the performance of measured against pre- dicted humidity by the ANN model, the graph of the regression analysis and the Nash–Sutcliffe Model Efficiency Coefficient (NSE) were used. The two methods were employed to analyze the predictive power of the model, in order to compare the trend and level of agreement between the measured and predicted results. The NSE measures the quality of the fit between the measured and predicted data from the model, and it is defined in the equation by Julien et al. (2013) as
(1)
Where
= Experimented values at time i.
= Modelled values at time i.
= Mean of the experimental values.Ⅲ. Results and Discussions 1. PCA data interpretation
A total of 720 groups of data samples were analyzed for the experiment with the Minitab 17 software. Each sample was composed of eight variables, namely, the outside para- meters of CO2, air temperature, relative humidity, and solar radiation, and the inside the greenhouse parameters of CO2, air temperature, relative humidity, and solar radiation. Because they all have different units of measurement, the 720 groups of data were subjected to data standardization by the Minitab to remove the effects of dimension and grades between the variables, and to give them equal weight regardless of how abundant each variable was (Fen and Chengwei, 2010). The eigenvalue and cumulative variance contribution rate, listed in Table 2, were obtained by arranging the cumulative variance contribution rate of each principal component in a sequence of numerical values, and taking 85.0 % as the borderline. Out of the seven components obtained, three principal components were selected to represent the vast amount of information contained in the original data. Thus, PC1 carried 52.8 % of the total information, which was more than half the total
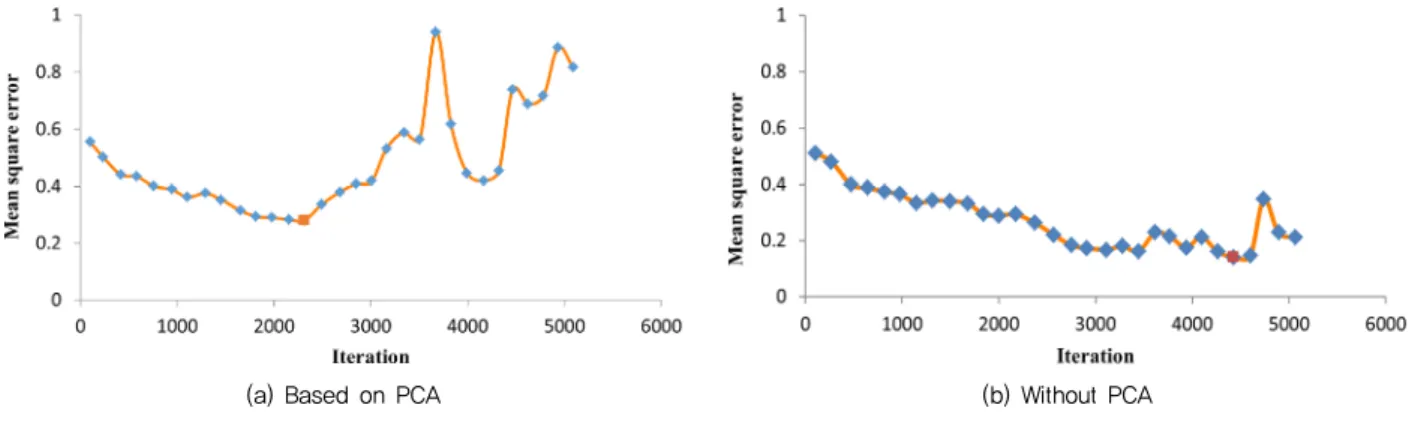
(a) Based on PCA (b) Without PCA Fig. 3 Training error graph for inside air humidity
Table 4 Performance report model
Training set with PCA Training set without PCA Validation set with PCA
Number of rows 75 75 15
Average AE 0.3462 0.2525 0.8766
Average MSE 0.2803 0.1414 1.2189
Tolerance type Absolute Absolute Absolute
Tolerance 2 2 5
Number of good forecasts 75 (100 %) 63 (84 %) 15 (100 %)
Number of bad forecasts 0 (0 %) 12 (16 %) 0 (0 %)
information of the eight variables. PC2 and PC3 carried 72.0
% and 83.9 % of the total information, respectively. Hence, three principal components were considered for this work.
Taking a correlation of 0.45, the first principal component was correlated with four out of the seven original variables that were analyzed. The first principal component increased with increasing outside air temperature, outside solar radiation, inside air temperature, and inside solar radiation, as shown in Table 3. This suggests that these four criteria vary together.
If one increases, then the remaining ones tend to increase, and vice versa. Therefore, PC1 can be viewed as a measure of these four variables. The second principal component increases with decreases in outside CO2 and outside relative humidity, and thus, they are both a function of PC2. The third principal component increases with increasing outside CO2 and decreasing inside CO2.
2. ANN model
For the prediction of the air humidity inside the greenhouse, the development of the ANN provides the best-fit model for all the training and validation sets used, with the topology
3-25-1 as input, hidden, and output layers, respectively. This is in conformity with Fen and Chengwei (2010) and Owolabi et al. (2016) regarding the selection of input and output layers.
The training error graph of the inside air humidity based on the PCA, as shown in Fig. 3 (a), implies that the training process went through 5090 iterations and the best was achieved at iteration number 2313, with average error (AE) of 0.3462 and mean square error (MSE) of 0.2803, as listed in Table 4. However, the training error graph of the inside air humidity without PCA in Fig. 3 (b), went through 5062 iterations and the best was achieved at iteration number 4429, with AE of 0.2525 and MSE of 0.1414, as presented in Table 4. It was obvious during the training process that the ANN based on PCA reached the training goal faster, if the time taken to achieve the best iteration is compared to that in the ANN without PCA, which is in conformity with Fen and Chengwei (2010).
The batch training method was employed for this project to train the network as shown in Fig. 3 (a) and Fig. 3 (b) because it is used in training small amount of data set as compared to online training that uses large amount of data
Fig. 4 Sensitivity analysis results of inside air humidity
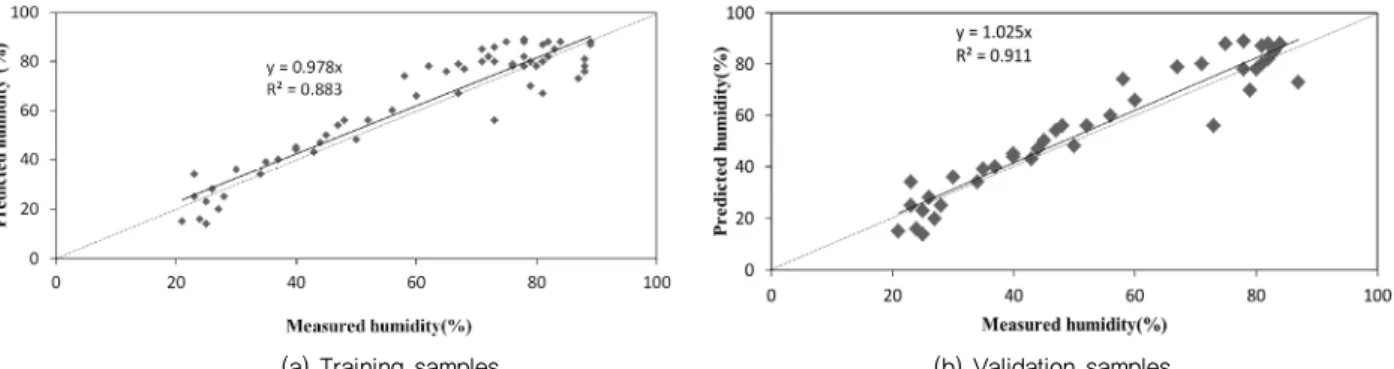
(a) Training samples (b) Validation samples
Fig. 5 Regression lines between the measured and predicted humidity
sets. Also, batch training is traditionally believed to be better,faster and accurate for small amount of data as compared with online training by most researchers (Wilson and Martinez, 2003). The percentages of good and bad predictions for the training with PCA, training without PCA, and validation with PCA sets were 100 % and 0 %, 84 % and 16 %, and 100% and 0 %, respectively, as can be seen in Table 4. To achieve the best-fit plot and a good model for prediction, the percentage of good forecasts must be greater than the per- centage of bad forecasts in the ratio 7:3 (Owolabi et al., 2016), and this condition was satisfied by the model.
The result of the sensitivity analysis of the variables combined in the three principal components, with respect to the inside air humidity is shown in Fig. 4. In accurately predicting the air humidity inside the greenhouse, the effect of PC1 on the model was shown to have the highest sen- sitivity level with 51.7 %, followed by PC2 with 26.6 %, and finally, PC3 with 21.7 %. This implies that the major causes of the increase or decrease in air humidity inside the green-
house are a function of PC1, which was composed of four variables, namely, inside and outside air temperature and solar radiation.
3. Model validation
The regression line between the measured and predicted humidity of the training and validating samples is shown in Fig. 5. It was observed from the regression line and NSE that the model showed satisfactory results when comparing the R2 of 0.883 and NSE of 0.866 for the training samples with PCA with the R2 of 0.911 and NSE of 0.984 for the validation samples with PCA. If R2 and NSE are close to 1, then there is a better match between the observations and model (Julien et al., 2013), and these values were very close to 1. The good linear fitting relationship between the measured and predicted values showed that the model was accurate in predicting the inside air humidity. This simply means that the output of the network can approach its target with minimal error deviation (Owolabi et al., 2016).
Ⅳ. Conclusions
The main objective of this work was to develop a model that accurately predicts the inside humidity of a greenhouse by means of an ANN based on PCA, and use the developed model to determine the variables from the principal components that affect the inside humidity. Three principal components were considered in this research, and the first component increased with increasing outside air temperature, outside solar radiation, inside air temperature, and inside solar radiation;
the second component increased with decreasing outside
CO2 and outside relative humidity; and the third component increased with increasing outside CO2 and decreasing inside CO2. From the sensitivity analysis results, the major causes for the increase or decrease in air humidity inside the green- house were a function of PC1, which is composed of four variables, namely, inside and outside air temperature and solar radiation. Lastly, it was observed from the regression line and NSE that the model showed satisfactory results when comparing the R2 of 0.883 and NSE of 0.866 for the training samples with PCA with the R2 of 0.911 and NSE of 0.984 for the validation samples with PCA. Further, the NSE and R2 values are close to 1, which shows that is a good match between the observations and the model. The results obtained show that the measured humidity is in good agree- ment with the predicted humidity, which means that the model has a very high accuracy and can be used for predicting the inside air humidity based on the regression analysis graph with the NSE values for the training and validation samples.