≫ 연구논문 ≪
토양 재활용을 위한 통계적 분석의 PAHs 농도 예측
김종오·§이만승*
목포대학교 환경교육과, *목포대학교 신소재공학과
Prediction of PAHs Concentration using Statistical Analysis for Soil Recycling
Jongo Kim and
§Manseung Lee *
Department of Environmental Education, Mokpo National University
*Department of Advanced Materials Science and Engineering, Mokpo National University
요 약
본 연구에서는 토양내 BaA 농도로부터 BaP, DahA와 ΣPAH의 농도 예측식 개발과 토양 재활용을 위하여 통계적 접근을 시도하 였다. 회귀분석 결과 높은 상관성(R
2> 0.90) 과 BaA와 BaP(또는 DahA) 농도 사이에 밀접한 연관성을 보였다. 또한 개발된 회귀식 을 다른 검증 연구에 적용한 결과 유사한 예측값을 얻었다. 통계적 분석에서 BaA가 BaP 예측에 높은 상관성을 보였으며 PAHs 예 측에 중요한 인자로 여겨진다. 이들 예측식을 적용 할 경우 BaA 농도만을 이용하여 평균적인 BaP, DahA나 ΣPAH 농도를 빨리 계 산 할 수 있다.
주제어 : BaA (Benz(a)anthracene), BaP (Benzo(a)pyrene), DahA (Dibenz(a,h)anthracene), 다환방향족탄화수소, 회귀분석, 토양 재활용
Abstract
This study investigated the feasibility of a statistical approach for soil recycling through the prediction of BaP, DahA and total PAH ( Σ PAH) concentrations from BaA concentration. As results of regression, excellent linear correlations (R
2> 0.90) were observed between BaA and BaP (or DahA) concentrations. When a developed prediction equation was applied to other inves- tigations as a validation study, good prediction results were obtained. The predictive model showed very good correlation between the measured and calculated BaP. From this equation, BaA was an apparently important hydrocarbon for the prediction of PAHs. This model might provide a potentially useful tool for the calculation of average BaP, DahA and Σ PAH without addi- tional tests.
Key words : BaA (Benz(a)anthracene), BaP (Benzo(a)pyrene), DahA (Dibenz(a,h)anthracene), PAHs (Polycyclic aromatic hydrocarbons) Regression Analysis, Soil Recycling
· Received : June 19, 2017 · Revised : July 7, 2017 · Accepted : July 14, 2017
§
Corresponding Author : Man-Seung Lee (E-mail : [email protected])
Department of Advanced Materials Science & Engineering, Mokpo National University, 1666 Yeongsan-ro, Cheonggye-myeon, Muan-gun, Chonnam, 58554, Korea
ⓒThe Korean Institute of Resources Recycling. All rights reserved. This is an open-access article distributed under the terms of the
Creative Commons Attribution Non-Commercial License (http://creativecommons.org/licenses/by-nc/3.0/), which permits unrestricted
non-commercial use, distribution and reproduction in any medium, provided the original work is properly cited.
1. 서 론
다환방향족탄화수소(Polycyclic aromatic hydrocarbons, PAHs)는 물질의 불완전 연소과정에서 부산물로 생성되 는데, 자연 발생원에는 화산, 숲의 화재 등이 있고, 인 위적 발생원으로는 화석연료를 사용하는 자동차의 배출 가스, 화력발전소의 석탄연소, 자동차 폐오일, 담배연기 등이 있다1,2). 독성이 알려진 화합물로는 Benzo(a)pyrene (BaP)외 50종으로 밝혀졌고, 미국 환경청3)에서는 발암 성을 기준으로 BaP와 Dibenz(a,h)anthracene (DahA)는 가장 독성이 강한 것으로 간주하여 독성계수를 1.0으로 부여하였다.
화석연료 종류에 따라서 불완전 연소되는 과정에서 배출되는 PAHs 화합물을 조사한 결과가 발표되었다. 석 유제품 연소에서 배출되는 Benz(a)anthracene (BaA)는 BaP 발생농도와 서로 연관성이 있는 것으로 나타났다4,5). Chagger et al.4)은 여러 종류의 석탄이 불완전 연소할 경우 다양한 PAHs가 발생하는데, 높은 농도로 BaA, BaP, Pyr, Chr이 생성된다고 밝혔다. 낮은 온도에서 운 전 할 경우 더 높은 농도의 PAHs가 검출되는 결과를 보였다. Christie et al.5)은 여러 종류의 연료(Jet A-1, Sasol 합성연료, Shell 등유, Jet A-1/GTL 혼합등유)에 서도 PAHs가 발생되는 조사를 하였으며 연료량과 이들 농도 연관성을 발표하였다. 연료 연소과정에서 발생된 PAHs가 토양에 침전되는데 배출원이 어디인지를 추적 하는 연구도 활발하게 진행되었다6-9). PAHs의 연소기원 을 추적하기 위해서 통계적인 주성분분석, 요인분석, 다
중회귀분석이 시도되어 화석연료에 의한 연소가 원인인 지 산불과 같은 자연발생원 인지를 구분하는 논문이 제
시되었다10-12). PAHs의 토양으로의 주요 유입경로는 대
기로부터의 확산오염원에 의한 침전인데 국내외적으로 대기중 농도분포, 발생원 추적, 통계적 분석에 관한 많 은 연구가 발표되었다13-15). 그리고 Lee와 Kim16)은 Pyrene (Pyr) 농도에 따른 BaP와 ΣPAH의 예측식을 제시하였고 서로 상관성이 있는 결과를 제시하였다.
통계적 분석에 의한 발생원 추적연구는 많으나 PAHs 농도를 예측하는 연구가 거의 없는 상황에서, 기존에 발 표된 토양내 BaA 측정 자료를 사용하여 BaP, DahA와 ΣPAH의 예측을 위하여 선형회귀 분석을 시도하였다.
이는 화석연료의 연소기원 과정에서 발생되는 PAH 화 합물 간의 연관성과 예측 가능성을 알아보고 처리 필요 성을 검토하는데 목적이 있다. 개발된 회귀식을 사용하 여 PAH 농도 예측에 적합한지 검증 연구를 동시에 수 행하였다.
2. 실험재료 및 방법
2.1. 기존발표 데이터
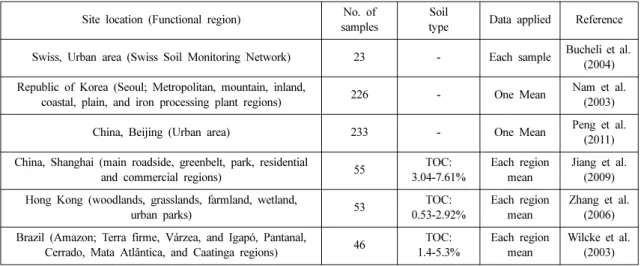
Table 1은 PAHs 측정을 한 국가, 시료개수, 통계 분 석을 위한 자료 개수를 요약한 것으로 기존 발표 자료 이다. Bucheli et al.17)이 발표한 스위스 23개 지점만 개별적 16종류 PAHs를 발표하였고 그 외 지역인 20개 데이터는 지역별 평균 PAHs 농도를 제시하였다. Jiang et al.18)은 중국 상해를 도로지역, 그린벨트지역, 공원,
Table 1. Location of the sites studied, number of soil samples, soil type, and literature sources Site location (Functional region) No. of
samples
Soil
type Data applied Reference
Swiss, Urban area (Swiss Soil Monitoring Network) 23 - Each sample Bucheli et al.
(2004) Republic of Korea (Seoul; Metropolitan, mountain, inland,
coastal, plain, and iron processing plant regions) 226 - One Mean Nam et al.
(2003)
China, Beijing (Urban area) 233 - One Mean Peng et al.
(2011) China, Shanghai (main roadside, greenbelt, park, residential
and commercial regions) 55 TOC:
3.04-7.61%
Each region mean
Jiang et al.
(2009) Hong Kong (woodlands, grasslands, farmland, wetland,
urban parks) 53 TOC:
0.53-2.92%
Each region mean
Zhang et al.
(2006) Brazil (Amazon; Terra firme, Várzea, and Igapó, Pantanal,
Cerrado, Mata Atlântica, and Caatinga regions) 46 TOC:
1.4-5.3%
Each region mean
Wilcke et al.
(2003)
주거 및 상업지역으로 나누어 각각 평균값, Peng et al.19)은 북경의 총 233개 도시 지점을 전체 평균하여 PAHs를 1개 발표하였다. 홍콩20)과 브라질21)자료는 지 역 특성을 나누어 각 지역별로 5개 및 8개 나누어 평 균 PAH 농도를 나타내었다. Nam et al.22)은 한국 전 국토를 대상으로 226개 지점 토양을 조사하여 1개 평 균값을 발표하였다.
2.2. 검증 데이터 및 통계분석
본 연구에서 개발된 회귀식을 이용하여 이미 발표된 PAH에 검증과정을 시도하였다. 중국의 발표결과23)를 사 용하였으며, SPSS 통계 프로그램(Version 23.0)을 이용 하여 Pearson 상관계수, 회귀분석을 하였다.
3. 결과 및 고찰
3.1. 기존발표 PAHs 분포기존에 발표된 42개 데이터(상해 도로지역 제외)을 사용하여 PAHs 분포와 특징을 검토하였다. 발표된 논
문에서 각 시료채취 지점별 개별 PAH 자료는 매우 적 었으며 스위스 지역만 유일하게 23개 지점의 16종류 개별 농도 수집이 가능하였고17), 나머지 지역인 19개 데이터는 지역별 평균값이다.
Fig. 1에서는 6개 지역의 평균 BaA, BaP, DahA 농 도를 보여주고 있는데 중국 상해지역18) 결과가 가장
Fig. 1. Arithmetic means of BaA, BaP, and DahA concent-
rations in 6 locations.
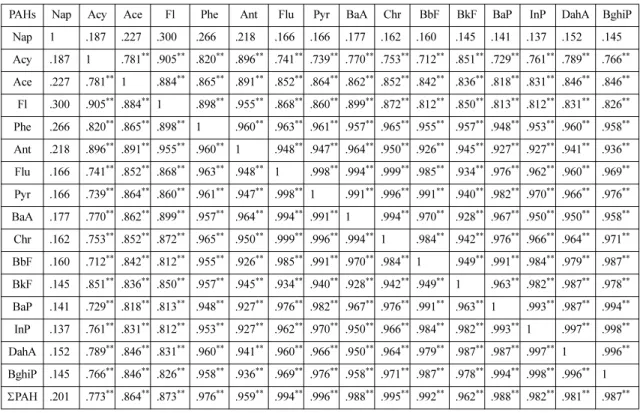
Table 2. Pearson correlation coefficients of each PAH by the previously reported data
PAHs Nap Acy Ace Fl Phe Ant Flu Pyr BaA Chr BbF BkF BaP InP DahA BghiP
Nap 1 .187 .227 .300 .266 .218 .166 .166 .177 .162 .160 .145 .141 .137 .152 .145 Acy .187 1 .781
**.905
**.820
**.896
**.741
**.739
**.770
**.753
**.712
**.851
**.729
**.761
**.789
**.766
**Ace .227 .781
**1 .884
**.865
**.891
**.852
**.864
**.862
**.852
**.842
**.836
**.818
**.831
**.846
**.846
**Fl .300 .905
**.884
**1 .898
**.955
**.868
**.860
**.899
**.872
**.812
**.850
**.813
**.812
**.831
**.826
**Phe .266 .820
**.865
**.898
**1 .960
**.963
**.961
**.957
**.965
**.955
**.957
**.948
**.953
**.960
**.958
**Ant .218 .896
**.891
**.955
**.960
**1 .948
**.947
**.964
**.950
**.926
**.945
**.927
**.927
**.941
**.936
**Flu .166 .741
**.852
**.868
**.963
**.948
**1 .998
**.994
**.999
**.985
**.934
**.976
**.962
**.960
**.969
**Pyr .166 .739
**.864
**.860
**.961
**.947
**.998
**1 .991
**.996
**.991
**.940
**.982
**.970
**.966
**.976
**BaA .177 .770
**.862
**.899
**.957
**.964
**.994
**.991
**1 .994
**.970
**.928
**.967
**.950
**.950
**.958
**Chr .162 .753
**.852
**.872
**.965
**.950
**.999
**.996
**.994
**1 .984
**.942
**.976
**.966
**.964
**.971
**BbF .160 .712
**.842
**.812
**.955
**.926
**.985
**.991
**.970
**.984
**1 .949
**.991
**.984
**.979
**.987
**BkF .145 .851
**.836
**.850
**.957
**.945
**.934
**.940
**.928
**.942
**.949
**1 .963
**.982
**.987
**.978
**BaP .141 .729
**.818
**.813
**.948
**.927
**.976
**.982
**.967
**.976
**.991
**.963
**1 .993
**.987
**.994
**InP .137 .761
**.831
**.812
**.953
**.927
**.962
**.970
**.950
**.966
**.984
**.982
**.993
**1 .997
**.998
**DahA .152 .789
**.846
**.831
**.960
**.941
**.960
**.966
**.950
**.964
**.979
**.987
**.987
**.997
**1 .996
**BghiP .145 .766
**.846
**.826
**.958
**.936
**.969
**.976
**.958
**.971
**.987
**.978
**.994
**.998
**.996
**1 ΣPAH .201 .773
**.864
**.873
**.976
**.959
**.994
**.996
**.988
**.995
**.992
**.962
**.988
**.982
**.981
**.987
***
상관관계가 0.05 수준에서 유의함.
**
상관관계가 0.01 수준에서 유의함.
높은 PAHs 농도를 보였다. 도로지역 한 곳에서 최고 ΣPAH 농도는 6,280 ug/kg로 다른 국가나 지역에 비해 수십~수백 배 높은 수준이어서, 이 결과는 통계와 회귀 분석에서 배제하였다. 상해지역 토양의 평균 BaA, BaP, DahA 농도는 각각 170, 189, 32.5 ug/kg이었다. BaP 와 DahA는 벤젠고리가 5개이고 독성계수가 가장 높은 (1.0) 화합물인데 고농도를 보이고 있다. 한국22)과 스위 스는 평균 PAHs 분포는 거의 유사하게 조사되었는데 한국 전 지역의 시료채취 지점은 226개 이었고 평균 BaA, BaP, DahA 농도는 각각 18.6, 16.3, 3.2 ug/kg 이었다. 홍콩20)과 브라질21)의 PAHs 농도분포는 다른 4 개 지역에 비해 낮게 검출되는 것으로 발표하였다.
3.2. Pearson 상관관계
기존에 발표된 6개 지역 개별 PAH의 42개 데이터를 사용한 Pearson 상관계수를 Table 2에 표기하였는데, 선형회귀분석 전에 상호 PAHs 사이에 유의미한 연관성 이 있는 화합물을 검토하기 위해서다. BaA는 Flu, Pyr, Chrysene (Chr)과 상관계수가 0.99이상이었으며 매우 유의한(p < 0.01) 수준이었고 BaP (R = 0.967), DahA (R = 0.950)와도 높은 연관성을 보였다. 이들 화합물은 자동차 연소배출로 간주되고 있다6,12). ΣPAH는 Flu, Pyr, BaA, Chr과 상관계수가 0.99 이상으로 높았으며 매우 유의한(p < 0.01) 수준으로 분석되었다. 앞에서 언 급하였듯이, 화석 연료연소에서 배출되는 PAHs 농도 사 이에는 서로 연관성이 있었는데 ΣPAH 농도와도 높은 상관성을 보여 통계적으로 의미가 있었다. Pearson 상 관성 분석을 통하여 자동차 연소에 의한 PAHs간에는 매우 밀접한 관련성을 발견 할 수 있었다.
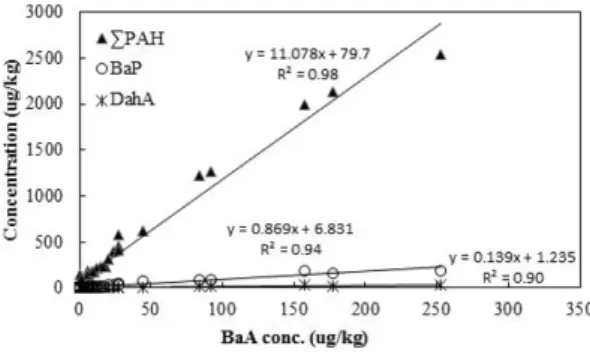
3.3. 농도에 따른 선형회귀분석
첫째, 이미 발표된 42개 지역 개별 PAH를 이용하여 선형회귀분석을 시행하였다. 회귀분석은 토양내 BaA 농 도에 따라 BaP, DahA와 ΣPAH의 예측을 위하여 회귀 분석을 시도한 결과를 Fig. 2에 나타내었다. BaA와 BaP (R2= 0.94, p < 0.001), BaA와 ΣPAH (R2= 0.98, p < 0.001) 사이에 높은 상관성을 보였고, 상대적으로 DahA와는 낮았다. Table 3은 회귀 분석을 요약한 것으 로 상관계수는 0.90이상이었다. 앞에서 언급하였듯이, 연료연소에서 배출되는 PAH 농도는 서로 연관성이 있 어 개별 PAH 농도가 유사하게 토양에 흡착되어 검출 되는 것으로 여겨진다.
불완전 연소과정에서 동시에 생성되는 Phenanthrene
(Phe)에 의한 회귀 분석을 추가로 수행한 결과는 Fig.
3에서 보여주고 있다. Phe는 BaA, BaP와 함께 연소기 원으로 알려져 있어 통계적 연관성을 조사하였다. 그림 에서와 같이, Phe 농도와 상관계수가 BaP (R2= 0.89, p < 0.001), ΣPAH (R2= 0.95, p < 0.001)로 BaA에 비 하여 약간 낮았지만 상관성이 있는 것을 알 수 있었다.
본 연구에서 개발된 회귀식은 PAH중에서 가장 독성 이 높은 것으로 알려진 BaP, DahA와 ΣPAH 농도 예
Fig. 2. Linear regression results for BaP, DahA and ΣPAH
according to BaA concentration.
Table 3. A proposed regression equation for PAHs according to BaA concentration
PAH Regression equation R
2BaP y = 0.869x + 6.831 0.9351 DahA y = 0.139x + 1.235 0.9033 ΣPAH y = 11.078x + 79.7 0.9769 R
2: Correlation coefficient.
y: BaP, DahA or ΣPAH conc., x: BaA conc.
A statistical significance ( p < 0.001) was utilized for all regression equations.
Fig. 3. Linear regression results for BaP and ΣPAH accord-
ing to phenanthrene concentration
16).
측을 대략적으로 빠르게 할 수 있는 식이 될 것이다.
고분자 PAHs인 BaP와 DahA는 낮은 휘발성과 높은 옥탄올-물 분배 계수의 특성을 갖고 있어 저분자 PAH 에 비하여 토양에 오래 동안 잔류하며 흡착되는 것으로 보고되고 있다24,25).
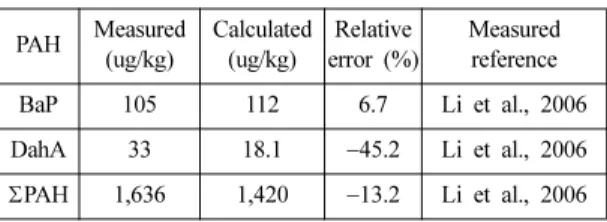
3.4. 회귀식 검증
본 연구에서 개발된 회귀식을 이용하여 이미 발표된 PAH에 검증과정을 시도하였다. Table 4에서와 같이, 중 국의 발표결과23)을 사용한 결과 실제 측정된 BaP와 계 산된 BaP는 각각 105 ug/kg, 112 ug/kg으로 상대오차는 6.7%로 매우 유사한 결과를 얻었다. 실제 측정된 ΣPAH와 산출된 ΣPAH는 각각 1,636 ug/kg과 1,420 ug/kg으로 약간의 차이가 있었다. Table 4에 요약한 것 과 같이, 회귀식을 이용할 경우 전체적 상대오차는
−45.2~6.7%로 DahA에서 큰 차이가 있는 것으로 연구 되었다. 비록 BaP나 ΣPAH 예측에 어느 정도가 한계 가 있을 수 있으나 개발된 회귀식을 이용할 경우 추가 적인 실측 없이 PAH를 대략적으로 알 수 있는 장점이 있을 것으로 여겨진다.
4. 결 론
본 연구에서는 기존에 발표된 BaA 농도 데이터를 이용하여 토양내 BaP, DahA와 ΣPAH의 예측을 위하 여 선형회귀 분석을 수행하였다. 회귀분석 결과, BaA와 BaP (R2= 0.94), BaA와 ΣPAH (R2= 0.98) 농도 사이 에 아주 밀접한 상관성을 보여주었다. 개발된 회귀식을 적용한 다른 PAH 측정값에 검증 연구에서 높은 예측 값을 얻을 수 있었다. 통계적 분석에서 BaA가 BaP 및 DahA와 서로 상관성이 높은 것으로 밝혀져 이들 화합 물 모두 연소기원 형태로 분류할 수 있을 것으로 여겨 진다. 이들 예측식을 적용할 경우 BaA 농도만을 이용 하여 빠르게 대략적인 토양에서 BaP나 ΣPAH 농도 알
수 있는 특징이 있다.
감사의 글
본 연구는 2016년도 산업통상자원부의 재원으로 한 국에너지기술평가원(KETEP)의 지원을 받아 수행한 연 구 과제입니다(No. 20165010100880).
References
1. Ministry of Environment (MOE), 2012 : 2012 Soil survey network and soil pollution investigation.
2. Ministry of Food and Drug Safety (MFDS), 2010:
Polycyclic aromatic hydrocarbons.
3. US EPA, https://www.epa.gov/risk/relative-potency-factors- carcinogenic-polycyclic-aromatic-hydrocarbons-pahs [accessed 16.11.03].
4. Chagger, H. K., et al., 1999 : Emission of volatile organic compounds from coal combustion, Fuel, 78, pp. 1527- 1538.
5. Christie, S., et al., 2012 : Polycyclic aromatic hydrocarbon emissions from the combustion of alternative fuels in a gas turbine engine, Environ. Sci. Technol., 46, pp, 6393-6400.
6. Sofowote, U. M., McCarry, B. E., and Marvin, C. H., 2008 : Source apportionment of PAH in Hamilton Harbour suspended sediments: comparison of two factor analysis methods, Environ. Sci. Technol., 42(16), pp. 6007-6014.
7. Wang, X.-T., et al., 2013 : Polycyclic aromatic hydro- carbons (PAHs) in urban soils of the megacity Shanghai:
Occurrence, source apportionment and potential human health risk, Sci. Total Environ., 447, pp. 80-89.
8. Xu, J., et al., 2014 : Historical trends of concentrations, source contributions and toxicities for PAHs in dated sediment cores from five lakes in western China, Sci. Total Environ., 470-471, pp. 519-526.
9. Park, S.-H., et al., 2016 : Characterization and emission sources of PAHs for industrial complex soils in Jeolla- namdo, J. Soil Groundwater Environ., 21(3), pp. 49-57.
10. Yunker, M. B., et al., 2002 : PAHs in the Fraser River basin: a critical appraisal of PAH ratios as indicators of PAH source and composition, Org. Geochem., 33, pp. 489- 515.
11. Ray, S., Khillare, P. S., Agarwal, T., and Shridhar, V., 2008 : Assessment of PAHs in soil around the international airport in Delhi, India, J. Hazard. Mater., 156, pp. 9-16.
12. Zhang, Y., et al., 2012 : Potential source contributions and risk assessment of PAHs in sediments form Taihu Lake, China: comparison of three receptor models, Water Res., 46(9), pp. 3065-3073.
Table 4. Comparison of measured and calculated PAHs from regression equations
PAH Measured (ug/kg)
Calculated (ug/kg)
Relative error (%)
Measured reference
BaP 105 112 6.7 Li et al., 2006
DahA 33 18.1 −45.2 Li et al., 2006
ΣPAH 1,636 1,420 −13.2 Li et al., 2006
13. Khalili, N. R., Scheff, P. A., and Holsen, T. M., 1995 : PAH source fingerprints for coke ovens, diesel and gasoline- engines, highway tunnels, and wood combustion emissions, Atmos. Environ., 29, pp. 533-542.
14. Simcik, M. F., Eisenreich, S. J., and Lioy, P. J., 1999:
Source apportionment and source/sink relationships of PAHs in the coastal atmosphere of Chicago and Lake Michigan, Atmos. Environ., 33, pp. 5071-5079.
15. Guo, H., et al., 2003 : Particle-associated polycyclic aromatic hydrocarbons in urban air of Hong Kong, Atmos.
Environ., 37(38), pp. 5307-5317.
16. Lee, W.-B. and Kim, J., 2017 : Prediction of BaP and total PAH in soil from Pyr concentration using regression analysis, J. Korean Soc. Environ. Eng., 39(3), pp. 118-123.
17. Bucheli, T. D., et al., 2004 : Polycyclic aromatic hydro- carbons, black carbon, and molecular markers in soils of Switzerland, Chemosphere, 56, pp. 1061-1076.
18. Jiang, Y., et al., 2009 : Levels, composition profiles and sources of polycyclic aromatic hydrocarbons in urban soil of Shanghai, China, Chemosphere, 75, pp. 1112-1118.
19. Peng, C., et al., 2011 : Polycyclic aromatic hydrocarbons
in urban soils of Beijing: Status, sources, distribution and potential risk, Environ. Pollut., 159, pp. 802-808.
20. Zhang, H. B., et al., 2006: Distributions and Concentrations of PAHs in Hong Kong Soils, Environ. Pollut., 141, pp.
107-114.
21. Wilcke, W., et al., 2003 : Polycyclic aromatic hydrocarbon (PAH) patterns in climatically different ecological zones of Brazil, Org. Geochem., 34, pp. 1405-1417.
22. Nam, J. J., et al., 2003 : Distribution of polycyclic aromatic hydrocarbons in agricultural soils in South Korea, Chemo- sphere, 50, pp. 1281-1289.
23. Li, X., et al., 2006 : Polycyclic aromatic hydrocarbon in urban soil from Beijing, China, J. Environ. Sci., 18, pp.
944-950.
24. Yang, S. Y. N., et al., 1991 : Polycyclic aromatic hydro- carbons in air, soil and vegetation in the vicinity of an urban roadway, Sci. Total Environ., 102, pp. 229-240.
25. Jung, K., et al., 2013 : The effect of pH on citric acid leaching of soil contaminated with heavy metals, J. of Korean Inst. of Resources Recycling, 22(5), pp. 13-19.
김 종 오
• 현재 목포대학교 사범대학 환경교육과 교수
이 만 승