Journal of the Korea Institute of Building Construction, Vol. 13, No. 2
http://dx.doi.org/10.5345/JKIBC.2013.13.2.148 www.jkibc.org
Decision-making Reliability Estimation Model based on Building Construction Project Participants` Experience
Kim, Chang-Won
1Kim, Baek-Joong
1Yoo, Wisung
2Cho, Hunhee
3*Kang, Kyung-In
31)Graduate School, Korea University, Sungbuk-Gu, Seoul, 136-713, Korea
1Construction Management Division, Construction & Economy Research Institute of Korea, Gangnam-Gu, Seoul, 135-701, Korea
2School of Civil, Environmental and Architectural Engineering, Korea University, Sungbuk-Gu, Seoul, 136-713, Korea
3Abstract
Generally, building construction projects have a complex decision-making process because of the participation of various agents. In this situation, a final decision is arrived at by relying on subjective judgments based on the experience of project participants. For this reason, a method of assessing the objectivity of opinions is needed. In previous studies, the multi-criteria decision making method was applied to arrive at a final decision objectively, but this method has a limitation, in that the experience of each decision maker is not considered differently in the decision making process. Therefore, this study proposed a theoretical model using the S-shaped growth curve and regression analysis by building construction project type to quantitatively estimate decision-making reliability according to the experience of individual project participant`s. The developed model could be added to the Multi-criteria decision making method, and secure the objectivity and reliability of project participants` final opinion.
Keywords : building construction project, experience of project participants, decision-making reliability, s-shaped growth curve, regression analysis
1. Introduction
1.1 Research background and objective
Unlike other industries, the construction industry has a unique process for each individual project, and various participants from different agents simultaneously participate in a couple of work types[1,2]. Therefore, each participant’s opinion is collected, and the final alternative that is derived based on the opinions collected has a great impact on the result of the given project[3]. The final
Received : October 12, 2012
Revision received : January 30, 2013 Accepted : January 31, 2013
* Corresponding author : Cho, Hunhee
[Tel: 82-2-921-5920, E-mail: [email protected]]
ⓒ2013 The Korea Institute of Building Construction, All rights reserved.
decisions made by participants are based on subjective factors, including personal experience in the field, and to secure reliability, an objective and differential evaluation should be conducted[4,5].
To secure the objectivity of the judgments by which main decisions are made, such as selection of order placing and main construction technique, multi-criteria decision-making method have been employed in construction projects such as the Analytic Hierarchy Process, Analytic Network and soon[6,7,8,9]. But the evaluations of decision- makers are reflected only as an average in the multi-criteria decision-making method, and it is noted that personal factors, including work experience, are not considered sufficiently[10].
In other academic fields, the concept of a
growth curve has been adopted in order to assess
Decision-making Reliability Estimation Model based on Building Construction Project Participants` Experience
the correlation between the passage of time and fluctuating data[11,12,13,14]. The method can be applied in the construction field to derive a theoretical model in which the work experience of the participants can affect the final alternative[10].
Therefore, this paper aims to derive a theoretical model that can enable a differential estimation of decision-making ability based on a project participant’s work experience by applying a growth curve and regression analysis. This is expected not only to complement the limits of the multi-criteria decision-making method, but also to secure the reliability of the final alternative.
1.2 Research scope and methodology
In this study, Work experience is defined as the number of years in which a participant has been involved in the work necessary for the decision-making. And the reliability of decision-making refers to the influence of the judgment based on the work experience of the project participants at the decision-making phase.
The research scope was limited in the process of classification of construction project types and literature review. The following are the procedures that were used to derive a theoretical model for decision-making reliability estimation.
First, through a survey of project participants who had experience in project(s) pertinent to the research scope, the normality of the data was verified through the Kolmogorov-Smirnove analysis. The trend of the data was standardized based on the maximum value of the reliability, and then the average trend lines were drawn and evaluated.
Second, the parameters of the non-linear growth curve model were estimated. To estimate the parameters, the data was linearized and a linear model was drawn and verified using the regression
analysis, and the coefficient for the linear model was estimated into that for a non-linear model. At this time, the methods presented in the pervious studies were applied to obtain the linearization of data and estimation of the parameters for the non-linear model, and the linear model derived through a regression analysis and the coefficient of the model were validated using F-test and t-test.
Third, of the three non-linear growth curve models derived from each projects, the most explanatory model was selected based on the sum of squares error (SSE). In addition, the explanatory power of the theoretical model selected was assessed quantitatively by calculating the adjusted R squared value.
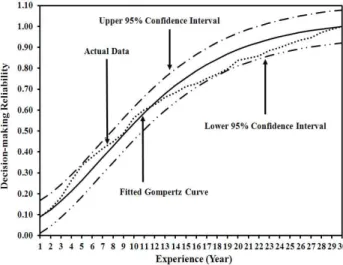
Finally, to evaluate the validity of the growth curve derived for each project type, 95% confidence intervals were extracted. In addition, to understand the section during which the decision making reliability changes by project type, an inflection point was calculated for each.
2. Preliminary review
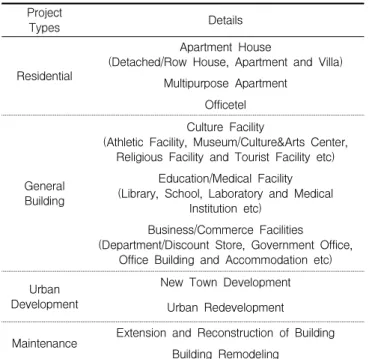
2.1 Classification of construction project types Construction project types were classified into residential, general building, urban development, and maintenance, as shown in Table 1.
Of the detailed project types, the scope of this research was limited to apartment housing, culture facilities, new town development and building remodeling. Apartment project accounts for 46.4%
of the domestic construction market, a high
proportion[15], and culture facility project is
expected to function as landmarks in their
area[16]. New town development project is usually
composite projects that include business planning,
the formation of complexes and building
construction, and have great economic effects[17],
and building remodeling project is rising social attention recently to secure the appropriate functions and performance of obsolete buildings[18]. For these reasons, these four project types were selected in this study, and the decision-making reliability estimation model was applied. In particular, these project types are the representative projects ordered by the CM method.
Project
Types Details
Residential
Apartment House
(Detached/Row House, Apartment and Villa) Multipurpose Apartment
Officetel
General Building
Culture Facility
(Athletic Facility, Museum/Culture&Arts Center, Religious Facility and Tourist Facility etc)
Education/Medical Facility (Library, School, Laboratory and Medical
Institution etc) Business/Commerce Facilities (Department/Discount Store, Government Office,
Office Building and Accommodation etc) Urban
Development
New Town Development Urban Redevelopment
Maintenance Extension and Reconstruction of Building Building Remodeling
Table 1. Classification of building construction project types
2.2 Growth curve and regression analysis
As mentioned earlier, growth curve and regression analysis was applied to derive a theoretical model based on which decision-making reliability could be estimated in a more objective manner considering the work experience of project participants.
The growth curve is a method used to express a mathematical model with the nonlinear Sigmoid relationship which shows changes such as “a gradual increase at the early phase, a section during which the increase rate is almost constant, and convergence to a result value[19].” The growth curves can be divided into linear and
non-linear shapes. Mansfield-Blackman, Baass, and Weibull are examples of the linear shape, while Logistic, Gompertz, Reverse-Gompertz, and Exponential are examples of the non-linear shape[20]. A linear model has a limitation in that prediction is made based on the assumption that possible phenomena have a simple linearity[20].
For this reason, of the non-linear models, Gompertz, Logistic, and Reverse-Gompertz models are employed to predict economic/technical /ecological growth in other academic fields [11,12,13]. In addition, these three models were applied in the CM, and there have been studies about deducing correlation between construction duration and cost[21] and of ordering party-centered performance measurement criteria [22]. Therefore, three types of non-linear growth curve models were applied to derive a model for estimating the decision-making reliability of project participants, and the mathematical equations of the respective models can be expressed as Equations (1) through (3)[21].
• Gompertz curve
×
× --- (1)
• Logistic curve
×
---(2)
• Reverse-Gompertz curve
×
× --- (3)
Here,
: decision-making reliability depending on participant’s work experience
t : participant’s years of work experience S : upper asymptote of the value
e : base of natural logarithm (approx. 2.71828) a : a parameter that integrates and controls
the growth curve moving along the x axis
b : a parameter that controls the slope of each growth curve
The linearization of the non-linear models is expressed in Equations (4) through (6)[21].
• Linearization of Gompertz model:
,
---- (4)
• Linearization of Logistic model:
,
---- (5)
• Linearization of Reverse-Gompertz:
,
--- (6)
Here,
: result of linearization of
: the average decision-making reliability of the data collected
: a constant of linearization model
: a coefficient of linearization model
After the average of the data actually collected is transformed using Equation (4) through (6), regression analysis was applied to obtain the parameters of the linearization model. In general, regression analysis is a method used to estimate the relationship between variables[23], and it is employed to select a decision-making model to analyze and predict the relationship between construction duration and cost in a construction project[19,24]. In this study, the parameters of each model were deducted through regression analysis, and regression diagnostics were conducted to determine whether or not it is statistically significant. Of the three theoretical models, the most explanatory model was selected based on the SSE value, and the explanation power of the model selected was evaluated through the adjusted R squared value. Finally, the validity of the model was reviewed by analyzing it within the 95%
confidence intervals.
3. Decision-making reliability estimation model by project participant’s work experience
Derivation of the participant’s decision-making reliability estimation model was performed in the process of data collection and verification, review of the final model, and the inflection point. The data was analyzed using Microsoft Excel and SPSS 12.0K for Windows, two commercial software packages, and the significance level was set as 0.05.
3.1 Data collection and analysis
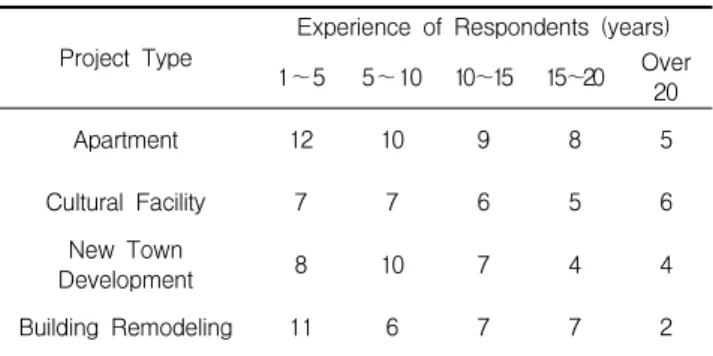
The data for this study was collected through a survey conducted on 141 project participants who had experience with the given project types, and the years of work experience are indicated in Table 2.
Table 2. Experience distribution of the respondents Project Type Experience of Respondents (years)
1~5 5~10 10~15 15~20 Over
20
Apartment 12 10 9 8 5
Cultural Facility 7 7 6 5 6
New Town
Development 8 10 7 4 4
Building Remodeling 11 6 7 7 2
The questionnaire shown in table 3 was
distributed to the participants. We asked them to
evaluate the decision-making reliability of the
project participants with 1 to 30 years of work
experience based on their subjective work
experience. As mentioned, this study aims to
reflect the personal factor of the
decision-makers’ work experience when
evaluating the weight derived through the
application of the multi-criteria decision-making technique, so the decision-making reliability was evaluated within the range between 0 and 1.
Table 3. Example of questionnaire form Experience
(Year)
Decision-making Reliability
Low <---> High 0.0- 0.1 0.1-
0.2 0.2- 0.3 0.3-
0.4 0.4- 0.5 0.5-
0.6 0.6- 0.7 0.7-
0.8 0.8- 0.9 0.9-
1.0
1 0.05
2 0.14
....
30 1.0
Of 141 questionnaires collected, 17 were incomplete, and 7 were determined to be unreliable. After these were excluded from the data set, a total of 94 questionnaires were analyzed using Kolmogorov-Smirnove analysis to verify normality, and Table 4 shows the analysis results.
Table 4. Results of normality test Project Type Sample
Number Mean Std.
Deviation Z Asymp.
Sig.
Apartment 21 0.658 0.271 0.635 0.815
Cultural
Facility 24 0.659 0.305 0.783 0.573
New Town
Development 22 0.625 0.306 0.760 0.611
Building
Remodeling 27 0.593 0.305 0.648 0.796
Through the analysis, the asymptotic significance calculated based on the Z-score was greater than 0.05, which was set as the significance level, and the normality of the data can be determined to have been secured[25].
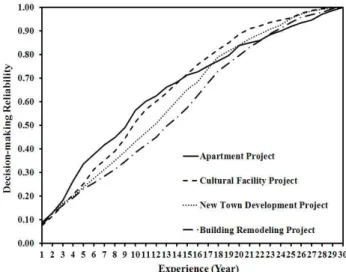
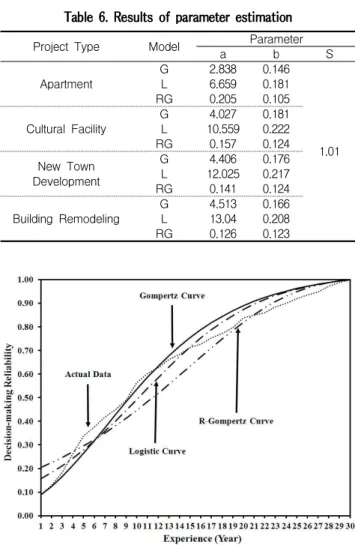
Next, to analyze the trend of data, the survey results were standardized based on the maximum value of the decision-making reliability, 1, and the average trend lines analyzed are shown in Figure 1.
Figure 1. Trend analysis based on survey data
The results above reveal that there are differences in decision-making reliability based on participant’s work experience with each project type, which can affect the selection of the final decision.
3.2 Data linearization and analysis
To calculate parameters of the growth curve model, the method used in the study conducted by WS. Yoo (2007) was applied. First of all, the mean of actual data was converted into a linearized value using Equations (4) through (6). At this time, the upper asymptote, S, one of the parameters for the non-linear model required for linearization of data, was set as 1.01 in consideration of 1/100 error because the participant’s decision-making reliability was evaluated within the range between 0 and 1.
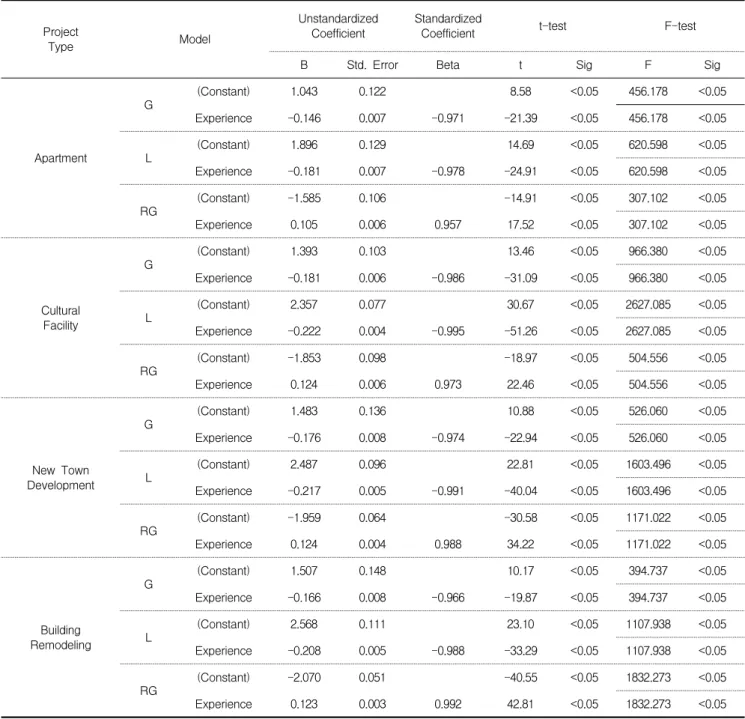
Next, regression analysis was applied for the
converted data to derive three regression models
for the each project. F-test and t-test were
implemented for the diagnostics of each model and
coefficient, and the results are indicated in Table
5. The constant and the coefficient of independent
variables are
and
in the models present in
Equations (4) through (6). To diagnose the model
Project
Type Model
Unstandardized
Coefficient Standardized
Coefficient t-test F-test
B Std. Error Beta t Sig F Sig
Apartment
G (Constant) 1.043 0.122 8.58 <0.05 456.178 <0.05
Experience -0.146 0.007 -0.971 -21.39 <0.05 456.178 <0.05
L (Constant) 1.896 0.129 14.69 <0.05 620.598 <0.05
Experience -0.181 0.007 -0.978 -24.91 <0.05 620.598 <0.05
RG (Constant) -1.585 0.106 -14.91 <0.05 307.102 <0.05
Experience 0.105 0.006 0.957 17.52 <0.05 307.102 <0.05
Cultural Facility
G (Constant) 1.393 0.103 13.46 <0.05 966.380 <0.05
Experience -0.181 0.006 -0.986 -31.09 <0.05 966.380 <0.05
L (Constant) 2.357 0.077 30.67 <0.05 2627.085 <0.05
Experience -0.222 0.004 -0.995 -51.26 <0.05 2627.085 <0.05
RG (Constant) -1.853 0.098 -18.97 <0.05 504.556 <0.05
Experience 0.124 0.006 0.973 22.46 <0.05 504.556 <0.05
New Town Development
G (Constant) 1.483 0.136 10.88 <0.05 526.060 <0.05
Experience -0.176 0.008 -0.974 -22.94 <0.05 526.060 <0.05
L (Constant) 2.487 0.096 22.81 <0.05 1603.496 <0.05
Experience -0.217 0.005 -0.991 -40.04 <0.05 1603.496 <0.05
RG (Constant) -1.959 0.064 -30.58 <0.05 1171.022 <0.05
Experience 0.124 0.004 0.988 34.22 <0.05 1171.022 <0.05
Building Remodeling
G (Constant) 1.507 0.148 10.17 <0.05 394.737 <0.05
Experience -0.166 0.008 -0.966 -19.87 <0.05 394.737 <0.05
L (Constant) 2.568 0.111 23.10 <0.05 1107.938 <0.05
Experience -0.208 0.005 -0.988 -33.29 <0.05 1107.938 <0.05
RG (Constant) -2.070 0.051 -40.55 <0.05 1832.273 <0.05
Experience 0.123 0.003 0.992 42.81 <0.05 1832.273 <0.05
G : Gompertz, L : Logistic, RG : Reverse-Gompertz Model
Table 5. Results of coefficient analysis
and coefficient derived through the regression analysis, t-test and F-test were performed, and the result, the p-value was smaller than the significance level of 0.05. Therefore, the coefficient of each linear model was found to be statistically significant, and the validity of the model was also determined to have been secured.
3.3 Parameter estimation for non-linear models and deduction of the final model
The coefficients and constants for a linear model
for each project type shown in Table 5 can be
estimated as the parameters for a non-linear
model, and the estimated results are as given in
Table 6.
Table 6. Results of parameter estimation
Project Type Model Parameter
a b S
Apartment G 2.838 0.146
1.01
L 6.659 0.181
RG 0.205 0.105
Cultural Facility G 4.027 0.181
L 10.559 0.222
RG 0.157 0.124
New Town Development
G 4.406 0.176
L 12.025 0.217
RG 0.141 0.124
Building Remodeling G 4.513 0.166
L 13.04 0.208
RG 0.126 0.123
Figure 2. Theoretical models of apartment project
Figure 2 is the diagram that shows the differences in the theoretical models for the apartment project. As shown in Figure 2, since the residuals of theoretical models do not match the average trend line based on the actual data, it is believed that there may be differences in the explanation power of the three theoretical models.
Next, to select the most explanatory model of the three for the actual data, SSE and the adjusted R-squared value were evaluated. The statistical meaning of SSE is the sum of squares errors that exist among the values estimated based on the actual data and the statistical models. The smaller the value, the higher the explanation power a model has[28]. In addition, through the
calculation of the adjusted R-squared value, the explanation power of the decision-making reliability estimation model was quantitatively evaluated [26]. SSE and the R-squared value were calculated using Equations (7) and (8), and the results are as shown in Table 7.
--- (7)
Here,
SSE : sum of squares error
t : years of participants’ work experience
: decision-making reliability estimated through a theoretical model
: collected data
--- (8)
Here,
,
,
,