J Korea Industr Inf Syst Res Volume 17 Number 6 http://dx.doi.org/10.9723/jksiis.2012.17.6.083
기술 선정을 위한 평가모델 개발:
BSC와 ANP를 중심으로
(Developing the assessment model for technology selection: Based on the BSC and ANP)
홍 종 의*, 신 경 철*
(Jongyi Hong and Kyungchul Shin)
요 약 기술평가는 의사결정자가 해결해야할 가장 중요한 분야 중에 하나이다. 기술선택의 중요성이 증가함에 따라, 의사결정자가 적절한 기술을 선택하였는지가 기업의 가장 중요한 관 심사가 된 것이다. 따라서 본 연구에서는 BSC와 ANP 기반의 기술평가모델을 제시하였다. 기 술선택을 위한 기술평가 모델은 세 개의 phase로 구성이 되어있다. 첫 번째 단계에서는 기술평 가에 영향을 주는 요인들을 도출하였다. BSC 프로세스에 기반하여 기술선택을 위한 전략과 핵 심성공요소, 그리고 성과지표를 도출하였다. 두 번째 단계에서는 ANP 방법론을 사용하여, 전 문가의 의견을 수렴하고 기술 대안들을 평가하였다. ANP 방법론은 의사결정을 위한 유무의 요인들뿐만 아니라 요인들 간의 상관관계를 고려하고 평가 프로세스에 있어서 객관성확보를 가능케 한다. 마지막 단계에서는 앞 단계의 결과물을 적용하여 가장 적합한 기술을 선택한다.
나아가, 적용가능성의 검증을 위해 본 연구방법론을 공공서비스에 실제로 적용하였다. 본 연구 에서 제시된 기술평가 성과지표와 기준은 기술선정에 있어서 주안점을 두어야 할 분야와 이를 가능케 하는 방법을 알려준다. 나아가 본 연구 방법론을 타 분야에 적용함으로써, 의사결정의 합리성과 객관성을 확보할 수 있을 것으로 기대된다.
핵심주제어 : 기술선정, 균형성과표, ANP
Abstract Technology assessment is one of the most challenging decision making areas that companies face nowadays. According to increase the importance of technology selection, it has been a main issue for the decision makers whether an appropriate technology selection will be successful or not. Therefore, in this study, a technology assessment model using BSC and ANP method was proposed. The technology assessment model consist of three phase. In first phase, various factors, that have an influence on technology assessment, were taken into consideration. Based on the extracted BSC process, the strategies and critical success factors and performance measures were extracted for selecting the technology. And in second phase, the ANP method used to integrate opinions of experts’ and evaluate technology alternatives controls tangible and intangible criteria, allows for more complex inter-relationship among decision levels and deals with ambiguity involved in the assessment process. In the lase phase, according to the result of before phase, decision makers select the appropriate technology. Furthermore, the proposed model was applied in the public service for validating the feasibility of the assessment model. The criteria and proposed performance measures informs the method and focus areas for developing the technology. Furthermore, the assessment model can be applied to the other area, and give the objectivity and rationality.
Key Words : Technology Selection, BSC, ANP
1)* 경남대학교 경영학부([email protected])
Authors Purpose Criteria Choudhur
y et al.(2006)
Selection of
advanced technology Strategic/Technologi cal/Social
Hsu et al.(2009)
Lubricant regenerative technology Selection
Technology/Econom y/Environmental protection
Luong(199 8)
Selection of computer-integrated
manufacturing technologies
Economic/Operation al/
Strategic Mohanty
et al.(2005)
Advanced manufacturing technology selection
Strategic/Tactical/M onetary
Peças et al(2009)
Plastic injection moulds technology selection
Economic/Technical /Environmental
Shehabud deen et al. (2006)
Selection of packaged manufacturing technology
Technical
/Financial/External pressures
Shen et
al.(2009) Emerging
technology selection
Technological/
Business/
Technology development/Risk
1. Introduction
Technology selection is one of the most challenging decision making areas that companies face nowadays. Technology offers both a great opportunity and a threat to companies at the same time. If companies select the appropriate technology at the right time, they can gain value and competitive advantages and sustain the organization competitiveness. It is important for organization to make the appropriate selections to utilize their limited capital and human resources fully. If companies do not choose the right technology, they will waste the time and resource. However, it is becoming more and more difficult to select the appropriate technology because of the increasing number of technologies, convergence of technologies and abundance of technological options(Schmookler, 1966).
Social concerns about technology assessment have increased rapidly (Park and Park, 2004) and there has been growing recognition that technology valuation is a core task of enhancing firms’
competitiveness (Noori, 1990). Although there are various technology selection models from intuitive judgment to complex options model (Black and Scholes, 1973; Mitchell and Hamilton, 1996), generally, the technology’s value can be expressed in score, index, or monetary value (Park and Park, 2004).
However, there are some limitations of previous technology assessment models. Therefore, our target is to analyze the strategies and critical success factors for the best technology selection and propose the model for evaluation of technologies using Balanced ScoreCard(BSC) and Analytic Network Process(ANP)(홍종의 외, 2007).
The purpose of our research is to analyze the strategies and Critical Success Factors(CSFs) for selecting the best technology and to propose the model for technology selection based on BSC and ANP. The rest of this study is set out as follows:
the next section considers the available literature regarding technology selection approaches. In section 3, BSC and ANP method is explained. In section 4, the research model consists of three phases;
Performance Measures(PMs) development, technology assessment and technology selection. Section 5 present the results of the empirical study for selecting the appropriate technology. The conclusions and future research opportunities are provided in section 6.
2. Literature Review
2.1 Technology selection model
<Table 1> Technology selection
Technology selection is widely recognized for its
increasing importance in the field of technology
management. Previous studies on the private sector
are summarized in Table 1. The technology
selection model of most research did not cover all area to select the best technology.
2.2 Technology assessment model
As we mentioned above, generally, technology’s value is represented in score, index, or monetary value (Park and Park, 2004). Scoring model take into account the various selection factors and let experts subjectively rate score about each factor (Park and Park, 2004). Then the technology’s total score is evaluated based on addition and/or multiplication of individual scores (Souder, 1972).
Index model which is more flexible and can use more various measures such as ratio or percent usually uses a functional form of selection and ultimately evaluate a composite value of technology (Park and Park, 2004).
Monetary value model measures technology’s monetary value and uses capital budgeting methods that consider Discounted Cash Flow(DCF) for technology selection of net present value (NPV) (Park and Park, 2004). Generally, monetary value models can be divided into three approaches: cost approach, market approach, and income approach (Mard, 2000 a; Mard, 2000 b; Pavri, 1999).
There were some limitations in previous researches concerning technology assessment. First, although there are various expectations from different interested groups, most researches focused on financial perspectives. Second, the factors used in previous researches were not based on the organization vision and strategies. The quality and timely decision-making of technology selection is essential for the success of any firm. There is a need for a decision support system to assist companies in selecting technology, which is most suitable to their vision and strategy. Third, there are no scientific methods on extracting factors.
Finally, previous researches did not consider the possible dependencies among factors. To solve these limitations, we analyze the strategies and CFSs for
selecting the best technology and propose the framework for selection of technologies using BSC and ANP.
3. BSC and ANP 3.1 BSC
Because the technology assessment is not for the technical aspects but for the managerial aspects, we need to use BSC. By the following advantages of BSC, it is suitable to construct assessment model for technology selection(서우종 외, 2009).
▪ Performance measures of the BSC explain the essence of a strategy and contribute to its acceptance by the entire organization (Kaplan and Norton, 1996).
▪ BSC makes it possible to evaluate managerial activities with unbiased viewpoints by providing both tangible financial aspects and intangible, non-financial aspects (Olve et al., 1999)).
▪ BSC evaluates the integrated domain of business and technology (Olve et al., 1999).
Because of the above list of features, it is possible to analyze specific characteristics and key success factors in technology and propose a methodology for assessing technology by applying the BSC. Therefore, the BSC is applied to identify the main strategies and CSFs.
3.2 ANP
The ANP which Saaty proposed is a generalization of the AHP (Chung et al., 2005;
Satty, 1996). While the AHP indicates a
uni-directional hierarchical relationship, the ANP can
be used for complex interrelationships (Yüksel and
Dağdeviren, 2007). The ANP uses feedback approach
to replace hierarchies with networks. For example, the criteria’ importance determines the alternatives’
importance, but the importance of the alternatives can also influence on the importance of the criteria (Satty, 1996). So, the hierarchical representation cannot be utilized in complex systems (Chung et al., 2005). In that, network is more suitable than hierarchy for complex systems. Relationships in a network are indicated using arcs and the directions of arcs represent directional dependence (Chung et al., 2005; Satty, 1996). Interdependency between two clusters, outer dependence, is indicated using a two-way arrow and Inner dependencies among the elements of a cluster are shown using looped arcs (Chung et al., 2005; Sarkis, 2002). The ANP is considered for assessing the value of technology with the following advantages.
▪ ANP is a comprehensive method considering all tangible and intangible criteria in decision making (Chung et al., 2005).
▪ ANP is an innovative and robust multicriteria decision-making (MCDM) method, thus it can evaluate the performance of intangible services using comprehensive analytic frameworks for solving societal, governmental, and corporate decision problems (Chung et al., 2005).
▪ ANP considers both qualitative and quantitative characteristics, thus it enables the evaluation of invisible services (Yüksel and Dağdeviren, 2007).
▪ ANP enables the selection of alternatives by analyzing dependency among the strategic factors (Yüksela and Dagˇdeviren, 2007).
▪ ANP helps the selection of high-Technology in view of benefits, opportunities, costs and risks so it can be adapted to invisible services (Sarkis, 2002).
4. Model for technology selection
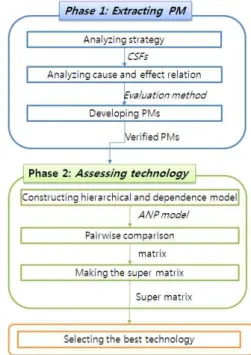
Figure 1 shows the model for technology selection. The porposed technology assessment model using BSC and ANP method was proposed.
The assessment model consists of three phase. In phase 1, the PMs are extracted based on BSC. The various factors, that have an influence on technology assessment, were taken into consideration. Based on the extracted BSC process, the strategies and critical success factors and performance measures were extracted for selecting the technology. In phase 2, the value of the technology is evaluated according to ANP. The ANP method is used to integrate opinions of experts’ and evaluate technology alternatives controls tangible and intangible criteria, allows for more complex inter-relationship among decision levels and deals with ambiguity involved in the data evaluation process. In final phase, the best technology is selected based on the result phase 1 and phase 2.
according to the result of before phase, decision makers select the appropriate technology.
<Figure 1> The assessment model for technology
selection
4.1 Phase 1: Extracting performance measures
It is essential to appropriately identify the vision of a organization, because the BSC is based on the shared comprehensive vision (Kaplan and Norton, 1992). Since the BSC will give the organization a stronger focus than before, the consequences from a misguided vision must be extremely serious (Kaplan and Norton, 1996).
Exploitation of new technologies is important for businesses focused on technology to gain competitive advantage (McNamara and Baden- Fuller, 1999). Management of technology such as technology strategies and planning has been more difficult because of increasing complexity of technologies, convergence of technologies, abundance of technological options, higher cost of technological development, and rapid diffusion of technologies (Shehabuddeen et al., 2006). Additionally, it has been difficult to access appropriate technologies and select the most appropriate option. Therefore, we establish the vision as “To sustain growth and improve competitiveness by selecting the best technology”
Based on the defined vision, the corresponding strategies were extracted. 8 strategies were extracted based on literature review. Strengths of the technology itself are superior to the others (NTTC, 2005; Heslop et al., 2001). The technology is protected from the others and has proprietary position (Coster and Butler, 2005; Yun et al, 2000;
Park and Park, 2004; NTTC, 2005). Marketability of technology has influences on the financial performance of organization(Heslop et al., 2001;
NTTC, 2005; Sohn et al., 2007; Coster and Butler, 2005; JTTA, 2005; Sohn and Moon, 2003; Lassere, 1982). Technology profitability play important part of the financial performance of organization(JTTAS, 2005; Sohn et al., 2007). The technology is essentially related with organization strategies and vision (Gregory, 1995; Stacey and Ashton, 1990;
Schroder and Sohal, 1999). When the organization selects the technology, they should consider ethical , political, legal and environmental factors(Balachandra and Friar, 1997; NTTC, 2005; Palm and Hansson, 2006). The technology can be developed and be commercialized based on organization support and capability (Balachandra and Friar, 1997; Heslop et al., 2001). Based on the extracted strategies, the corresponding critical success factors (CSFs) were extracted. Table 2 shows the CSFs.
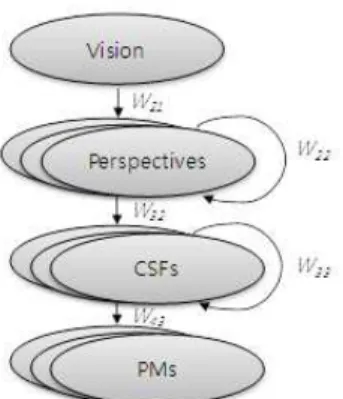
The cause and effect relationship between strategic initiatives and CSFs for technology selection is represented in Figure 2. First, the environmental factors and the political and legal factors of technology have influence on the organization and technology perspective. Second, the organization support and capability for the technology have the positive effect on the marketability of the technology.
Third, the strengths of the technology itself can increase the marketability of the technology. Finally, the marketability of the technology has direct effect on the profitability of the technology.
<Figure 2> Cause and effect relation diagram
Based on the extracted CSFs, the corresponding
PMs were extracted. Table 2 shows the strategies,
CSFs and PMs.
STRATEGIES CSF MEASURE
Strengths of the technology itself are superior to the others (NTTC, 2005; Heslop et al., 2001).
Extension of technology (Lassere,
1982; Coster and Butler,2005) Extension range of technology Technological risk/Technical
hurdles (Coster and Butler,2005;
NTTC, 2005)
Technical obstacle/solution Plan observance
The level of technology (JTTAS, 2005; Sohn et al., 2007; Kumar and Jain, 2003; Coster and Butler,2005)
The degree of difficulty Innovation of technology Completion of technology The technology is protected from the
others and has proprietary position (Coster and Butler,2005; Yun et al, 2000; Park and Park, 2004; NTTC, 2005)
Intellectual property rights
License duration
License possibility
Marketability of technology have
influences on the financial performance of firms (Heslop et al., 2001; NTTC, 2005;
Sohn et al., 2007; Coster and Butler,2005;
JTTAS, 2005; Sohn and Moon, 2003;
Lassere,1982).
Market characteristics or market condition (Lassere,1982;
Bar-Zakay, 1977)
Number of competitor Market size
Growth rate
Market potential (Kumar and Jain, 2003)
Number of competitor Market size
Growth rate life of technology
Technology profitability has influences on the financial performance of firms (JTTAS,
2005; Sohn et al., 2007). Investment retrieval
Prospective profit Payback period Development and commercialization cost The technology is related with firms'
strategies and vision (Gregory, 1995; Stacey and Ashton, 1990; Schroder and Sohal, 1999).
Organizational needs (NTTC, 2005) Strategic feasibility
The technology is appropriate in terns of ethical and environmental factors (Palm and Hansson, 2006).
Environment Influence on environment
Ethical factor (Palm and Hansson,
2006) Influence on morals
The technology is appropriate in terns of political and legal factors (NTTC, 2005;
Balachandra and Friar, 1997).
Political/legal acceptance
(Lassere,1982; Bar-Zakay, 1977;
Yun et al, 2000)
Degree of governance regulation
Governance support Fund-supply
Social acceptance Social acceptability of the product (Balachandra and Friar, 1997)
The technology is appropriate in terns of firms' support and capability (Balachandra and Friar, 1997; Heslop et al., 2001).
Managers' ability (Sohn et al., 2007;
Sohn and Moon, 2003; Lassere,1982;
Kumar and Jain, 2003; Coster and Butler,2005)
Technological knowledge
Technological experience Ability of utilization of technology
(NTTC, 2005; Sohn and Moon, 2003;
Lassere,1982)
Ability of management Manufacturability Financial status (Kumar and Jain,
2003) Fund-supply