https://doi.org/10.7848/ksgpc.2017.35.4.231
A Comparative Study of Carbon Absorption Measurement Using Hyperspectral Image and High Density LiDAR Data in Geojedo
Choi, Byoung Gil
1)·Na, Young Woo
2)·Shin, Young Seob
3)Abstract
This paper aims to study a method to estimate precise carbon absorption by quantification of forest information that uses accurate LiDAR data, hyperspectral image. To estimate precise carbon absorption value by using spatial data, a problem was found out of carbon absorption value estimation method with statistical method, which is already existed method, and then offered optimized carbon absorption estimation method with spatial information by analyzing with methods of compare digital aerial photogrammetry and LiDAR data. It turned out possible Precise classification and quantification in case of using LiDAR and hyperspectral image. Various classification of tree species was possible with use of LiDAR and hyperspectral image. Classification of hyperspectral image was matched in general with field survey and Mahalanobis distance classification method.
Precise forest resources could be extracted using high density LiDAR data. Compared with existing method, 19.7% in forest area, 19.2% in total carbon absorption, 0.9% in absorption per unit area of difference created, and improvement was found out to be estimated precisely in international code.
Keywords: Spatial Information, High Density LiDAR Data, Hyperspectral Image, Carbon Absorption Original article
1. Introduction
Forest biomass, important factor that affects climate change and forest productivity, is needed to evaluate a contribution rate of forest in carbon storage and carbon circulation. National scale forest biomass is estimated based on growing stock measured by national forest resources survey, and carbon absorption of forest can be estimated by application of area by species and carbon emission coefficient of forest (Jang et al., 2008).
This paper aims to study optimized method that can estimate precise carbon absorption. In other words, the purpose of it is to study the method to estimate precise carbon absorption by quantification of forest information using spatial information such as accurate LiDAR data, digital aerial photogrammetry image, hyperspectral image, etc.
As a research result of related technology status to build the method of carbon absorption estimation technology using LiDAR and image information, though some estimation with sample survey using aerial photogrammetry, LiDAR, sample survey data, estimation of carbon absorption of forest resources has a problem in its accuracy and currency, and though several studies are under attempting to find out precise forest resource using LiDAR and image information, system building that can acquire and process data and automatically estimate carbon absorption is insufficient (Felix et al. 2004;
Pirotti, 2010; Popescu, 2007; Lee, 2011; Kim, 2010).
As there needs a lot of manpower and time to estimate the biomass by direct research, study of estimation is under active discussion that uses data and method of remote sensing. For the biomass estimation with remote sensing, a forest tree age of vegetation is need to be estimated. To estimate it, radar
This is an Open Access article distributed under the terms of the Creative Commons Attribution Non-Commercial License (http://
Received 2017. 04. 05, Revised 2017. 04. 23, Accepted 2017. 08. 21
1) Member, Dept. of Civil and Environmental Engineering, Incheon National University (E-mail: [email protected])
2) Corresponding Author, Member, Hub-Industrial-Academic Cooperation, Incheon National University (E-mail: [email protected]) 3) Incheon National University (E-mail: [email protected])
satellite image information and digital elevation model can be used, and studies are carried on that are about estimation of forest tree age and density using Landsat ETM+ image, about satellite image to biomass survey in study area, and about fusion of satellite image, forest research data, and vegetation index (Woo, 2006). Carbon absorption estimation method using statistical data by sampling could not classify various tree species, because the data was inaccurate, and only 12 spectral images could be estimated in case of using image data acquired by general digital aerial photogrammetry.
Precise tree species classifying is possible in case of using hyperspectral image, as it can measure 128 spectral images.
Since a carbon absorption estimation method using low density (2.5 points/ ) LiDAR data couldn't extract precise information of a crown and tree height, precise volume could be estimated by using high density (7 points/ ) LiDAR (Shin, 2014; Choi et al., 2015).
To estimate relatively precise carbon absorption, new technical way of approach is needed since there need lots of time and effort using current methods. To improve these problems, optimized carbon absorption estimation method needs to be studied by compare analyzing two methods, one of which using hyperspectral image that can classify precise tree species, and one of which using high density LiDAR data that can estimate precise volume.
2. Carbon Absorption Estimation Method
2.1 Specification of forest resources with carbon absorption estimation
The historical basis for recognizing forest resources as greenhouse gas sinks is the Convention on Climate Change in 1992. The conventions aimed at stabilizing atmospheric greenhouse gas concentrations and subsequently, to
promote the implementation of the Convention on Climate Change. After the discussions on concrete measures for strengthening the obligations, the Kyoto Protocol was announced. It stipulated the obligatory quantitative reduction obligations of developed countries by 2012 from the third (COP3). In particular, at the 7th Conference of the Parties (COP7) held in Morocco in 2001 for the publication of the Annex to establish the Kyoto Protocol operating system, the Marrakesh Agreement was adopted, which included specific details such as the recognition level of forest and forest activities. The GHG emissions and sinks statistics for the GHG inventory should be calculated in accordance with the estimation methodology and procedures and the method of applying the estimates prepared by the IPCC (Intergovernmental Panel on Climate Change). Therefore, in order to be recognized as GHG reduction activities as shown in the following Table 1, carbon absorption should be calculated only for the trees satisfying the specification of the Marakesh Agreement and the specification proposed by the Korea Forest Service (reconstitution of the Kyoto Protocol). Wie et al. (2011) classified the distribution of trees using LiDAR data. In addition, the area of the study area was surveyed and the degree of forest ownership was estimated.
Based on the criteria defined in the Marakesh Agreement, it was suggested to estimate the uptake of carbon dioxide in the forests.
Forests agreed in the Kyoto Protocol (Marrakesh Agreement) consist of trees with a minimum tree height of 2m to 5m at the time of maturity, trees with a water coverage of 10% to 30% and a minimum area of 0.05 ha to 1.00 ha.
The criterion suggested by the forest Service's National forest Resources Survey Guidelines is the land with a height of 5m or more at the time of maturity, a forest cover of 10%
or more, and a minimum area of 0.50 ha or more. Generally,
Category Marakesh Agreement National forest resources survey in Korea Forest Service
Minimum height of tree 2 ~ 5 m 5 m More than
Crown density of forest 10 ~ 30% 10% More than
The Minimum area of a forest 0.05ha ~ 1.00ha 0.5ha More than
Etc - Minimum width 30m More than
Table 1. Specification of forest resources
the biomass amount of forest is estimated by using wood base density, surface expansion coefficient, and root expansion coefficient for several species. The method of calculating the amount of carbon dioxide fixed to the tree is to estimate the biomass using the basic density of the wood, the expansion coefficient of the top part, and the expansion coefficient of the underground, and then estimate the carbon dioxide amount using the carbon conversion coefficient and the carbon atom ratio in the carbon dioxide molecule can do. The carbon uptake of forests can be calculated by multiplying the total biomass of the trees by the carbon uptake of the trees.
Carbon absorption: total biomass (㎏/㎥)×carbon conversion factor (1)
To convert biomass into carbon, a carbon conversion factor was used. These carbon conversion factors can briefly calculate the carbon flow rate of each species, and the National Association of Forest Account Development in Korea has developed a carbon conversion coefficient for the major top 10 tree species. The following Table 2 shows the carbon conversion factors for representative domestic species.
Therefore, in this study, the amount of carbon absorption can be estimated by classifying the tree species and multiplying the tree species by carbon conversion factor using LiDAR and image information.
2.2 Carbon absorption estimation method
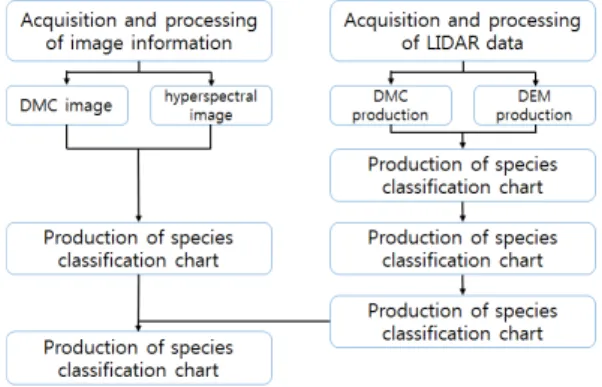
Three values of carbon absorption, each of whichare obtained by aerial photogrammetry, LiDAR data, hyperspectral image, was compared and analyzed. For the estimation of carbon absorption using LiDAR and image information, image information was acquired by digital aerial photogrammetry survey, and then signal intensity data was acquired by aerial LiDAR survey.
Image information was used to produce precise large-scale tree species thematic map by RGB color image and NIR image, and on the other hand, LiDAR signal intensity data was used to produce a tree resource thematic map of tree height, age of tree, and the crown of tree. Each tree resource thematic map offers required factors for carbon absorption estimation, and eventually helps to produce carbon absorption thematic map of study area by GIS layered analysis.
2.3 Forest information extraction method using LiDAR data
Using the aviation LiDAR data, Areas were classified where the trees are distributed in the target area, target area was estimated and the fallen degree of the forest, and a method was suggested to estimate the carbon dioxide uptake in the forest according to the criteria defined in the Marrakesh Agreement.
When using LiDAR, high resolution geography can be produced, height and crown of a forest tree, forest canopy structure of total stands can be estimated accurately. Biomass of total forest area can be estimated by extracting tree height information, and total biomass of leaf can be estimated through total sum of reflection intensity, the laser point of
Fig. 1. Calculation method of carbon absorption using LiDAR and image information
Tree species Carbon conversion coefficient
Pitch pine 0.5095
False acasia 0.4961
Alder tree 0.4892
Tulip tree 0.4798
Sawleaf zelkova 0.4892
Chestnut 0.4997
Japanese larch 0.4780
Oak 0.4881
Red pine 0.4853
Nut pine 0.4896
(Source: National Forestry Academy, 2009) Table 2. Carbon conversion coefficient by representative species
which comes from a crown of tree. In order to extract the tree's labor, the following procedure was performed as shown in Fig. 2.
First, we set the search radius considering the width of the water pipe and search the point data within the set search radius based on the classified arbitrary vegetation points.
Then, the elevation comparison is performed with respect to the retrieval reference point and the retrieved vegetation points, and when the retrieval reference point is higher than the elevation of the vegetation points within the radius, it is set as the tree top point. However, if the elevation of the reference elevation is lower than the vegetation elevation within the radius, the elevation comparison is performed again with the next arbitrary vegetation point as the retrieval reference point. It is possible to obtain the number of trees in the forest by performing the process of comparing the elevation comparisons to all the points and determining the number of extracted treetops.
2.4 Forest information extraction method using aerial photogrammetry image
Through image classification process, thematic map can be generated by image data, and a type of groups to classify pixels is called classified item. Unsupervised classification
is a process to classify only pixels of image data to several groups, not choosing in advance a subject of spatial information to generate by classification, the group in this case is only a set of pixels, and the attribute of it is not defined at all. There’re sequential clustering, K-mean, ISODATA in unsupervised classification (Shin, 2014).
The purpose of class discrimination is to calculate discriminant function with error. The redundancy was calculated on the spectral region of the overlapping region assuming that the bands following the normal distribution are combined to form the optimal band and the probability distribution has the normal shape. 1-dimensional case, Mahalanobis distance, and Jeffrey Matsushita distance method. In the case of multi-dimensional case, an appropriate error ratio is used.
Hyperspectral image is advantageous because it can acquire detailed spectral reflection curves of a target object in a continuous narrow spectral range. It can be used in various fields such as change detection, land cover classification, target detection, and environmental monitoring (Park et al., 2017). Especially, in recent years, research on supervisory classification using ultra-spectroscopic images has been actively carried out to efficiently update land cover maps.
However, when urban clusters are classified using the spectral information only for urban areas with short variation periods and complex and various types of objects, It can affect the accuracy of the flow. Therefore, the land cover classification using hyperspectral images is supervised by using the input data generated by the method of decreasing the dimension and noise of hyperspectral images such as PCA (principle component analysis) and MNF (Minimum Noise Fraction) (Park et al., 2017).
Mahalanobis distance classification method is a distance concept algorithm that classifies training data which follows normal distribution form, not same with probabilistic distribution like maximum likelihood classification, and this method has much faster calculation speed than maximum likelihood classification, similar with least distance method, and contains covariant matrix in distance formula (Shin, 2014).
Sensitive characteristic about some extent of directional nature is exist by covariance matrix that could be a class Fig. 2. Tree information extraction method using LiDAR data
mean or common variance, and a probability required from training data is as following.
p ( ┃ ) = p ( ┃ ) p ( ) / p ( ) (2) In this equation, p ( )is probability that class happens in an image, p ( ┃ ) is probability calculated from training data, p ( ) : probability to find a pixel from some class in position , p ( ) = ∑ p ( ┃ ) is calculated by p ( ).
Determine method about class of pixel is as in the following.
∈ , if p ( ┃ ) p ( ) > p ( ┃ ) p ( ) for all ≠ (3) Take log in both hands to simplify calculating equation,
( ) = ln {p ( ┃ ) p ( )} = ln p ( ┃ ) + ln p ( ) Thus, ∈ , if ( ) > ( ) for all ≠ , Thus, by deriving it from maximum likelihood classification equation, ( ) = - ln┃∑ ┃- ( – )t ∑ -1 ( – ) (4)
2.5 Method of forest information extraction hyperspectral images
The extraction method for extracting forest information using hyperspectral images is collected by collecting the spectral profile, and by using a spectral library, by using a spectral library. Analyze the accuracy of the images classified using sampling data. Fig. 3 shows a flow chart of the procedure for selecting representative species and constructing a spectroscopic library for each species and sorting species based on the ultrasound image and field
survey data.
3. Experiment and Analysis
3.1 Study area selection and analysis
For a comparative analysis of carbon absorption estimation method by using spatial information, tree species in Jangmok-myeon, Geoje-si, Gyeongsangnam-do was classified by using hyperspectral image acquired by picturing with hyperspectral aerial digital camera that can measure 128 bands.
The study area was selected because it was most appropriate area for the experiment and analysis, as it is easy to access, has relatively low density of forest, and has various tree species and plentiful forest resources. Moreover, it’s easy to secure spatial information like high density LiDAR data (Fig. 4(b)), aerial photogrammetry image (Fig. 4(a)), hyperspectral image (Fig. 4(c)) in 2011 (May 2011).
2km×2km of area in the study area was selected for data acquirement. This area shows high proportion of forest distribution that is over 90%(360/400 ha), so it is judged to be a proper area for study of tree species classification using aerial photogrammetry image.
Fig. 3. Species classification using hyperspectral image
(c) Hyperspectral image
(a) Aerial photogrammetry and study area (b) LiDAR data
Fig. 4. Study area and raw data
The result of the calculation for carbon absorption of existing sampling method in study area by research data of the Korea Forestry Service (Table 3).
3.2 Forest information extraction using hyperspectral image
For the classification of tree species by hyperspectral image, a forest of the study area was information by using images captured by hyperspectral digital camera that can measure with 128 bands.
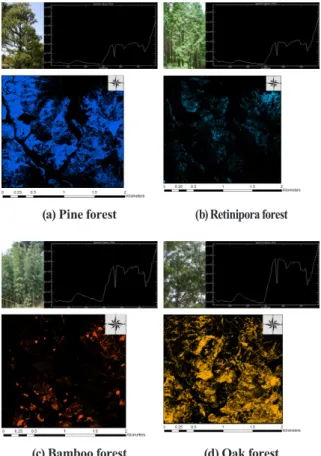
Filed survey was conducted about groups that has representative of tree species. Total 14 spots were surveyed, 10 spot of which were used for reference value of tree species classification, 4 spot (1, 2, 11 and 12 of Fig. 4(c)) of which were used for precision test of tree species classification. Current state of representative tree species groups in Geojedo forest area was surveyed, species of which are pine, retinispora, bamboo, oak. Fig. 6 describes result of the field survey.
3.2.1 Spectral information and thematic mapping about tree species
Spectral information and thematic map per tree species using hyperspectral image was produced based on the field survey result.
3.2.2 Analysis of tree species classification As a result of spectral information graph production by referencing tree species data from field survey, the pixel value was 6,000~12,000 at 700nm~950nm with Fig. 7 which is in near infrared wavelength range in case of oak and bamboo, and it showed significant difference compared to pine and retinispora. Similar pixel value occurred in 700nm~950nm in case of pine, retinispora, but a difference showed in visible ray wavelength range of 500nm~700nm.
Forest
classification Area(ha) Unit absorption
amount (ton/ha) Carbon absorption amount (ton/yr)
Needle leaf 104 9.8 1,019.2
Broad leaf 108 12.1 1,306.8
Mixed woodland 148 10.3 1,524.4
Non forest 40 - -
Total 400 10.7 3,850.4
Table 3. Calculation of carbon absorption by existing sampling method
Fig. 5. Result of field survey for tree species research
Fig. 6. Spectral profile and thematic map of tree species (a) Pine forest (b) Retinipora forest
(c) Bamboo forest (d) Oak forest
Which was for practical accuracy test, through field survey data and seasonal aerial image was generally matched with experiment result.
In this paper, we use the Mahalanobis method, which is the simplest to use and most consistent with the field survey data.
However, we need a method to improve accuracy through further research.
Outline classification of image was first conducted in maximum likelihood classification and Mahalanobis distance classification which have high classification accuracy, and generally Mahalanobis distance classification method was matched with a result of the field survey. Accordingly, detailed classification result was produced by applying Mahalanobis distance classification method. As the classification result, pine forest (1,441,044 ) occupied most of the distribution, and rest of it distributed as an order of oak forest (1,073,169
), retinispora forest (197,368 ), bamboo forest (184,429 ).
Item Classification result
(pixel) Cumulative
(pixel) Area
(㎡) Rafe
(%)
Pine forest 1,441,044 1,441,044 1,441,044 36.03%
Retinispora 197,368 1,638,412 197,368 4.93%
Bamboo 184,429 1,822,841 184,429 4.61%
Oak 1,073,169 2,896,010 1,073,169 26.83%
Etc. 1,103,990 4,000,000 1,103,990 27.60%
Total 4,000,000 - 4,000,000 100.00%
Table 4. Area and classification results by tree species
Fig. 7. Spectral profile of tree species
Fig. 8. Result map of tree species classification
Fig. 9. Comparison of classified images and aerial photographs
(a) Aerial photogrammetry
image(summer) (b)Aerial photogrammetry image(winter)
(c) Hyperspectral image(spring) (d) Classification of tree species
3.3 Result of forest information extraction using LiDAR data
The diameter of breast height was calculated by putting height of tree, extracted by aerial LiDAR data based on factor value estimated from regression equation, into function equation, estimated by using Exponential Function IV most suitable for mixed stand forest.
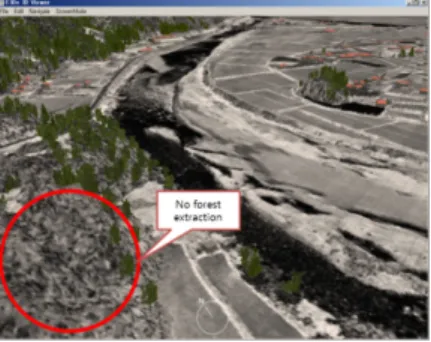
In case of using E3De, individual extraction of forest resource is possible, process time for extracting total forest resource is short, and though precise extraction of forest resource is difficult because of the use of low density data with Fig. 10 satisfactory result could be obtained in total.
In this paper, the forest resources were extracted using high density LiDAR signal intensity data with Fig. 11 Especially, result data capacity, processing speed, which are obtained from various analyzing set factor of solution for the extraction of geography and forest resource, and characteristics of forest resource in Korea are considered to set up several values. A size of the crown of tree is set from 2m to 20m, GSD of DEM, DSM is 1m, and in case of tree extraction, it is set from 1.2m to 50m using high density LiDAR data.
As shown in Table 5, high-density data can extract about twice as much trees as low density data. It can be seen that using the high density data can calculate the carbon absorption amount more accurately.
3.4 Comparative analysis of carbon absorption estimation method
In this paper, carbon absorption of mixed stand forest, coniferous forest, and broadleaf forest was estimated by blending LiDAR and digital aerial picture, hyperspectral image (Table 6).
In this paper, as shown in Table 4, the carbon absorption of mixed forests, coniferous forests, and broad-leaved forests by the conventional sampling method was calculated and compared with the result of tree extraction method using high density LiDAR data and hyperspectral images .
Using high-density LiDAR data and hyperspectral image, 72.2% of the study area (400ha) could be extracted as the correct number of forests (Table 6). This corresponds to 80.3% of the forest area (360ha) according to the conventional specimen sampling method. As shown in Table 7, the method using the high-density LiDAR data and the hyperspectral image method extracts less forests than the conventional sampling method, but the carbon absorption per unit area is Fig. 10. Extraction of forest resource in case of using low
density data
Fig. 11. Result of extracting geography and forest resource using high density LiDAR data
Table 5. Comparative analysis of extracting using low density and high density LiDAR data
Item Number of
trees Carbon absorption amount(ton/yr) Low density
data 13,419 1,122.0
High density
data 31,239 3,111.0
Table 6. Estimation of carbon absorption amount by tree extraction method using LiDAR data
Tree species Area(ha) Unit absorption amount(ton/ha) Carbon absorption amount(ton/yr)
Pine forest 144 7.68 1,106.7
Retinispora
forest 20 6.28 123.9
Bamboo
forest 18 29.34 541.1
Oak forest 107 12.48 1,339.3
Total 289 10.8 3,111.0
increased by 0.9%.
In this paper, tree species and age information of forest resource was quantified, and carbon absorption by species, year, region was estimated by using aerial LiDAR and digital image information. Also, forest information and carbon absorption was estimated and analyzed by selected region, administrative district, year, using fundamental database analyzed from information of LiDAR and image with Fig. 12.
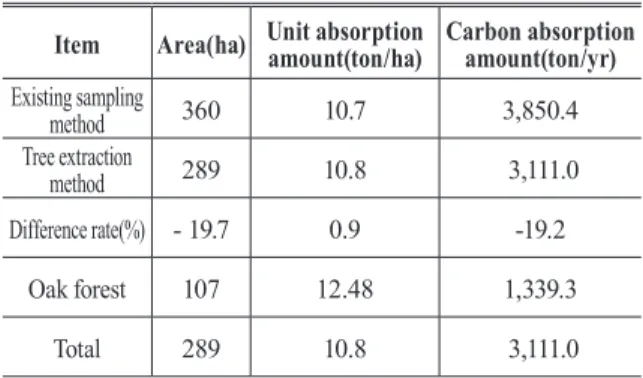
Compared to existing method with Table 7, 19.7% of difference was occurred in forest area, 19.2% in total carbon absorption, 0.9% in absorption amount per unit area, and the difference between forest area and total absorption amount represents that improvement plan was estimated to be suitable to international standard. Although the area is reduced compared to the conventional method, the increase in the amount of absorption per unit area can be understood as a larger amount of absorption can be calculated by the individual extraction method of the tree.
4. Conclusion
In this paper, as a result of studying method to estimate precise carbon absorption by quantification of forest information using spatial information like accurate LiDAR data, digital aerial picture image, hyperspectral image, following conclusion could be obtained.
First, for a suitable estimation of carbon absorption, precise classification and quantification of forest was possible by using LiDAR, digital aerial picture, hyperspectral image.
Second, as a result of acquisition and processing of existing image information, though it was available to acquire high spatial resolution (10cm) spatial information and to read out tree species accurately by using various wavelength range, it was not available to estimate precise height of tree.
Compared to this, the result of tree species classification using hyperspectral image could classify various tree species by acquiring hyperspectral image using hyperspectral aerial digital camera.
Third, in case of using general S/W, individual forest Fig. 12. Estimation of forest information and carbon
absorption analyzed from LiDAR and image information
Table 7. Comparison of carbon absorption calculation results Item Area(ha) Unit absorption amount(ton/ha) Carbon absorption
amount(ton/yr) Existing sampling
method 360 10.7 3,850.4
Tree extraction
method 289 10.8 3,111.0
Difference rate(%) - 19.7 0.9 -19.2
Oak forest 107 12.48 1,339.3
Total 289 10.8 3,111.0
(a) LiDAR data (b) DSM
(c) DEM (d) Tree height information
(e) Tree species information
analysis map (f) Growth amount analysis map
(g) Carbon absorption
distribution map (h) Land cover map
resource extraction of tree was available, and the processing time was short, and although precise forest resource extraction with low density data was difficult, precise forest resource extraction was available using high density (8 points/ ) LiDAR data considering characteristics of forest resource in Korea, and data capacity, processing speed.
Fourth, compared to existing method, 19.7% of difference was occurred in forest area, 19.2% in total carbon absorp- tion, 0.9% in absorption amount per unit area, and the difference between forest area and total absorption amount represented that improvement plan was estimated to be suitable to international standard. Henceforward, in case of accumulation of LiDAR and image information by year, study of carbon absorption estimation about more various species of tree needs to be done by widening study area.
Acknowledgment
This work was supported by Incheon National University Research Grant in 2013.
References
Brauer, M., Evans, J.S., Florig, H.K., Phonboon, K., Saksena, S., and Song, G. (2002), Policy uses of particulate exposure estimates, Chemosphere, Vol. 49, No. 9, pp. 947-959.
Choi, Y.R., Lee, J.S., and Yun, H.C. (2015), Extraction of forest resources using high density LiDAR data, Journal of the Korean Society of Surveying, Geodesy, Photogrammetry and Cartography, Vol. 33, No. 2, pp. 73- 81. (in Korean with English abstract)
Felix, M., Erich, M., Benjamin, K., Klaus, I.I., Matthias, D., and Britta, A. (2004) LiDAR-based geometric reconstruction of boreal type forest stands at single tree level for forest and wildland fire management, Remote Sensing of Environment, Vol. 92, pp. 353-362.
Jang, A.J. and Kim, H.T. (2008), Study of biomass estimation in forest by aerial photogrammetry and LiDAR Data, Journal of the Korean Association of Geographic Information Studies, Vol. 11, No. 3, pp. 166-173. (in Korean with English abstract)
Kim, E.Y., Wie, G.J., Cho, H.M., and Yang, I.T. (2010), A Study for forest research using airborne laser scanning, Journal of the Korean Society of Surveying, Geodesy, Photogrammetry and Cartography, Vol. 29, No. 1, pp. 299- 304. (in Korean with English abstract)
Lee, S.J, Choi, Y.S., and Yoon, H.S. (2012), Estimation of carbon dioxide stocks in forest using airborne LiDAR data, Journal of the Korean Society of Surveying, Geodesy, Photogrammetry and Cartography, Vol. 30, No. 3, pp.
259-268. (in Korean with English abstract)
Park, H.L. and Choi, J.W. (2017), Accuracy evaluation of supervised classification by using morphological attribute profiles and additional band of hyperspectral imagery, Journal of the Korean Society for Geo-spatial Information Science, Vol. 25, No. 1, pp. 9-17 (in Korean with English abstract)
Pirotti, F. (2010), Assessing a template matching approach for tree height and position extraction from Lidar-Derived Canopy Height Models of Pinus Pinaster Stands, forests 2010, Open Access Journal of forestry and forest Ecology, Vol. 1, pp. 194-208.
Popescu, S.C. (2007), Estimating biomass of individual Pine forests using airborne LiDAR, Biomass and Bioenergy, Vol. 31, pp. 646-655.
Shin, Y.S. (2014), The Measurement of the Carbon Absorption in Forested Area Using High Point Density LiDAR data and Hyperspectral Image, Master’s thesis, Incheon National University, Incheon, Korea, 61p. (in Korean with English abstract)
Wie, G.J., Lee, H., Lee, D.H., Cho, J.M., and Suh, Y.C. (2011), Estimation of the carbon absorption of a forest using Lidar data, Journal of the Korean Society of Surveying, Geodesy, Photogrammetry and Cartography, Vol. 29, No. 1, pp. 55- 62. (in Korean with English abstract)
Woo, C.S. (2006), DEM Generation and Tree Height Estimation in Forest Area Using Airborne LiDAR Data, Master's thesis, Inha University, Incheon, Korea, 71p. (in Korean with English abstract)