• 검색 결과가 없습니다.

Approximate estimation of soil moisture from NDVI and Land Surface Temperature over Andong region, Korea

N/A
N/A
Protected

Academic year: 2021

Share "Approximate estimation of soil moisture from NDVI and Land Surface Temperature over Andong region, Korea"

Copied!
7
0
0

로드 중.... (전체 텍스트 보기)

전체 글

(1)

I. Introduction

Soil Moisture (SM) is defined as restrained water within the pores of soil particles against gravity (Engman, 1995). Despite the fact that soil moisture only makes up 0.15% of global fresh water (Dobriyal et al., 2012), it serves as an essential variable for hydrological management (Jackson et al., 1981) and for understanding the energy balance of terrestrial water (Dorigo et al., 2012; Engman, 1995) in both global and regional climate scales models (Anderson and Croft, 2009).

The ground-based direct measurement is the most

reliable approach for determining soil moisture content in terms of its accuracy (Dobriyal et al, 2012). Time Domain Reflectrometry (TDR) is one of the modern techniques for observing water content in the soil using electrical conductivity from coupled metallic rod probes, and the device has ±1% margin of error (Dobriyal et al., 2012; Jackson et al., 1981). However, the limitation of consistency in spatial and temporal variability on a large scale remains a challenge (Engman, 1995). The advent of spaceborne remote sensing and the development of sensors and algorithms since the late 1970s (Wagner et al., 2009) have become

Approximate estimation of soil moisture from NDVI and Land Surface Temperature over Andong region, Korea

Hyunji Kim, Jae-Hyun Ryu, Min Ji Seo, Chang Suk Lee and Kyung-Soo Han

Department of Spatial Information Engineering, Pukyong National University

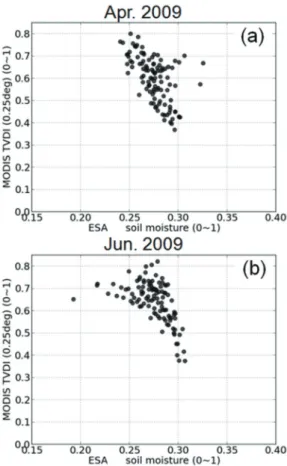
Abstract : Soil moisture is an essential satellite-driven variable for understanding hydrologic, pedologic and geomorphic processes. The European Space Agency (ESA) has endorsed soil moisture as one of Climate Change Initiates (CCI) and had merged multi-satellites over 30 years. The 0.25 ˚ coarse resolution soil moisture satellite data showed correlations with variables of a water stress index, Temperature-Vegetation Dryness Index (TVDI), from a stepwise regression analysis. The ancillary data from TVDI, Land Surface Temperature (LST) and Normalized Difference Vegetation Index (NDVI) from MODIS were inputted to a multi-regression analysis for estimating the surface soil moisture. The estimated soil moisture was validated with in-situ soil moisture data from April, 2012 to March, 2013 at Andong observation sites in South Korea. The soil moisture estimated using satellite-based LST and NDVI showed a good agreement with the observed ground data that this approach is plausible to define spatial distribution of surface soil moisture.

Key Words : Soil Moisture, Temperature-Vegetation Dryness Index (TVDI), NDVI, LST

Received June 19, 2014; Revised June 24, 2014; Accepted June 24, 2014.

Corresponding Author: Kyung-Soo Han ([email protected])

This is an Open-Access article distributed under the terms of the Creative Commons Attribution Non-Commercial License

(http://creativecommons. org/licenses/by-nc/3.0) which permits unrestricted non-commercial use, distribution, and reproduction in

any medium, provided the original work is properly cited

(2)

a credible approach for securing SM data with spatial and temporal consistency using microwaves (Barret and Petropoulos, 2013). With the consistent effort to observe SM from the space, the European Space Agency (ESA) launched the Soil Moisture and Ocean Salinity (SMOS) in 2009. It is the first mission that is solely dedicated to detecting soil moisture and salinity globally (Silverstrin et al., 2001; Albergel et al., 2012). In addition, merged SM from multi-purpose spaceborne platforms in the past provides comprehensible global SM data (Albergel et al., 2012).

Hence, SM was selected as one of Essential Climate Variables (ECVs) by the Global Climate Observing System (GCOS). The Europe Space Agency (ESA) also recognized soil moisture as a Climate Change Initiatives (CCI) variable, and started the CCI programme in 2010. Its objective is to merge existing multi-satellite based SM products from 1978 to 2010 (Dorigo et al., 2012).

In this study, we attempted to estimate surface SM in South Korea using satellite data. One of the most popular synergistic methods for SM estimation is using the Temperature-Vegetation Dryness Index (TVDI) approach (Sabrino et al., 2013). The TVDI approximates the wetness or dryness of soil from land surface temperature (LST) and the Normalized Difference Vegetation Index (NDVI) (Sandholt et al., 2002). A large number of studies have adopted the TVDI to estimate SM using satellite data (Barret and Petropoulos, 2013) which has an advantage of spatio- temporal consistency (Barret and Petropoulos, 2013;

Engman, 1995); however, this investigation has not yet been extensively explored and assessed as in the southern peninsula of Korea. We used satellite datasets (LST & NDVI from MODIS and surface SM from the CCI) in order to confirm correlations between temperature/vegetation and surface SM. The reason we selected satellite datasets is that point observations do not represent spatial average as satellite imageries do (Jackson et al., 1981). A stepwise regression also

showed the satellite LST and NDVI are suitable to represent surface SM; thereby, the LST, NDVI and meteorological data were selected as auxiliary data and used as inputs for a multi-regression analysis to estimate SM. The estimated SM by satellite-based variables then was validated with the ground-observed SM of Andong sites. The correlation of the estimated SM to the direct observations at sites was evaluated by identifying their time series patterns and a coefficient of determination (R

2

).

II. Data

CCI SM products are the merged multiple satellites global SM datasets over a period of 32 years (1978- 2010). The assimilated satellites are C-band scatterometers on board of ERS-1, ERS-2, MetOp-A, and multi-frequency radiometers of SMMR, SSM/I, TMI, AMSR-E and WindSat. Each active dataset was merged and calibrated by ASCAT; whereas, individual passive datasets were combined and scaled into climatology of AMSR-E. Then the active and passive data were aggregated by averaging and rescaled into GLDAS-Noah reference for the final products (Dorigo et al., 2012). Harmonizing satellite datasets have difficulties due to their differences in retrieval algorithms and sensors, spatial and temporal coverage (Silverstrin et al., 2001). The microwaves from the harmonized satellites allow users to obtain the information of SM at a depth of 0.5-2.0 cm (Silverstrin et al., 2001).

LST is an important parameter for investigating

energy exchange between land surface and atmosphere

so that it is applicable to estimate surface SM (Wan et

al., 2004). LST for this research is MOD11C2 from the

MODIS which has 1 km of spatial resolution. The data

was composited into 8-day period covering South

Korea (34.0 -38.5° N, 124.5° - 130.0° E) from April,

2012 to March, 2013. Another optical and thermal-IR

Korean Journal of Remote Sensing, Vol.30, No.3, 2014

(3)

data related to the SM estimation is NDVI. Although dense vegetation causes difficulty to retrieve surface SM (Dobriyal et al., 2012), the NDVI is a conservative indicator of soil moisture (Sandholt et al., 2002). The NDVI is from MOD13A2 of MODIS that has spatial resolution of 1 km and synthesized to16-day and has the same spatial and temporal coverage as LST data.

The in-situ data are situated at seven sites within Andong district (Fig. 1), and their meteorological values include wind speed (m/s), rainfall (mm), air temperature (K), LST (K), humidity (%), and soil moisture at a depth of 10 cm (%) from April, 2012 to March, 2013. LST is known to fluctuate more with water stress than NDVI (Sandholt et al., 2002). The LST showed sharp seasonal fluctuations that rose up to 310 K in summer and dropped down to 256 K in winter. Air temperature, a more stable variable seasonally than LST, was also considered as an input for SM estimation. Both in-situ and satellite-based LST, NDVI, and air temperature agreed seasonal changes from a times series analysis.

III. SM-LST-NDVI Relationships using TVDI

TVDI is one of the most commonly used water stress indexes to investigate water stress in soil from the distributions of LST and NDVI. The TVDI, also known as a triangle method, is in the shape of a triangle or trapezoid in variable distributions (Li et al, 2010).

Bare soil surface has low NDVI and high fluctuations of LST; conversely, highly vegetated area has relatively stable LST. Thereby, the triangle has thresholds: a wet edge and a dry edge. In order to estimate SM with intrinsic parameters, the study adopted TVDI equations (1) and (2) developed by Sandholt et al. (Barret and Petropoulos, 2013).

TVDI = (1)

TVDI = (2)

The observed maximum LST, LST

max

and observed minimum LST, LST

min

are calculated with linear regressions of LST

max

= a

1

+ b

1

·NDVI and LST

min

= a

2

+ b

2

· NDVI, where a

1

and a

2

are intercepts, and b

1

and b

2

indicates the slope of the dry edge (Patel, et al.,

LST _ LST

min

LST

max

_ LST

max

LST _ (a

2

+ b

2

·NDVI)

(a

1

+ b

1

·NDVI) _ (a

2

+ b

2

·NDVI)

Fig. 1. Location of soil moisture observatories in Andong.

(4)

2009). As the TVDI reaches 1, it indicates a dry edge where neither transpiration nor evaporation occurs;

whereas, TVDI reaching 0 represents a wet edge where transpiration and evaporation reach their maximum.

The combination of LST and NDVI can provide information on the evapotranspiration, air temperature, and soil moisture content (Sandholt et al., 2002).

The TVDI and soil moisture theoretically has a negative linear relationship (Li et al, 2010), In other words, parameters of TVDI, the intrinsic land cover parameters LST and NDVI (Barret and Petropoulos, 2013) from MODIS and SM from the harmonized satellites are expected to have negative relationship in scatter plots. All of LST, NDVI and SM are from satellites that they represent average values of a 25 km

area. The MODIS data with 1 km were aggregated to 25 km to make it comparable to match with the CCI soil moisture. The estimated TVDI from MODIS data and CCI soil moisture were scatter plotted, and it showed an apparent negative correlation during highly vegetated seasons from March to August in 2009 (examples of April (a) and June (b) in Fig. 2) except July due to clouded heavy rainfall. On the other hand, the negative correlation appeared weak in winter including January, February, November and December of 2009. Although the coarse resolution and regional differences of sensitivity remain challenges, the TVDI from MODIS and SM from CCI showed expected correlations in summer.

Regressed in-situ SM and LST from MODIS from March to November of 2009 showed a correlation of 0.43. The in-situ air temperature (Ta) and in-situ SM showed a positive correlation of 0.55 which is slightly higher than that of the LST. This could be due to Ta is more sensitive to seasonal variations than LST. The NDVI had the strongest correlation of 0.57.

We performed a stepwise linear regression analysis on LST, Ta, NDVI and the difference of surface and air temperature (LST-Ta). As a result of the regression, correlations to SM from variables NDVI, Ta, and LST- Ta were 0.57, 0.61 and 0.65 respectively. The empirical correlations approved the use of the LST, NDVI, Ta, and LST-Ta for estimating SM as independent variables. In order to estimate SM (SM

est

), SM relevant independent variables were selected and analyzed using a multiple linear regression as shown in the equation below.

SM

est

= c

1

·NDVI + c

2

·T

a

_ c

3

(LST _ T

a

) _ c

4

(3) The computed coefficients c

1

, c

2

, c

3

indicate the degree of relevance of independent variables to SM ,and c

4

as an intercept. The regressed SM showed that gradients c

1

, c

2

, c

3

computed 15.57, 0.77 and 1.45 respectively. The intercept c

4

was 204.00. This indicates that NDVI has the strongest influence to Korean Journal of Remote Sensing, Vol.30, No.3, 2014

Fig. 2. TVDI from MODIS and ESA CCI Soil Moisture

scatterplots show distinguishable negative correlations

during vegetated seasons including in (a) April, 2009

and (b) June, 2009.

(5)

determine SM. We assume the amount of LST reaching to the land surface depends on the canopy of vegetation cover.

A visual interpretation of estimated and in-situ SM shows a good agreement in their time series patterns as the examples shown in Fig. 3(a) and 3(b). We speculate the matching increase and decrease of the estimated and observed SM is due to the seasonal changes of vegetation cover (NDVI). Precipitation is positively correlated with both the estimated and observed SM that the rainfall could be considered as an additional parameter. However, if the precipitation had more significant impact than the growth of vegetation, the estimated and observed SM would not have a matching time series patterns from the current study since we did not consider rainfall as an independent parameter to estimate SM.

Also, scatter plotted estimated SM and in-situ SM at Andong sites with linear-regression line showed a significant RMSE of 8.24 and a bias of -0.54. This

shows that LST and NDVI parameters alone can be strong indicators to approximate surface SM.

Summary and conclusions

Soil moisture is one of the representative hydrologic

variables. The ESA operated the harmonized the past

passive and active microwave observations from

spaceborne missions over a period of 32 years

(Silverstrin et al., 2001). TVDI indicates water stress

of soil in accordance with distributions of LST and

NDVI (Sandholt et al., 2002). The LST and NDVI

from MODIS and the merged multi-satellite SM of

South Korea 2009 datasets showed negative

correlations especially during vegetation seasons. Next,

we correlated LST, NDVI, Ta and LST-Ta to SM using

a stepwise regression analysis. The independent

variables correlated with SM were inputted to estimate

SM using a multiple linear regression. The estimated

Fig 3. In-situ and satellite-based soil moisture in a time series analysis in Site A2 (a) and A3 (b).

(6)

soil moisture was then validated with in-situ data from 7 Andong sites.

A significant correlation and low 8.24 RMSE of estimated SM and in-situ SM from this study suggests that ancillary data, LST and NDVI have a plausible use for estimating SM as well as applying sub-pixel variability of a coarse SM satellite data such as SMOS for further studies.

Acknowlegements

This work is funded by the Korea Meteorological Administration Research and Development Program under Grant CATER 2012-2066. Special thanks to National Institute of Meteorological Research for data endowment.

REFERENCES

Albergel, C., P. de Rosnaya, C. Gruhierb, J. Muñoz- Sabatera, S. Hasenauerc, L. Isaksena, Y. Kerrb and W. Wagner, 2012. Evaluation of remotely sensed and modelled soil moisture products using global ground-based in situ observations, Remote Sensing of Environment, 118(15): 215- 226.

Dobriyal, P., A. Qureshi, R. Badola, and S.A. Hussain, 2012. A review of the methods available for estimating soil moisture and its implications for water resource management, Journal of Hydrology, 458-159: 110-117.

Dorigo, W., W. Wagner, B. Bauer-Marschallinger, D.

Chung, R. de Jeu, R. Parinussa and L. Yi, 2012.

Constructing and analyzing a 32-years climate data record of remotely sensed soil moisture, Proc. Of Geoscience and Remote Sensing Symposium (IGARSS), Munich, page(s): 2028 - 2031.

Engman, E.T., 1995. Microwave Remote Sensing of Soil Moisture, Progress, Potential and Problems, Proc. of International Geoscience and Remote Sensing Symposium(IGARSS).

Jackson, T.J., T.J. Schmugge, A.D. Nicks, G.A.

Coleman, and E.T. Engman, 1981. Soil moisture updating and microwave remote sensing for hydrological simulation, Hydrological Sciences Bulletin, 26(3): 305-319.

Li, H., C. Li, Y. Lin and Y. Lei, 2010. Surface Temperature Correction in TVDI to evaluate Soil Moisture over a Large Area, Journal of Food, Agriculture & Environment, 8(3&4): 1141- 1145.

Patel, N.R., R. Anapashshab, S. Kumara, S.K. Sahaa and V.K. Dadhwala, 2009. Assessing potential of MODIS derived temperature/vegetation condition index (TVDI) to infer soil moisture status, International Journal of Remote Sensing, 30(1): 23-39.

Barret, B.W. and G.P. Petropoulos, 2013. Satellite Remotes Sensing of Surface Soil Moisture. In G.P Petropoulos (Ed.), Remote Sensing of Energy Fluxes and Soil Moisture Content (85).

Florida: CRC Press.

Sandholt, I., K. Rasmussen, and J. Andersen, 2002.

A simple Interpretation of the Surface Temperature/Vegetation Index Space for Assessment of Surface Moisture Status, Remote Sensing of Environment, 79(2), 213- 224.

Silvestrin, P., M. Berger, Y.H. Kerr, and J. Font, 2001.

ESA’s Second Earth Explorer Opportunity Mission: The Soil Moisture and Ocean Salinity Mission _ SMOS, IEEE Geoscience and Remote Sensing Society Newsletter, 118: 11-14.

Sobrino, J., C. Mattar, J.C. Jimenez-Munoz, B. Franch

and C. Corbari, 2013. On the Synergy between

Optical and TIR Observations for the Retrieval

of Soil Moisture Content: Exploring Different

Korean Journal of Remote Sensing, Vol.30, No.3, 2014

(7)

Approaches. In G.P Petropoulos (Ed.), Remote Sensing of Energy Fluxes and Soil Moisture Content (363-390). Florida: CRC Press.

Wagner, W., R. de Jeu and P. van Oevelen, 2009.

Toward Multi-Source Global Soil Moisture Datasets for Unravelling Climate Change Impacts on Water Sources, Proc. of 33

rd

International Symposium on Remote Sensing of Environment, May 4-8, Joint Research Centre of the European Commission. Stresa, Italy.

Wan, Z., Y. Zhang, and Q. Zhang, 2004. Quality

Assessment and Validation of the MODIS

Global Land Surface Temperature, International

Journal of Remote Sensing, 25(1): 261-274.

수치

Fig. 2.  TVDI  from  MODIS  and  ESA  CCI  Soil  Moisture scatterplots show distinguishable negative correlations during vegetated seasons including in (a) April, 2009 and (b) June, 2009.

참조

관련 문서

본 연구에서는 국내 최초의 정지궤도 위성인 Communication, Ocean and Meteorological Satellite (COMS)의 지표면 온도 자료를 사용하여 MODerate-resolution

To explore increases in soil moisture index due to soil liquefaction, changes in the remote exploration index by the land cover before and post-earthquake

This study was aimed to classify soil desalination area for cultivation using NDVI (Normalized difference vegetation index) of high-resolution satellite image because the

Srinivasan (2002) Development of a soil moisture index for agricultural drought monitoring using a hydrologic model (SWAT), GIS and remote sensing, 2002 Texas Water

This study is to estimate COMS (Communication, Ocean and Meteorological Satellite) daily land surface temperature (LST) of Korea Peninsula from 15 minutes interval COMS LST

“Estimation of vegetation parameters of water cloud model for global soil moisture retrieval using time-series L-band Aquarius observations.” IEEE Journal of Selected

The numerical experiment with the initial soil moisture from the fusion of satellite data and land surface model output simulated a more realistic land–atmosphere interaction over East