Estimation of Net Radiation in Three Different Plant Functional Types in Korea
Hyojung Kwon*
Global Environment Lab., Dept. of Atmospheric Sciences, Yonsei University, Seoul 120-749, Korea
(Received June 22, 2009; Revised June 25, 2009; Accepted June 25, 2009)
한국의 세 개의 다른 식생기능형태에서의 순복사 추정
권 효 정 *
연세대학교 대기과학과/지구환경연구소
(2009년 6월 22일 접수; 2009년 6월 25일 수정; 2009년 6월 25일 수락)
ABSTRACT
Net radiation ( R
N) is a driving force of biological and physical processes between the surface and the atmosphere and its knowledge is critical to weather forecasting and water resource management. The measurement of R
Nis, however, scarce and it is typically estimated from an empirical relationship. This study presented two different methods of R
Nestimation over three major plant functional types (i.e., a deciduous forest, a coniferous forest, and a farmland) in Korea. One is a linear regression method between
R
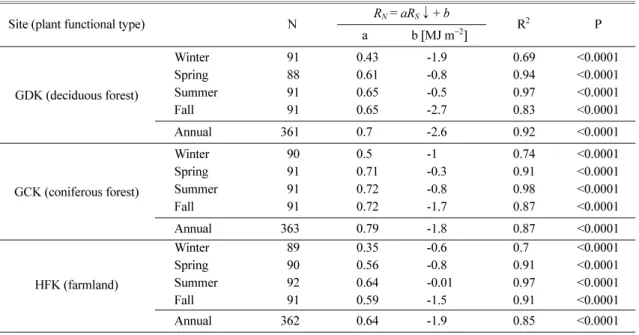
Nand solar radiation and the other is a radiation balance method. The two methods were examined using the data collected in 2008 at the three sites. Based on the linear regression method over a year, R
Nwas 70%
of the incoming shortwave radiation ( R
S↓ ) for a deciduous forest, 79% for a coniferous forest, and 64%
for a farmland, indicating that the relationship was plant functional type-specific. For the radiation balance method, the inclusion of longwave radiation component slightly improved R
Nestimations. Overall, there was a good agreement between the observed and the estimated R
Nfrom both methods, indicating a reliable applicability of the two methods in estimating R
N.
Key words : Net radiation, Solar radiation, Empirical relationship, Plant functional types
I. INTRODUCTION
Net radiation ( R
N) is a driving force of biological and physical processes between the surface and the atmo- sphere. R
Ncontrols the distribution of sensible, latent, and ground heat fluxes over land and the oceanic heat- ing that regulates long-term weather and climate vari- ability over ocean. Therefore, knowledge on R
Nis critical for the surface energy cycle as well as climate related studies. There are 544 weather stations operated by Korea Meteorological Administration (KMA; KMA, 2008). Despite the importance of R
Nmeasurements, there are only 10 stations conducting R
Nmeasurements
and 22 stations conducting solar radiation measure- ments (KMA, 2008).
Using the readily available observation data of solar radiation, R
Ncan be estimated from it based on a sim- ple linear relationship. Previous studies have presented some reliable estimations of R
Nusing this method (Shaw, 1956; Davies, 1966; Alados et al ., 2003). Other studies, however, indicate an important role of long- wave radiation on R
Nestimation (Gay, 1971; Ellingson, 1995; Kjaersgaard et al ., 2007; Tang and Li, 2008), which is ignored in the simple empirical relationship due to its small variation compared to the solar radia- tion. Several methods have been used to estimate long-
* Corresponding Author: Hyojung Kwon([email protected])
wave radiation using surface meteorological and satellite observations. These relationships, however, are site- specific due to different land surface types and thus empirical constants of the relationship may not be applicable to other sites.
In order to find the site-specific relationship in the major plant functional types (i.e., a deciduous forest, a coniferous forest, and a farmland) in Korea, this paper presented the empirical relationship derived from the observed R
Nand solar radiation. By using daily sum data over a year in 2008 at the three sites, all weather condi- tions were included to simplify the calculation of R
Nand to derive the relationship. R
Nwas also estimated by con- sidering the influence of albedo and longwave radiation.
II. THE BASIC THEORY
R
Nis given as the sum of the net shortwave radiation and the net longwave radiation:
(1) where R
S↓ is the incoming shortwave radiation, R
S↑
is the outgoing shortwave radiation, R
L↓ is the incom- ing longwave radiation, R
L↑ is the outgoing longwave radiation, α is the surface albedo, and R
LNis the net longwave radiation. Previous studies indicate that R LN
remains small and constant compared to the large vari- ation of R
S↓ and thus R
LNcan be ignored (Gay, 1971).
Eq. 1 can be rewritten as a simple linear regression:
(2) Eq. 2 presents the generally accepted concept of the empirical regression linking R
Nand R
S↓ . The regres- sion coefficients (i.e., a and b ) represent (1- α ) and R
LNin Eq. 1, respectively. The advantage of Eq. 2 is its sim- plicity with one explanatory variable. However, some previous studies have indicated the possibly significant contribution of R
Lin estimating R
N(e.g., Hong and Kim, 2008). Instead of calculating R
L↓ and R
L↑ sep- arately, R
LNcan be calculated following Allen et al . (1998):
(3) where σ is the Stefan-Boltzmann constant, T max and T min are the maximum and minimum air temperatures [K], e a is actual vapor pressure [kPa], R S0 is clear-sky
solar radiation calculated according to:
(4) where z
his elevation above sea level at the site and R a
is extraterrestrial radiation [MJ m
−2 d
−1 ]. R
ais calcu- lated following Allen et al . (1998):
(5) where G
scis the solar constant (=0.0820 MJ m
−2 min
−1 ), d
ris the inverse relative distance Earth-Sun (=1+0.33cos (2 π J/365), where J is Julian day), ω
sis the sunset hour angle (=arccos(-tan( ϕ )tan( δ )), ϕ is the latitude [rad], and δ is solar decimation (=0.409sin(2 π J/365-1.39). In this study, the observed values of R
S↓ , T max , T min , e
a, and α were used to estimate R
LNand R
N.
III. EXPERIMENTAL SITE AND MEASUREMENTS
3.1. Site description
The study was conducted at three KoFlux sites: the Gwangneung deciduous forest site (i.e., GDK site), the Gwangneung coniferous site (i.e., GCK site), and the Haeman farmland site (i.e., HFK site). The GDK and GCK sites are located in the west-central part of the Korean Peninsula (37 o 45' 25.37'' N, 127 o 9' 11.62'' E, 340 above m.s.l for the GDK site and 37 o 45' 25.37'' N, 127 o 9' 11.62'' E, 175 above m.s.l for the GCK site).
These sites are located in a complex, hilly temperate forest catchment (~220 ha) with an average slope of 15 o and are aparted~1.2 km from each site within the catchment (Fig. 1). The GDK site is dominated by an old natural forest of Quercus sp. and Carpinus sp. (80- 200 years old) while the GCK site is dominated by conifer plantation mainly known as Abies sp. Further description of these sites can be found in Kim et al . (2006) and Lee et al . (2007).
The HFK site is located near the southwestern coast of the Korean Peninsula (34 o 33' 17.70'' N, 126 o 34' 7.11'' E, 13.74 m.s.l) with land cover types consisting of scattered rice paddies and various croplands. The major vegetation near the tower (within ~300 m) was seasonally cultivated crops such as beans, sweet pota- toes, Indian millet, and sesame. Beyond this area, rice paddies prevailed except for in the northern area. The topography in the HFK site was relatively flat at a regional scale (e.g., ~20 km). Detailed descriptions of the HFK site can be found Ryu et al . (2008).
R
N= ( R
S↓ R –
S↑ ) R + (
L↓ R +
L↑ )
1 = ( – α )R
S↓ R +
LNR
N= aR
S↓ b +
RN
σ
Tmax 4
+Tmin 4
--- 0.34 0.14 e2 ( – a) 1.35RS
↓
Rs0
--- 0.35–⎝ ⎠
⎛ ⎞
=
R
S0 = ( 0.75 2 10 + ⋅ – 5 z
h)R
dRa 24 60( )
---G
π
scdr[ω
ssin( )sinϕ
( ) cosδ
+ ( )cosϕ
( )sinδ
( )ω
s]=
3.2. Radiation measurements
Radiation was measured using a net radiometer (Model CNR1, Kipp & Zonen, Delft, the Netherlands) at 40m for the GDK and GCK sites and 15m for the HFK site. With CNR1, shortwave radiation (300-2800 nm) and longwave radiation (5-50 μ m) were separately measured. R
S↓ and R
S↑ are measured by two CM2 pyranometers and from these two measurements, albedo (defined as the ratio of outgoing to incoming shortwave radiation) is determined. R
L↓ and R
L↑ are measured by two CG3 pyrgeometers. The radiation and other meteorological measurements (e.g., temper- ature) were conducted and stored on a datalogger (Model CR-23X at the GDK site and CR-5000s at the GCK and HFK sites, Campbell Scientific Inc., Logan, Utah, USA). Totals of R
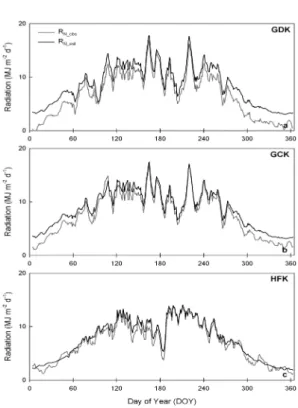
Nfor both daytime and 24-hr periods can be expressed as a function of total solar radiation (Ekern, 1965; Davies, 1965). In this study, over the 24-hr period, half-hourly data of R
Nand R
S↓ for 2008 were summed to estimate daily values and the daily values were used to find the dependence between R
Nand R
S↓ .
3.3. Error assessment
In order to evaluate the predicted R
N, several statistical methods were used. Mean bias error (MBE) is the sum of the residuals. A large deviation from zero implies that the estimation generally overestimates or underestimates compared to the observed values. Root-mean-square-error (RMSE) is the standard deviation of the residuals and indicates a goodness of the prediction. An index of agree- ment ( d ) is a measure of relative error in the estimation (Willmott, 1982). It ranges from 0 to 1, where 0 describes complete disagreement and 1 describes complete agree- ment between the observation and estimation.
(6) (7)
(8) MBE Y
est– Y
obs--- n
=
∑RMSE ( Y
est– Y
obs)
2--- n
=
∑d 1
Y
esti– Y
obsi( )
2i 1=
∑N
Y
est′ i+ Y
obs′ i( )
2i 1=
∑N