1. Introduction
1)
Visual environments have dominated human societies, represented by landscape, but the aural (or acoustic) aspect of our environments has recently been illuminated in terms of soundscape (Wrightson, 2000). Soundscape refers to acoustic environments with various sources (Genuit and Fiebig, 2006; Raimbault and Dubois, 2005), and it evaluates the perceptions of people to sounds
and the effects of sounds on people (Wrightson, 2000; Schulte-Forkamp and Fiebig, 2006). Some sounds can make people feel relaxed, which is interpreted to be positive. On the contrary, bothered or uncomfortable feelings can be arisen by unwanted (or undesirable) sounds.
Noise is a term to designate collective sounds that are negative acoustic by-products of human activities (Lipscomb and Roettger, 1976). It can be either occupational noise, emitted at workplaces,
** 본 연구는 2012학년도 상명대학교 교내연구비를 지원받아 수행하였음 과제번호 ( 2012-A000-0338)
** 상명대학교 지리학과 조교수(Assistant Professor, Department of Geography, Sangmyung University, Seoul, Republic of Korea)([email protected])
Road traffic noise and its impacts on land use and land cover of an urbanized area
Kim, Minho**
도로교통소음이 도시환경에 미치는 영향 토지피복을 중심으로: *
김 민 호 **
Abstract:Noise is defined to be unwanted (or undesirable) sounds, and it can be subdivided into occupational and environmental noises. The occupational noise is largely emitted from workplaces, but the environmental noise is produced from various sources such as transportation, construction, and even neighborhood. Transportation, particularly road vehicles, has been recognized to play a major role in emitting environmental noise and having adverse effects on urban communities. Considering this issue, this research investigated how severe the impacts of road traffic noise on a variety of land uses in a highly urbanized area, Fulton County, Georgia, United States.
Daytime and nighttime road traffic noise maps were derived with Traffic Noise Model that was developed by Federal Highway Administration at United States Department of Transportation. Individual noise maps were overlaid on three-tiered land use type maps in order to evaluate the magnitude of noise impacts on the study area, as a noise exposure assessment. This study found that many land use parcels and buildings were exposed to noise levels exceeding the guideline values of the World Health Organization and the Atlanta Code of Ordinance. Therefore, it would be required to take an action that can protect many urban residents from ill effects of road traffic noise.
Key Words:Environmental noise, road traffic, traffic noise model, noise maps, noise exposure assessment
요약 인간이 원치 않는 소리로 정의되는 소음은 크게 직장소음과 환경소음으로 구분될 수 있다 직장소음은 산업활: . 동이 이루어지는 작업장 내에서 주로 발생하나 환경소음은 교통 건설현장 심지어 이웃에 의해 발생한다 도로교통, , , . 소음은 환경소음을 배출하는 주요한 요인으로 인식되고 있고 도시지역에 부정적인 영향을 미치는 것으로 알려져 있 다 이를 고려하여 본 연구는 미국 조지아주의 풀턴 카운티를 대상으로 토지이용별 도로교통소음의 영향을 분석하였. , 다 이를 위해 미국 연방 도로관리국의 소음전파모델인 교통소음모델. (Traffic Noise Model)에 기반한 주 야간 소음지· 도를 제작하였다 연구지역의 도로교통소음의 정도를 파악하기 위해 단계로 구성된 토지피복 유형 자료에 각 소음지. 3 도를 중첩하여 각 토지피복 유형별 소음도를 분석하였다 본 연구를 통해 연구지역 내 많은 필지와 건물이 허용치를 . 초과하는 소음에 노출된 것을 확인하였다 특히 도로교통소음의 영향을 많이 받는 주거지역의 소음도를 줄이기 위한 . 방안이 마련되어야 할 것이다.
주요어 환경소음 도로교통 교통소음모델 소음지도 소음노출분석: , , , ,
or environmental noise, produced from roads, railways, airports, and even neighborhoods (Berglund et al., 1999). Transportation has been a major issue associated with noise in ancient era, and it was restricted in populated areas to protect people from being annoyed and sleep disturbed (WHO, 2001). For instance, ancient Rome did not allow iron-wheeled wagons to batter stone pavement, and some cities of Medieval Europe restricted horse carriage and riding (Lipscomb and Roegttger, 1976; Chepesiuk, 2005). In the modern world, transportation is considered to play a dominant role in generating environmental noises regardless economic status (Moudon, 2009; Gorai et al., 2007; Mehdi et al., 2011; Ko et al., 2011). The World Health Organization (WHO) recognizes that road traffic is the main source of environmental noise (WHO, 2012). The negative impacts of noise on human health were recognized more than half century ago (Moudon, 2009). Acute exposure to high- level noise could lead to hearing impairment by damaging inner hair cells of our ears that are not restored through our lives, and long-term exposure to the noise would cause permanent hearing loss. Occupational noise has been recognized to be major reason that caused noise-induced hearing loss (NIHL), but it was recently found that environmental noise also has a potential to develop NIHL (WHO, 2001;
Prasher, 2003). Recently Neitzel et al. (2009) reported high noise levels of the mass transportation systems in New York City, which were enough to produce NIHL in riders.
The other aspect of noise on human health is associated with psychosocial and physiological effects. Annoyance and sleep disturbance are viewed to be the most negative psychosocial impacts of noise (Stansfeld et al., 2000; Babisch, 2005; Murphy et al., 2009). In addition, noise exposure can alter physiological reactions of human body through chronic secretion of stress
hormones, which would develop biological risk factor (e.g., hypertension) and eventually manifest health disorders such as cardiovascular diseases (Ising et al., 1999; Stansfeld et al., 2000; Babisch, 2002; Rylander, 2004). According to the WHO (2011), environmental noise was found to affect many people in western European countries with ischemic heart disease, cognitive impairment, tinnitus, annoyance, and sleep disturbance.
Taking into consideration these adverse health impacts, the WHO has recognized noise to be an environmental pollution that needs to be abated and controlled for enhancing public health (Berglund et al., 1999). In recent years, the United States Centers for Disease Control and Prevention (CDC) has initiated environmental noise research project, focusing on road traffic noise. The CDC created the road traffic noise maps for Fulton County, Georgia, and estimated the number of people who were exposed to road traffic noise (Seong et al., 2011). Additionally, the CDC provided the estimates of annoyed and sleep-disturbed population and their spatial distributions over the county area (Kim et al., 2012).
This research aims at examining how severe the effects of road traffic noise on land use and land cover (LULC) types of Fulton County, Georgia, United States. This study is anticipated to facilitate the interpretation and identification of potential characterizations of site-specific noise impacts in an urban area, based on LULC types.
2. Data and methods
1) Data collection
Noise mapping is a fundamental procedure to
predict noise levels and to perform population
exposure assessment over a given area. There are
several standard mathematical models for road
traffic noise mapping (Murphy and King, 2010;
Seong et al., 2011), and this model-based noise prediction approach requires geographic information systems (GIS) data, e.g., topography, building footprints and heights, and road network, and traffic information such as traffic volume/speed and vehicle types (Ko et al., 2011; Seong et al., 2011; Kim et al., 2012).
We employed national elevation dataset of United States. Geological Survey (USGS) for surface topography. Individual building footprints were obtained from Fulton County, and Light Detection and Ranging dataset was used to derive the heights of Individual buildings. Road network and traffic-related data were obtained from the Georgia Department of Transportation and Atlanta Regional Commission. These data sets were entered into road traffic noise mapping.
The USGS provides nation-wide LULC data, called National Land Cover Data (NLCD), that have been generated from time-series Landsat satellite imagery. There is no available NLCD for 2008, so we utilized 2006 one with the assumption of no large differences between 2006 and 2008. We used parcel data because the NLCD lacks land use subclasses where human
activities frequently occur. In addition, this research employed individual buildings that have the attributes of the land use subclasses. The data sets of parcels and buildings were delivered from Fulton County, Georgia, United States.
2) Road traffic noise mapping
This research employed Traffic Noise Model (TNM) to create road traffic noise surfaces of our study area. The TNM is a mathematical noise-propagation model that has been developed by the United States Federal Highway Administration. This research produced two road traffic noise maps during daytime (07:00-22:00 hours) and nighttime (22:00-07:00 hours) periods, denoted by L
Dand L
N, respectively.
The L
Dand L
Nrepresent constant sound pressure level (Leq ), and their computations were based on the following equation:
s d i traffic i h
eq EL A A A
L ,1
= +
()+ +
where, EL
istands for the empirical noise level of i
thvehicle type, A
traffic(i)denotes the adjusted traffic flow of vehicle speed and volume, A
dLevel I Level II Level III
Agriculture
Residential
Apartment
Barren land Condominium
Forest House
Grassland Mobile home
Shrub land Commercial
Wetland Residential-commercial mixed
Water Health**
Urban Education School
Industrial Transportation
* Level I types were based on 2006 National Land Cover Dataset. Level II and Level III were associated with parcels and individual buildings, respectively.
** ‘Health’ indicates hospital buildings that appear in the study area.
Table 1. Land use and land cover types of Fulton County, Georgia, United States.*
means the adjusted distance of receiver from road, and A
sindicates the adjusted effects of shielding and ground between receiver and road.
All the noise metrics were calculated by using SoundPLAN
TM(version 7.0) that is one of the most frequently-utilized software package for environmental noise prediction. The noise calculation of the software package is based on a 3-D urban model with sound barrier, buildings, and topography that affect the propagation of sound.
3) Data analysis
This study used overlay analysis between road traffic noise maps and USGS NLCD and derived descriptive statistics to provide the overview of noise levels associated with each Type I class.
Regarding Type II and III classes, zonal analysis was applied to derive descriptive statistics of noise levels for each parcel and building, and spatial join was utilized to associate noise statistics with individual parcels and buildings.
This research conducted the exposure assessment of LULC, land parcels and building units against daytime and nighttime road traffic noise levels.
In addition, the guideline values of WHO (Berglund et al., 1999; WHO, 2009) and Atlanta Code of Ordinances (ACO) (ACC, 2003) for
road traffic noise were utilized for the exposure assessment. The values are summarized in Table 2.
3. Results
Predicted road traffic noise levels for Fulton County are depicted in Figures 1 (a) and (b) with 5-decibel increments according to the United States Environmental Protection Agency recommendation (EPA, 1982). Relatively higher noise levels were found to occur along Interstate Highways that pass through the county, regardless day and night. In Fulton County, there are 4 Interstate Highways including I-85, I-75, I-20, and I-285. This study obtained the county-wide average noise levels of 56dB(A) and 47dB(A) for daytime and nighttime, respectively, based on road traffic noise calculations.
This research estimated the average noise levels of LULC types that were derived with 2006 NLCD data. According to the estimation, the average noise levels of urban and barren land areas exceeded the county average, i.e., 5 7 59 dB(A) at day and 48 51dB(A) at night, ~ ~ respectively. Natural vegetation areas, covered with forest, shrub, and herb, had noise levels below the county average, i.e., daytime noise with 53 54dB(A) and nighttime one with 43 ~ ~
Land use World Health Organization Atlanta Code of OrdinancesDay Night Day Night
Residential 55 40 55 50
Commercial 70 70 65
Industrial 70 75 70
Transportation 70 N/A N/A
School** 55 N/A N/A N/A
*The WHO does not provide separate control values of daytime and nighttime noise for ‘Commercial’, ‘Industrial’, and ‘Transportation.’
**The criterion value was employed to assess road traffic noise impact on parcels and buildings that are designated for the purpose of education.
Table 2. Guideline values of an urban area against road traffic noise*
44dB(A), respectively. We discovered that agricultural and water areas were most quiet, considering road traffic noise of 51 52dB(A) ~ and 42dB(A) for daytime and nighttime, respectively.
This study also performed the exposure assessment of the noise, based on land parcels (n
»
34,400), and noticed similar average noise levels to the county-wide ones, i.e., 56dB(A) at day and 48dB(A) at night. Figures 2 (a) and (b) illustrate the descriptive statistics summary of daytime and nighttime noise levels, respectively, that affected each land use parcel. Regarding minimum noise, the lowest values appeared in residential and commercial parcels, and the highest one in education parcels. Residential, commercial, and transportation parcels were higher in maximum noise level compared to the others, and the largest maximum value was identified in transportation parcel.
Taking into account the percentages of each land use parcel against road traffic noise levels, this study discovered that 56% and 93% of
residential parcels were exposed to noise levels exceeding the daytime and nighttime WHO guideline values. In addition, it was found that approximately more than 75% of education parcels was exposed to noise levels greater than 55dB(A) during daytime. On the contrary, 93%
of commercial and industrial parcels satisfied the ACO noise regulations. It was difficult to estimate how many areas in the parcels were at risk because there are no available criterion values of both WHO and ACO for the other land use parcels such as residential-commercial mixed, health, and transportation. However, it was found that approximately more than 84 % of the land use parcels was impacted by daytime noise levels ranging from 45dB(A) to 70dB(A) and nighttime noise levels of 40 65dB(A) affected ~ over 81% of the land use parcels.
The exposure assessment of road traffic noise was further extended with individual buildings (n
»
304,000). This study found the average noise levels of all buildings to be 55dB(A) and 47 dB(A) for daytime and nighttime, respectively.
Figure 1. Road traffic noise maps of daytime (a) and nighttime (b) for Fulton County, Georgia, United States.
Figures 3(a) and (b) show the noise range of each land use type for individual buildings.
Considering minimum value, residential-commercial mixed and health buildings were exposed to relatively higher noise levels than the others. In particular, the minimum value of the mixed buildings was over twice as large as the lowest one. The highest values of maximum noise were observed in residential, education, and transportation with over 91dB(A) and 85dB(A) at day and night, respectively. Taking into account average values, commercial buildings were exposed to relatively higher road traffic noise. Residential-commercial mixed and hospital buildings were also affected by high noise levels, following commercial ones. The average noise
levels of residential buildings were similar to those of residential parcels, exceeding the WHO control values.
When it comes to the percentages of buildings exposed to the levels of road traffic noise, it was discovered that daytime noise levels ranging from 50 dB(A) to 70 dB(A) affected more than 66% of building units belonging to individual land use types. Most building units of the land use types (more than 80%) were exposed to nighttime noise levels from 40dB(A) to 65 dB(A). Taking into account the WHO noise control values, 49% and 86% of residential building units were exposed to noise levels exceeding 55dB(A) and 40dB(A) during daytime and nighttime, respectively. Based on the ACO,
Figure 2. Road traffic noise levels affecting parcel-based land uses at day (a) and night (b). Each number,centered in each box, indicates the mean level of road traffic noise for land-use parcels.
30% of commercial building units were affected by daytime noise levels greater than 70dB(A), and 15% of the units were exposed to nighttime ones higher than 65dB(A). Most transportation
building units satisfied the ACO guideline values.
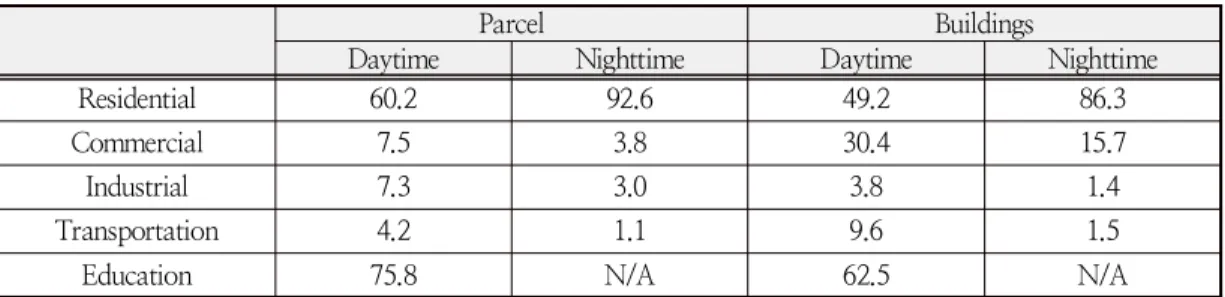
Table 3 summarizes the percentage of parcel and building areas that have noise values greater than guidelines of the WHO and the ACO,
Parcel Buildings
Daytime Nighttime Daytime Nighttime
Residential 60.2 92.6 49.2 86.3
Commercial 7.5 3.8 30.4 15.7
Industrial 7.3 3.0 3.8 1.4
Transportation 4.2 1.1 9.6 1.5
Education 75.8 N/A 62.5 N/A
*Daytime and nighttime noise control values for ‘Residential’, ‘Commercial’, ‘Education’, and ‘Industrial’ are based on the guideline values of WHO and ACO that are addressed in Table 2. The control values of ‘Residential’,
‘Transportation’, and ‘Education’ are borrowed from the WHO, and those of ‘Commercial’ and ‘Industrial’ from the ACO.
Table 3. Percentage of parcels and buildings exceeding daytime and nighttime noise control values (unit: %).
Figure 3. Road traffic noise levels affecting building-based land uses during daytime (a) and nighttime (b). Each number, centered in each box, indicates the mean level of road traffic noise for land-use buildings.
considering Level II LULC. The impacts of road traffic noise were found to be less severe in
‘Commercial’, ‘Industrial’, and ‘Transportation’
than ‘Residential’ and ‘Education.’ However, according to the table, it would be urgently required to make some efforts to abate noise levels in ‘Residential’ and ‘Education’ LULC parcels and buildings.
Figure 4 illustrates the percentages of residential building subclasses that were exposed to road traffic noise levels. Based on the figure, daytime noise levels higher than 55dB(A) affected 75% of mobile homes, 67% of apartment and condominium units, and 47% of houses. In addition, nighttime noise levels greater than 40dB(A) impacted 86%
of all the residential building units in the study area.
4. Conclusions
This research demonstrated that the environ-
mental quality of an urban community might be poor from the perspective of overall traffic noise level for Fulton County, Georgia, United States, based on noise exposure assessments with three- tiered LULC types. A recent study of road traffic noise reported that 20% and 30% of residential building units were exposed to noise levels exceeding 55dB(A) and 45dB(A), representing respective daytime and nighttime WHO noise control values, for a rural Chittenden County, Vermont, United States (Kaliski et al., 2007).
This study also found much more building units to be exposed to road traffic noise exceeding the WHO values, i.e., 49% and 86%, for the highly urbanized Fulton County, which could explicitly indicate the poor quality of living environment in urbanized community.
The European Union has recently adopted strategic noise mapping to produce noise maps, to assess how many people are affected by the noise, and to adopt noise- abatement policies in urbanized areas. Although this research largely investigated the impacts of road traffic noise on land use types, it might also provide a clue of the magnitude of the noise effects on residents who live in Fulton County, Georgia, United States. This noise-related concern would be similarly applied to highly- urbanized areas of developing countries such as Seoul, Republic of Korea. Therefore, it could be required to take nation-wide actions in terms of protecting people at risk with road traffic noise and making urbanized areas environmentally healthier.
Acknowledgement
This research has been supported by Sangmyung University, Seoul, Republic of Korea (grant number:
2012-A000-0338). The author thanks Dr. Seo Il Chang, University of Seoul, Seoul, Republic of Korea, and Dr. Jeong Chang Seong, University of West Georgia, Georgia, United States, for
Figure 4. Impacts of road traffic noise on residen-tial building subclasses during daytime (a) and nighttime (b).