DOI 10.17480/psk.2018.62.2.135
Treatment medication patterns and follow-up evaluation on clinical, biochemical, and laboratory parameters in patients with hepatitis B virus infection
Young-Mo Yang
*†, Sun Hee Park
**†, In Choe
**, and Eun Joo Choi
*,#*
Department of Pharmacy, College of Pharmacy, Chosun University, Gwangju, South Korea
**
Department of Pharmacy, Chosun University Hospital, Gwangju, South Korea (Received March 7, 2018; Revised April 20, 2018; Accepted April 24, 2018)
Abstract — The aims of this study were to compare the efficacy between tenofovir (TDF) and entecavir (ETV) mono- therapy for 24 months and to assess the gender differences in the clinical prognosis in Korean patients with chronic hepatitis B (CHB). This study was retrospectively conducted with hepatitis B virus (HBV)-infected patients taking TDF or ETV between July 2012 and June 2016 in Chosun University Hospital, Gwangju, South Korea. Data were collected through the review of Electronic Medical Records. Among 1,450 patients during the study period, 130 were selected based on inclusion and exclusion criteria. At baseline, the rate of hepatitis B envelope antigen (HBeAg)-positivity in TDF was higher than that of HBeAg-positivity in ETV, showing a significant difference (84.4% vs. 57.8%, p = 0.0020). However, these rates in both TDF and ETV became similar at 3 months, and this tendency had continued after 3 months. There were no significant dif- ferences in the changes of aspartate aminotransferase (AST) and alanine aminotransferase (ALT) levels during the follow- up period between TDF and ETV. However, these levels were almost normalized within 3 months, and the normal levels had also been kept after 3 months. Men tended to have more liver cirrhosis or hepatocellular carcinoma than women. ALT levels had been continuously higher in men than in women, showing significant differences at 3, 6, 12, and 24 months. TDF is more likely than ETV to be a potent option for CHB patients with severe liver diseases, especially men, because TDF tended to decrease the parameters related with HBV infection (e.g., ALT, AST, and HBV DNA level) more rapidly within 3 months than ETV.
Keywords chronic hepatitis B, hepatitis B virus, tenofovir, entecavir, efficacy, gender
Approximately 257 million people worldwide have hepatitis B virus (HBV) infection that is characterized by the presence of hepatitis B surface antigen (HBsAg); this infection can result in the development of complications such as cirrhosis and hepatocellular carcinoma (HCC), which may result in death.
1)This can be almost completely prevented by using cur- rently available vaccines. Since vaccines against HBV were commercialized, the infection rate has gradually decreased;
however, according to a report from the Korean Ministry of Health and Welfare in 2012, the rate of hepatitis B envelope antigen (HBeAg)-positivity was 3.4% in males and 2.6% in
females, which indicated that approximately 3.0% of the total Korean population were infected with HBV.
2)Viral suppression through oral antiviral therapy with nucleot(s)ide analogs (NAs) has prevented disease progres- sion in patients with chronic hepatitis B (CHB), leading to a reduction in the development of hepatic decompensation, cir- rhosis, and HCC.
3-5)However, antiviral resistance, which usu- ally occurs in long-term therapy, and the failure of complete viral suppression contribute to a reduction in therapeutic bene- fits.
6,7)The currently available NAs for the treatment of CHB in Korea include lamivudine (LAM), telbivudine (TEL), clevu- dine (CLV), adefovir (ADV), entecavir (ETV), and tenofovir (TDF).
2,8)NAs with high genetic barriers to resistance, such as TDF and ETV, are strongly recommended by the current clinical practice guidelines as the first-line agents for the treat- ment of CHB;
2,9)specifically, either TDF or ETV is recom- mended for patients aged ≥ 12 years and ETV is recommended for patients aged between 2 and 11 years.
9)#
Corresponding Author Eun Joo Choi
Department of Pharmacy, College of Pharmacy, Chosun Univer- sity, 309 Pilmun-daero, Dong-gu, Gwangju 61452, Korea
Tel.: 062-230-6382 Fax.: 062-222-5414 E-mail: [email protected]
†
Joint first authors and contributed equally to this work.
Short Report
종설TDF is a potent nucleotide analog used to treat HBV infec- tion.
10)It exhibited sustained antiviral efficacy in treatment- naïve patients with CHB and it was effective in patients with CHB with an altered response to NAs.
11,12)TDF demon- strated a similar efficacy in patients with LAM failure as that in NA-naïve patients with CHB, independent of the presence of antiviral resistance conferred by mutations.
13)In addition, TDF exhibited excellent and long-term efficacy, even in patients with CHB who experienced NA treatment failure.
14)However, TDF had lower efficacy in patients with CHB and previous ADV exposure than in NA-naïve patients with CHB.
15)ETV is another potent nucleoside for the treatment of HBV-infected patients.
10)HBV resistance to ETV is not common in NA- naïve patients with CHB; furthermore, long-term ETV ther- apy in these patients led to the reversal of fibrosis/cirrhosis and sustained histological improvement.
6,10,16)However, ETV resistance during therapy was noted in NA-experienced patients with CHB and suboptimal viral suppression was also reported in NA-naïve patients with CHB owing to poor adher- ence and individual genetic variation.
10)Although several studies of the efficacy of TDF or ETV have been conducted in Korean patients with CHB, long-term follow-up data are still lacking.
8,15,17-20)In addition, among HBV-infected patients, men are more likely than women to have an increased risk for the development of severe liver dis- eases
21), but studies focusing on differences between men and women in the prognostic values of HBV infection have been scarce in Korea. Therefore, the aims of this study were to
compare the efficacy of TDF and ETV monotherapy for 24 months and to evaluate the sex-based differences in the clini- cal prognosis of Korean patients with CHB.
Methods
The Institutional Review Board of Chosun University Hospi- tal granted ethical approval for the study (IRB No 2016-11- 021). The requirement for informed consent from the study patients was waived because their data were de-identified and encoded anonymously prior to analysis. This retrospective study included NA-naïve and NA-experienced patients with HBV infection who were administered TDF or ETV between July 2012 and June 2016 at Chosun University Hospital, Gwangju, South Korea. The follow-up period was 24 months.
The following exclusion criteria were applied: patients aged <
18 years, patients with alcoholic or autoimmune liver disease, patients who had taken antiviral drugs for < 12 weeks, or patients for whom insufficient information on demographics and clinical factors was available.
Through a retrospective chart review of the electronic medi- cal records (EMRs) of selected patients, a trained hospital pharmacist collected the following information by using paper case report forms: demographic characteristics (e.g., sex, age, body mass index [BMI], height, and weight), family history of HBV, alcohol consumption, previous treatment for HBV, comor- bidities, prescribed medications for HBV, and laboratory values (e.g., HBeAg positivity, HBV DNA level, aspartate aminotrans-
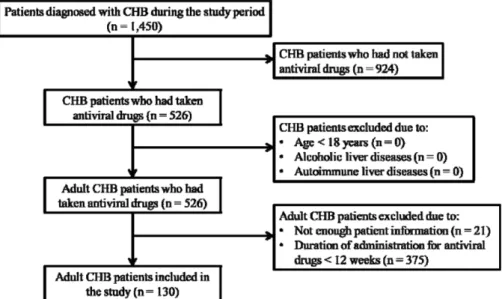
Fig. 1 − Flow diagram of steps in the selection of study subjects. CHB, chronic hepatitis B.
ferase [AST], alanine aminotransferase [ALT], total bilirubin, albumin, and serum creatinine).
All statistical analyses were computed by using SAS, ver- sion 9.3 (SAS Institute Inc., Cary, NC, USA). The demo- graphic variables and clinical characteristics of patients selected in this study were examined by using descriptive sta- tistics. The mean and standard deviation were utilized to present continuous variables, whereas frequencies (n) and percentages (%) were used for the presentation of categorical variables. The Chi-square test or Fisher’s exact test was used to compare cat- egorical data and the independent t-test was utilized for contin- uous data. Logistic regression analysis was used to identify the predictive factors of adequate HBV DNA suppression (HBV DNA < 50 IU/mL). The results were presented as odds ratios (ORs) with their 95% confidence intervals (CIs). Values were considered statistically significant for p < 0.05.
Results
During the study period, 1,450 patients were diagnosed with HBV infection; among these patients, 130 who met the inclu- sion criteria and did not meet the exclusion criteria were
included for the analysis (Figure 1). The baseline characteris- tics of the patients are presented in Tables I and II and arranged by sex and treatment drug. The mean patient age was 53.8±12.2 years; 83.1% of patients were younger than 65 years. Most patients were men (69.2%) and HBeAg-positive (73.4%). The mean HBV DNA level was 5.9±1.6 log
10IU/mL.
The mean ALT was 125.7±281.1 IU/L. Tenofovir and enteca- vir were used in 61.5% and 38.5% patients, respectively. A large percentage of patients were treatment-experienced. The rate of HBeAg-positivity was significantly higher in patients receiving tenofovir than in those receiving entecavir (p = 0.0020). However, the rate of previous treatment for HBV was significantly higher in patients receiving entecavir than in those receiving tenofovir (p = 0.0056).
The changes in serological, virological, and biochemical fac- tors at baseline, 3, 6, 12, and 24 months are presented in Table 3, according to sex. At baseline and during the follow-up period, there were no statistically significant differences in the rate of HBeAg-positivity between men and women. At base- line, the HBV DNA level was higher in women (6.4±1.4 log
10IU/mL) than in men (5.6±1.7 log
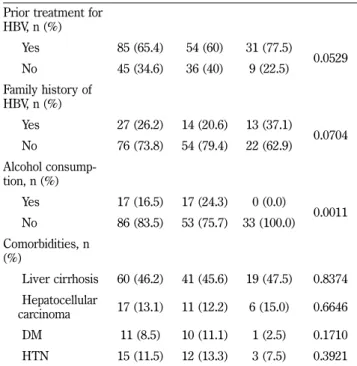
10IU/mL); this difference was statistically significant (p = 0.0336). However, during the fol- low-up period, significant differences in the HBV DNA level Prior treatment for
HBV, n (%)
Yes 85 (65.4) 54 (60) 31 (77.5)
0.0529
No 45 (34.6) 36 (40) 9 (22.5)
Family history of HBV, n (%)
Yes 27 (26.2) 14 (20.6) 13 (37.1)
0.0704 No 76 (73.8) 54 (79.4) 22 (62.9)
Alcohol consump- tion, n (%)
Yes 17 (16.5) 17 (24.3) 0 (0.0)
0.0011 No 86 (83.5) 53 (75.7) 33 (100.0)
Comorbidities, n (%)
Liver cirrhosis 60 (46.2) 41 (45.6) 19 (47.5) 0.8374 Hepatocellular
carcinoma 17 (13.1) 11 (12.2) 6 (15.0) 0.6646
DM 11 (8.5) 10 (11.1) 1 (2.5) 0.1710
HTN 15 (11.5) 12 (13.3) 3 (7.5) 0.3921 Continuous variable: mean±standard deviation (SD); Categorical variable: n (%)
HBeAg-positive, hepatitis B envelope antigen-positive; HBV DNA, hepatitis B virus deoxyribonucleic acid; ALT, alanine aminotransferase; BUN, blood urea nitrogen; DM, diabetes mellitus; HTN, hypertension.
Table I − Baseline characteristics of the patients according to gender
Variables Overall Men Women p - value
Age (years) 53.8±12.2 53.4±12.13 54.7±12.3 0.5930 ≥ 65, n (%) 22 (16.9) 12 (13.3) 10 (25.0)
0.1016 < 65, n (%) 108 (83.1) 78 (86.7) 30 (75.0)
HBeAg-positive, n
(%) 80 (73.4) 58 (74.4) 22 (71) 0.7178
HBV DNA level
(log
10IU/mL) 5.9±1.6 5.6±1.7 6.4±1.4 0.0336 Undetectable HBV
DNA, n (%) 14 (11.5) 8 (9.3) 6 (16.7) 0.2444 ALT (IU/L) 125.7±281.1141.4±329.4 90.4±108.7 0.3417 Total bilirubin
(mg/dL) 1.2±1.5 1.3±1.6 1.0±1.1 0.2532
Albumin (g/dL) 4.1±0.6 4.0±0.6 4.1±0.6 0.4253 Creatinine (mg/dL) 1.0±0.2 1.1±0.2 0.8±0.1 < 0.0001 Creatinine ≥ 1.4
mg/dL, n (%) 7 (5.4) 7 (7.9) 0 (0.0) 0.0983 BUN (mmol/L) 14.0±4.2 14.7±4.3 12.5±3.5 0.0042 HBV Treatment
drug, n (%)
Tenofovir 80 (61.5) 56 (62.2) 24 (60.0)
0.8100
Entecavir 50 (38.5) 34 (37.8) 16 (40.0)
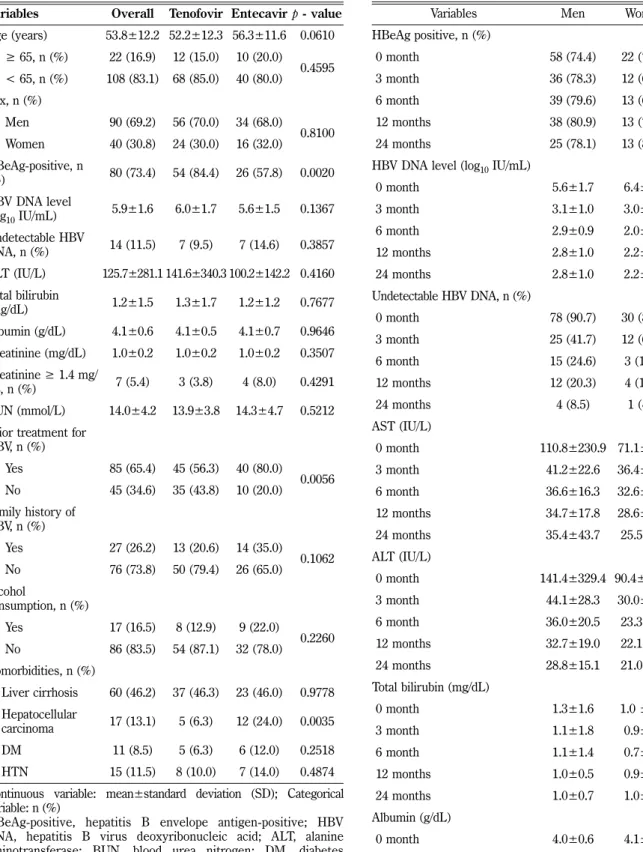
were not observed between men and women. Overall, the ALT level was higher in men than in women at baseline and Table II − Baseline characteristics of the patients according to
treatment drugs
Variables Overall Tenofovir Entecavir p - value Age (years) 53.8±12.2 52.2±12.3 56.3±11.6 0.0610
≥ 65, n (%) 22 (16.9) 12 (15.0) 10 (20.0)
0.4595 < 65, n (%) 108 (83.1) 68 (85.0) 40 (80.0)
Sex, n (%)
Men 90 (69.2) 56 (70.0) 34 (68.0)
0.8100 Women 40 (30.8) 24 (30.0) 16 (32.0)
HBeAg-positive, n
(%) 80 (73.4) 54 (84.4) 26 (57.8) 0.0020 HBV DNA level
(log
10IU/mL) 5.9±1.6 6.0±1.7 5.6±1.5 0.1367 Undetectable HBV
DNA, n (%) 14 (11.5) 7 (9.5) 7 (14.6) 0.3857 ALT (IU/L) 125.7±281.1 141.6±340.3 100.2±142.2 0.4160 Total bilirubin
(mg/dL) 1.2±1.5 1.3±1.7 1.2±1.2 0.7677
Albumin (g/dL) 4.1±0.6 4.1±0.5 4.1±0.7 0.9646 Creatinine (mg/dL) 1.0±0.2 1.0±0.2 1.0±0.2 0.3507 Creatinine ≥ 1.4 mg/
dL, n (%) 7 (5.4) 3 (3.8) 4 (8.0) 0.4291 BUN (mmol/L) 14.0±4.2 13.9±3.8 14.3±4.7 0.5212 Prior treatment for
HBV, n (%)
Yes 85 (65.4) 45 (56.3) 40 (80.0)
0.0056 No 45 (34.6) 35 (43.8) 10 (20.0)
Family history of HBV, n (%)
Yes 27 (26.2) 13 (20.6) 14 (35.0)
0.1062 No 76 (73.8) 50 (79.4) 26 (65.0)
Alcohol
consumption, n (%)
Yes 17 (16.5) 8 (12.9) 9 (22.0)
0.2260 No 86 (83.5) 54 (87.1) 32 (78.0)
Comorbidities, n (%)
Liver cirrhosis 60 (46.2) 37 (46.3) 23 (46.0) 0.9778 Hepatocellular
carcinoma 17 (13.1) 5 (6.3) 12 (24.0) 0.0035
DM 11 (8.5) 5 (6.3) 6 (12.0) 0.2518
HTN 15 (11.5) 8 (10.0) 7 (14.0) 0.4874 Continuous variable: mean±standard deviation (SD); Categorical variable: n (%)
HBeAg-positive, hepatitis B envelope antigen-positive; HBV DNA, hepatitis B virus deoxyribonucleic acid; ALT, alanine aminotransferase; BUN, blood urea nitrogen; DM, diabetes mellitus; HTN, hypertension.
Table III − Changes in serological, virological, and biochemical factors at baseline, 12, and 24 months by gender
Variables Men Women p - value
HBeAg positive, n (%)
0 month 58 (74.4) 22 (71.0) 0.7178
3 month 36 (78.3) 12 (66.7) 0.3355
6 month 39 (79.6) 13 (68.4) 0.3298
12 months 38 (80.9) 13 (72.2) 0.4489
24 months 25 (78.1) 13 (81.3) 1.0000
HBV DNA level (log
10IU/mL)
0 month 5.6±1.7 6.4±1.4 0.0336
3 month 3.1±1.0 3.0±1.3 0.8155
6 month 2.9±0.9 2.0±0.4 0.1086
12 months 2.8±1.0 2.2±0.7 0.3506
24 months 2.8±1.0 2.2±0.7 0.3506
Undetectable HBV DNA, n (%)
0 month 78 (90.7) 30 (83.3) 0.2444
3 month 25 (41.7) 12 (60.0) 0.1544
6 month 15 (24.6) 3 (12.5) 0.2561
12 months 12 (20.3) 4 (14.3) 0.5680
24 months 4 (8.5) 1 (4.5) 1.0000
AST (IU/L)
0 month 110.8±230.9 71.1±64.4 0.2878
3 month 41.2±22.6 36.4±18.4 0.2998
6 month 36.6±16.3 32.6±11.3 0.2244
12 months 34.7±17.8 28.6±10.7 0.0774
24 months 35.4±43.7 25.5±7.6 0.2488
ALT (IU/L)
0 month 141.4±329.4 90.4±108.7 0.3417
3 month 44.1±28.3 30.0±12.8 0.0097
6 month 36.0±20.5 23.3±9.0 0.0023
12 months 32.7±19.0 22.1±6.7 0.0025
24 months 28.8±15.1 21.0±9.6 0.0180
Total bilirubin (mg/dL)
0 month 1.3±1.6 1.0 ± 1.1 0.2532
3 month 1.1±1.8 0.9±1.3 0.5725
6 month 1.1±1.4 0.7±0.3 0.2044
12 months 1.0±0.5 0.9±1.1 0.8541
24 months 1.0±0.7 1.0±1.3 0.8190
Albumin (g/dL)
0 month 4.0±0.6 4.1±0.6 0.4253
3 month 4.2±0.5 4.1±0.6 0.4834
6 month 4.3±0.5 4.1±0.5 0.0799
12 months 4.3±0.4 4.2±0.5 0.1602
24 months 4.3±0.4 4.2±0.7 0.4813
during the follow-up period. After 3 months, the ALT level was almost normalized in both men and women and its level remained stable during the remaining follow-up period. The changes in serological, virological, and biochemical factors at baseline, 3, 6, 12, and 24 months are presented in Table 4,
according to treatment drugs. At baseline, the rate of HBeAg- positivity was significantly higher in patients treated with TDF (84.4%) than in those treated with ETV (57.8%) (p = 0.0020).
However, no significant differences in the rate of HBeAg-posi- tivity were noted between both groups during the follow-up period. At baseline, the HBV DNA level was higher in patients treated with TDF (6.0±1.7 log
10IU/mL) than in those treated with ETV (5.6±1.5 log
10IU/mL). However, HBV DNA levels were lower in the TDF group than in the ETV group during the entire follow-up period. The ALT level was higher in the TDF group than in the ETV group at baseline, but similar in both groups throughout the whole follow-up period.
Univariate analyses were performed to assess the factors associated with a complete virologic response (CVR) 12 and 24 months after the initiation of treatment. No factors were asso- ciated with CVR. Two multivariate analyses were performed:
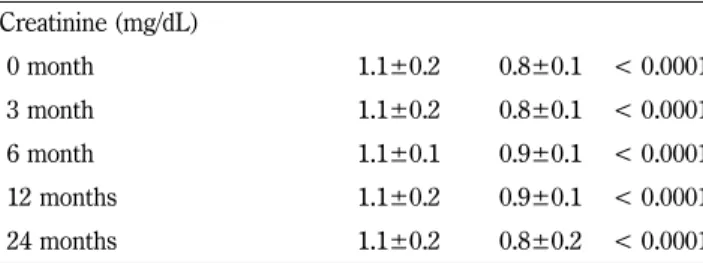
Creatinine (mg/dL)
0 month 1.1±0.2 0.8±0.1 < 0.0001
3 month 1.1±0.2 0.8±0.1 < 0.0001
6 month 1.1±0.1 0.9±0.1 < 0.0001
12 months 1.1±0.2 0.9±0.1 < 0.0001
24 months 1.1±0.2 0.8±0.2 < 0.0001
Continuous variable: mean±standard deviation (SD); Categorical variable: n (%)
HBeAg-positive, hepatitis B envelope antigen-positive; HBV DNA, hepatitis B virus deoxyribonucleic acid; AST, aspartate aminotransferase; ALT, alanine aminotransferase.
ALT (IU/L)
0 month 141.6±340.3 100.2±142.2 0.4160
3 month 41.7 ± 29.4 37.7±17.8 0.4280
6 month 34.5±21.2 28.2±12.3 0.1154
12 months 28.7±18.4 29.9±13.7 0.7234
24 months 26.4±14.8 25.8±12.9 0.8583
Total bilirubin (mg/dL)
0 month 1.3±1.7 1.2±1.2 0.7677
3 month 0.9±0.9 1.3±2.5 0.2068
6 month 0.8±0.4 1.3±2.0 0.1016
12 months 0.9±0.9 1.0±0.5 0.6836
24 months 1.0±1.0 1.1±0.8 0.8247
Albumin (g/dL)
0 month 4.1±0.5 4.1±0.7 0.9646
3 month 4.2±0.4 4.1±0.7 0.3208
6 month 4.3±0.4 4.1±0.6 0.1481
12 months 4.3±0.3 4.1±0.6 0.0087
24 months 4.4±0.2 4.2±0.7 0.2968
Creatinine (mg/dL)
0 month 1.0±0.2 1.0±0.2 0.3507
3 month 1.0±0.2 1.1±0.2 0.8324
6 month 1.1±0.2 1.0±0.2 0.4282
12 months 1.0±0.2 1.1±0.2 0.5020
24 months 1.0±0.2 1.0±0.2 0.7374
Continuous variable: mean±standard deviation (SD); Categorical variable: n (%)
HBeAg-positive, hepatitis B envelope antigen-positive; HBV DNA, hepatitis B virus deoxyribonucleic acid; AST, aspartate aminotransferase; ALT, alanine aminotransferase.
Table IV − Changes in serological, virological, and biochemical factors at baseline, 12, and 24 months by treatment drugs Variables Tenofovir Entecavir p - value HBeAg-positive, n (%)
0 month 54 (84.4) 26 (57.8) 0.0020
3 month 35 (76.1) 13 (72.2) 0.7482
6 month 37 (78.7) 15 (71.4) 0.5123
12 months 35 (79.5) 16 (76.2) 0.7583
24 months 25 (78.1) 13 (81.3) 1.0000
HBV DNA level (log
10IU/mL)
0 month 6.0±1.7 5.6±1.5 0.1367
3 month 2.7±0.8 3.6±1.2 0.0150
6 month 2.5±0.4 3.6±1.4 0.0184
12 months 2.1±0.4 3.1±1.2 0.0431
24 months 2.1±0.4 3.1±1.2 0.0431
Undetectable HBV DNA, n (%)
0 month 67 (90.5) 41 (85.4) 0.3857
3 month 19 (37.3) 18 (62.1) 0.0324
6 month 13 (21.7) 5 (20.0) 0.8639
12 months 8 (14.3) 8 (25.8) 0.1840
24 months 1 (2.6) 4 (13.3) 0.1590
AST (IU/L)
0 month 111.5±239.3 78.1±89.7 0.3469
3 month 39.0±19.6 41.4±24.8 0.5722
6 month 35.7±16.2 34.8± 2.6 0.7815
12 months 30.0±11.8 37.0±20.5 0.0352
24 months 36.4±46.8 26.2±8.1 0.2145
the first included HBeAg positivity, baseline HBV DNA, and the presence of liver cirrhosis as confounding factors and sex as an independent variable; the second one included HBeAg positivity, baseline HBV DNA, and the presence of liver cirrho- sis as confounding factors and treatment drug as an indepen- dent variable. Only treatment drug was associated with CVR at 24 months (OR, 17.96; 95% confidence interval [CI], 1.48–
218.32; p = 0.0235) (Table V).
Discussion
TDF and ETV, which have high genetic barriers against resistance, are currently the most potent antiviral agents for the treatment of HBV infection; therefore, it is important to pay close attention to their use as a long-term treatment with-
out the loss of their potency in patients with CHB.
22)The present study compared the efficacy of TDF and ETV and evaluated the sex-based disparities in the clinical characteris- tics and prognosis of Korean HBV-infected patients. Based on the results of this study, TDF and ETV were likely to have at least similar efficacy for the treatment of HBV infection and the clinical characteristics and prognosis between men and women with HBV infection treated with TDF or ETV might also be similar.
In this study, the efficacy of TDF and ETV was compared based on the changes in serological, virological, and biochemi- cal factors over 24 months. At baseline, the rate of HBeAg- positivity in patients treated with TDF was higher than that in patients treated with ETV, showing a significant difference (84.4% vs. 57.8%, p = 0.0020). However, this rate was similar Table V − Univariate and multivariate analyses of factors related with complete virologic response
Variables Univariate analysis Multivariate analysis
aModel 1
bModel 2
cOR (95% CI) p - value OR (95% CI) p - value OR (95% CI) p - value Month 12
Age, years (≥ 65 vs. < 65) 1.06 (0.26-4.26) 0.9297
Sex (Men vs. Women) 0.66 (0.20-2.24) 0.4983 0.88 (0.22-3.70) 0.8660 HBeAg-positive (positive vs. negative) 0.14 (0.02-1.20) 0.0727
Baseline HBV DNA, log
10IU/mL 0.80 (0.54-1.16) 0.2333
Baseline ALT, IU/L 1.00 (1.00-1.00) 0.4929
Treatment drug (tenofovir vs. entecavir) 2.08 (0.70-6.26) 0.1894 3.24 (0.90-11.56) 0.0712 Prior treatment for HBV (experienced vs.
naïve) 0.48 (0.16-1.44) 0.1894
Presence of liver cirrhosis (Yes vs. No) 3.08 (0.90-10.48) 0.0711 Month 24
Age, years (≥ 65 vs. < 65) 0.92 (0.10-9.02) 0.9451
Sex (Men vs. Women) 0.52 (0.06-4.86) 0.5601 0.86 (0.08-10.42) 0.9030 HBeAg-positive (positive vs. negative) 0.00 (0.00-0.00) 0.9547
Baseline HBV DNA, log
10IU/mL 1.10 (0.62-1.96) 0.7568
Baseline ALT, IU/L 1.02 (0.98-1.04) 0.3451
Treatment drug (tenofovir vs. entecavir) 5.84 (0.62-55.32) 0.1236 17.96 (1.48-218.32) 0.0235 Prior treatment for HBV (experienced vs.
naïve) 0.74 (0.12-4.72) 0.7434
Presence of liver cirrhosis (Yes vs. No) 1.82 (0.28-11.58) 0.5307 OR, Odds ratio; CI, confidence interval
HBeAg-positive, hepatitis B envelope antigen-positive; HBV DNA, hepatitis B virus deoxyribonucleic acid; ALT, alanine aminotransferase.
Complete virologic response: undetected serum HBV DNA by real-time polymerase chain reaction (PCR)
a
Both analyses were adjusted for HBeAg positivity, baseline HBV DNA level, and presence of cirrhosis.
b
Model 1 used gender as an independent variable.
c