• 검색 결과가 없습니다.

Quantitative Structure Activity Relationship between Diazabicyclo- [4.2.0]octanes Derivatives and Nicotinic Acetylcholine Receptor Agonists

N/A
N/A
Protected

Academic year: 2022

Share "Quantitative Structure Activity Relationship between Diazabicyclo- [4.2.0]octanes Derivatives and Nicotinic Acetylcholine Receptor Agonists"

Copied!
5
0
0

로드 중.... (전체 텍스트 보기)

전체 글

(1)

55

ABBREVIATIONS: nAChRs, nicotinic acetylcholine receptors; CNS, central nervous system; Ach, acetylcholine; GABA, γ-aminobutyric acid; 3D-QSAR, three dimensional quantitative structure activity relationship; pEC

50

, -log EC

50

; CoMFA, comparative molecular field analysis; CoMSIA, comparative molecular similarity indices analysis.

Corresponding to: Chaeuk Im, College of Pharmacy, Chung-Ang University, 221, Heuksuk-dong, Dongjak-gu, Seoul 156-756, Korea.

(Tel) 82-2-820-5603, (Fax) 82-2-816-7338, (E-mail) Chaeukim@

cau.ac.kr

Quantitative Structure Activity Relationship between Diazabicyclo- [4.2.0]octanes Derivatives and Nicotinic Acetylcholine Receptor Agonists

Eun Ae Kim, Kyoung Chul Jung, Uy Dong Sohn, and Chaeuk Im College of Pharmacy, Chung-Ang University, Seoul 156-756, Korea

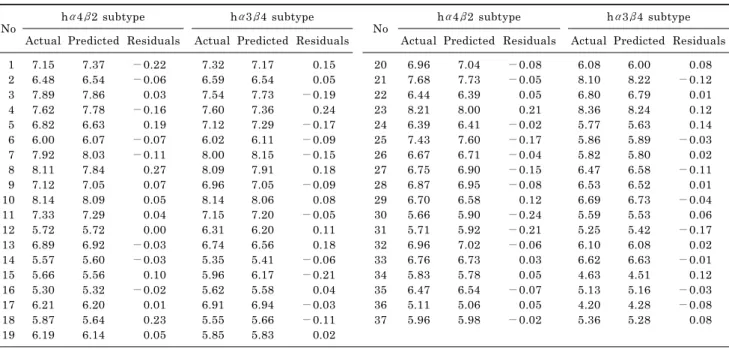
Three dimensional quantitative structure activity relationship between diazabicyclo[4.2.0]octanes and nicotinic acetylcholine receptor (hα4β2 and hα3β4) agonists was studied using comparative molecular field analysis (CoMFA) and comparative molecular similarity indices analysis (CoMSIA). From 11 CoMFA and CoMSIA models, CoMSIA with steric and electrostatic fields gave the best predictive models (q

2

=0.926 and 0.945, r

2ncv

=0.983 and 0.988). This study can be used to develop potent hα4β2 receptor agonists with low activity on hα3β4 subtype.

Key Words: Diazabicyclo[4.2.0]octanes, CoMFA, CoMSIA, Nicotinic acetylcholine receptors (nAChRs)

INTRODUCTION

The nicotinic acetylcholine receptors (nAChRs) are li- gand-gated ion channels widely distributed in central nerv- ous system (CNS) (Hogg & Bertrand, 2004; Cashin et al, 2007; Lape et al, 2008). The agonists bind to nAChR re- ceptors and result in conformational change of the re- ceptors, which lead to channel opening for the permeation of Na

ion. They mediate acetylcholine (Ach) neuro- transmission and adjust the activities of neurotransmitters such as dopamine, serotonin, glutamate, and GABA (Girod et al, 2000; Kenny et al, 2000; Dehkordi et al, 2007; Grady et al, 2007). These receptors are associated with diseases such as epilepsy, cognition disorders, Alzheimer’s diseases, Parkinson’s diseases, and nicotine addiction (Dougherty et al, 2003; Vincler & McIntosh, 2007; Hays et al, 2008;

Kuryatov et al, 2008; Owen et al, 2008; O'Leary et al, 2008;

Pons et al, 2008). The nAChRs can be classified according to several subunits. The major subtype of nAChRs in the CNS is α4β2, whereas the α3β4 subtype is found mainly in the peripheral nervous system (Jensen et al, 2005; Gotti et al, 2006).

The α4β2 subtype has become an important therapeutic target for analgesics, while the activity at the α3β4 sub- type is known to be related to the side effects on gastro- intestinal and cardiovascular systems. The 3,8-dia- zabicyclo[4.2.0]octane compounds are very active an- algesics, and some of them show nanomolar potency in the hα4β2 receptor subtype. However, they are not selective for α4β2 over α3β4 subtypes (Frost et al, 2006).

From the quantitative structure - activity relationship (QSAR) studies, the characteristics of virtual receptor site and biological activity of unknown compounds can be

predicted. Therefore, we have performed QSAR analysis to develop active compounds for α4β2 but with low potency for α3β4 subtypes, thereby which leading to potential an- algesics with less side effects.

METHODS

The 44 compounds with nicotinic acetylcholine receptor agonistic activity were taken from the literature for 3D-QSAR analysis, in which 37 compounds (1∼37) were used for training set and 7 compounds (T1∼T7) were se- lected for test set (Frost et al, 2006). The pEC

50

(−log EC

50

) was calculated from the biological data (EC

50

) and used in 3D-QSAR analysis. The structures of training and test sets are shown in Table 1 & 2.

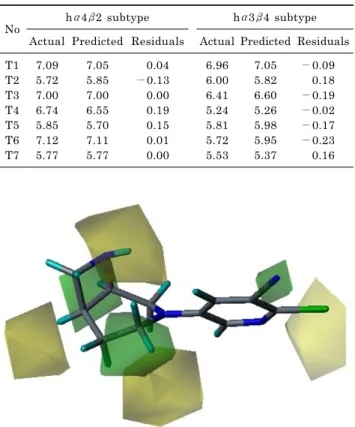
Molecular modeling and alignment

All calculation was carried out using SYBYL 8.0 molec- ular modeling software (SYBYL, 2008). Molecular struc- tures were sketched with sketch module in SYBYL and minimized by using TRIPOS force field with the Gasteiger Huckel charges and conjugated gradient method, and gra- dient convergence criteria of 0.05 kcal/mol. Simulated an- nealing on the energy minimized structures was performed with 50 cycles. They were heated at 2,000 K for 1,000 fs to reach the equilibrium and annealed to 200 K for 1,000 fs. The 50 conformations were then minimized to get low energy conformations for each compound.

The training set was aligned by using align database.

(2)

Table 1. Structures and biological activity of 3-N-substituted diazabicyclo[4.2.0]octanes

N N H N H

H R

1

R

2 61

3

No Stereoisomer R

1

R

2

hα4β2 (EC

50

, nM)

hα3β4 (EC

50

, nM) 1

2 3 4 5 6 7 T1

8 9 10 11 T2 12 13 14 15 16 17 18 19 T3 20 21 22 23

1R,6S 1S,6R 1R,6S 1S,6R 1R,6S 1S,6R 1R,6S 1S,6R 1R,6S 1S,6R 1R,6S 1S,6R 1R,6S 1S,6R 1R,6S 1S,6R 1R,6S 1S,6R 1R,6S 1S,6R 1S,6R 1R,6S 1S,6R 1R,6S 1S,6R 1R,6S

H H H H Br Br Cl Cl Br Br CH

3

CH

3

CN CN OMe OMe H H OEt OEt CH

3

H H OMe OMe CN

H H Cl Cl H H Cl Cl Br Br Cl Cl H H H H OMe OMe H H H NO2 NO2 Br Br Br

71 330 13 24 150 1,000 12 82 7.8 76

7.2 47 1,900 1,900 130 2,700 2,200 4,980 620 1,350 650 100 110 21 360 6.1

48 260 29 25 76 950 9.9 110

8.2 110

7.2 71 1,000 490 180 4,500 1,100 2,400 124 2,800 1,400 390 830 8.0 160

4.4

T4 1S,6R

NH2 HON

H 180 5,700

This table is shown only for reader’s convenience (J Med Chem 49: 7843−7853).

Table 2. Structures and biological activity of 8-N-substituted diazabicyclo[4.2.0]octanes

N HN N

H

H

R

1

R

2 1

6 8

No Stereoisomer R

1

R

2

hα4β2 (EC

50

, nM)

hα3β4 (EC

50

, nM) 24

T5 25 26 27 T6 28 T7 29 30 31 32 33 34 35 36 37

1R,6S 1S,6R 1R,6S 1S,6R 1S,6R 1R,6S 1S,6R 1R,6S 1S,6R 1R,6S 1S,6R 1R,6S 1S,6R 1R,6S 1S,6R 1R,6S 1S,6R

H H H H Cl CH

3

CH

3

OMe OMe CN CN CN CN CONH

2

CONH

2

OMe OMe

H H Cl Cl Cl Cl Cl Br Br H H Br Br Br Br H H

410 1,400 37.4 216 176 76.1 134 1,690 200 2,190 1,930 109 172 1,490 340 7,690 1,105

1,700 1,540 1,390 1,520 339 1,910 298 2,980 202 2,560 5,560 794 238 23,300 7,460 63,500 4,360 This table is shown only for reader’s convenience (J Med Chem 49: 7843−7853).

Fig. 1. The superimposed structures of aligned training set.

Compound (23) which showed the most potent activity was selected as template molecule, and pyridine moiety com- monly found in all compounds was used for common sub- structure in alignment. The superimposed structures of aligned training set is shown in Fig. 1.

CoMFA and CoMSIA Analysis

In CoMFA analysis, steric and electrostatic fields were calculated with Lennard-Jones potential and Coulombic po- tential, respectively. The sp

3

carbon probe atom with +1.0 charge and Van der Waals radius of 1.52 A

o

was used to calculate the CoMFA steric and electrostatic fields. The cut- off values of the steric and electrostatic energies were 30.0 kcal/mol. In CoMSIA analysis, the probe atom with radius 1.0 A°, charge +1.0, hydrophobicity +1.0, hydrogen bond donating +1.0, and hydrogen bond accepting +1.0 were used to calculate similarity indices. An attenuation factor 0.3 was used to estimate the steric, electrostatic, hydro- phobic, hydrogen bond donor, and acceptor fields in

CoMSIA. The predictivity of the model was estimated by using leave one out (LOO) crossvalidation with SAMPLS, in which the highest q

2

value and the lowest standard error of prediction suggest the optimum number of components.

RESULTS

The statistical data from CoMFA and CoMSIA are shown

in Table 3. For hα4β2 subtype model, statistical results

from CoMSIA (0.926) with steric and electrostatic fields

gave better q

2

than from CoMFA (0.892). The cross-vali-

dated value q

2

(0.926) and the non-cross-validated co-

efficient values r

2ncv

(0.983) indicate a good predictivity of

(3)

Table 3. CoMFA and CoMSIA results of the training set

Field* q

2†

N

SEP

§

r

2ncv∥

SEE

F** Contributions

S E H D A

hα4β2 subtype CoMFA S E SE CoMSIA SE SEH SED SEA SEDA SEHD SEHA SEHDA hα3β4 subtype CoMFA S E SE CoMSIA SE SEH SED SEA SEDA SEHD SEHA SEHDA

0.832 0.819 0.892

0.926 0.695 0.866 0.884 0.833 0.595 0.650 0.605

0.787 0.830 0.934

0.945 0.688 0.900 0.871 0.868 0.717 0.669 0.749

6 6 6

6 6 6 6 6 1 6 5

6 6 6

6 6 6 6 5 4 6 4

0.375 0.390 0.301

0.249 0.506 0.335 0.312 0.374 0.608 0.542 0.576

0.518 0.462 0.288

0.262 0.627 0.354 0.402 0.408 0.600 0.645 0.571

0.967 0.966 0.987

0.983 0.987 0.978 0.978 0.973 0.980 0.986 0.987

0.948 0.969 0.985

0.988 0.979 0.975 0.976 0.972 0.981 0.975 0.983

0.166 0.168 0.104

0.120 0.103 0.134 0.136 0.151 0.129 0.110 0.104

0.255 0.197 0.139

0.125 0.162 0.179 0.174 0.189 0.154 0.176 0.147

147.107 143.232 382.064

285.165 393.914 227.120 220.764 178.867 248.687 344.311 386.129

91.574 157.454 319.679

399.560 234.901 191.750 202.120 171.724 259.610 197.341 287.861

1

0.534

0.128 0.077 0.056 0.117 0.048 0.046 0.067 0.034

1

0.512

0.152 0.084 0.061 0.148 0.057 0.038 0.074 0.034

1 0.466

0.872 0.567 0.454 0.782 0.395 0.339 0.422 0.249

1 0.488

0.848 0.529 0.426 0.773 0.404 0.306 0.368 0.216

0.356

0.199 0.356 0.226

0.387

0.204 0.367 0.232

0.490

0.506 0.415

0.363

0.513

0.484 0.452

0.388

0.101 0.050

0.156 0.127

0.079 0.055

0.190 0.129

*Fields used, S=steric, E=electrostatic, H=hydrophobics, D=H-bond donor, A=H-bond acceptor;

q

2

, cross-validated correlation co- efficient from leave-one-out (LOO);

N, optimum number of components;

§

SEP, standard error of prediction;

r

2ncv

, non-cross-validated correlation coefficient;

SEE, standard error of estimate; **F, F-test value.

Table 4. CoMSIA actual and predicted activity (pEC

50

) of the training set

No hα4β2 subtype hα3β4 subtype

No hα4β2 subtype hα3β4 subtype

Actual Predicted Residuals Actual Predicted Residuals Actual Predicted Residuals Actual Predicted Residuals 1

2 3 4 5 6 7 8 9 10 11 12 13 14 15 16 17 18 19

7.15 6.48 7.89 7.62 6.82 6.00 7.92 8.11 7.12 8.14 7.33 5.72 6.89 5.57 5.66 5.30 6.21 5.87 6.19

7.37 6.54 7.86 7.78 6.63 6.07 8.03 7.84 7.05 8.09 7.29 5.72 6.92 5.60 5.56 5.32 6.20 5.64 6.14

−0.22

−0.06 0.03

−0.16 0.19

−0.07

−0.11 0.27 0.07 0.05 0.04 0.00

−0.03

−0.03 0.10

−0.02 0.01 0.23 0.05

7.32 6.59 7.54 7.60 7.12 6.02 8.00 8.09 6.96 8.14 7.15 6.31 6.74 5.35 5.96 5.62 6.91 5.55 5.85

7.17 6.54 7.73 7.36 7.29 6.11 8.15 7.91 7.05 8.06 7.20 6.20 6.56 5.41 6.17 5.58 6.94 5.66 5.83

0.15 0.05

−0.19 0.24

−0.17

−0.09

−0.15 0.18

−0.09 0.08

−0.05 0.11 0.18

−0.06

−0.21 0.04

−0.03

−0.11 0.02

20 21 22 23 24 25 26 27 28 29 30 31 32 33 34 35 36 37

6.96 7.68 6.44 8.21 6.39 7.43 6.67 6.75 6.87 6.70 5.66 5.71 6.96 6.76 5.83 6.47 5.11 5.96

7.04 7.73 6.39 8.00 6.41 7.60 6.71 6.90 6.95 6.58 5.90 5.92 7.02 6.73 5.78 6.54 5.06 5.98

−0.08

−0.05 0.05 0.21

−0.02

−0.17

−0.04

−0.15

−0.08 0.12

−0.24

−0.21

−0.06 0.03 0.05

−0.07 0.05

−0.02

6.08 8.10 6.80 8.36 5.77 5.86 5.82 6.47 6.53 6.69 5.59 5.25 6.10 6.62 4.63 5.13 4.20 5.36

6.00 8.22 6.79 8.24 5.63 5.89 5.80 6.58 6.52 6.73 5.53 5.42 6.08 6.63 4.51 5.16 4.28 5.28

0.08

−0.12 0.01 0.12 0.14

−0.03 0.02

−0.11 0.01

−0.04 0.06

−0.17 0.02

−0.01 0.12

−0.03

−0.08

0.08

(4)

Fig. 2. CoMSIA contour map of steric field for the hα4β2 subtype.

Fig. 3. CoMSIA contour map of electrostatic field for the hα4β2 subtype.

Table 5. CoMSIA actual and predicted activity (pEC

50

) of the test set

No hα4β2 subtype hα3β4 subtype

Actual Predicted Residuals Actual Predicted Residuals T1

T2 T3 T4 T5 T6 T7

7.09 5.72 7.00 6.74 5.85 7.12 5.77

7.05 5.85 7.00 6.55 5.70 7.11 5.77

0.04

− 0.13 0.00 0.19 0.15 0.01 0.00

6.96 6.00 6.41 5.24 5.81 5.72 5.53

7.05 5.82 6.60 5.26 5.98 5.95 5.37

− 0.09 0.18

− 0.19

− 0.02

− 0.17

− 0.23 0.16

Fig. 4. CoMSIA contour map of steric field for the hα3β4 subtype.

Fig. 5. CoMSIA contour map of electrostatic field for the hα3β4 subtype.

the model. The best predictive model gives 6 as optimum number of components, and 12.8% and 87.2%, as the rela- tive contributions of steric field and electrostatic field, re- spectively, showing a strong influence of the electrostatic interaction in activity. For hα3β4 subtype model, CoMSIA (0.945) with steric and electrostatic fields showed better q2 value than from CoMFA (0.934). A good predictivity of the model is suggested by the q

2

(0.945) and the r

2ncv

(0.988) coefficient values. The optimum number of components are 6, and the relative contributions of steric field (15.2%) and electrostatic field (84.8%) suggested a strong electrostatic

interaction in activity.

The actual and predicted activities in the training set are described in Table 4. The small residual values indicate that the calculated activities from CoMSIA model are corre- lated well with actual activity. The test set with 7 com- pounds was used to validate the predictivity of CoMSIA model, and they were computed and treated by the same method as in training set. The activity of test set was pre- dicted and compared with actual activity, which is shown in Table 5. The predicted values of test set were also corre- lated well with actual values.

DISCUSSION

The CoMSIA contour maps of steric and electrostatic field for hα4β2 subtype and hα3β4 subtype model are shown in Fig. 2, 3, 4, and 5, respectively. In the steric fields, steri- cally favorable areas are shown in green and sterically un- favorable areas are shown in yellow. In the electrostatic fields, the positively charged groups are favorable in blue regions and the negatively charged groups are favorable in red regions. The molecule in CoMSIA contour maps was compound (23) which showed the most potent activity.

For hα4β2 subtype model in Fig. 2, the sterically favored

green regions are close to C

1

, C

4

, and R

1

positions. The steri-

cally unfavored yellow regions are spaced near the N

8

, R

2

,

(5)

C

5

-C

6

and N

3

positions. For hα3β4 subtype in Fig. 4, one green contour was found near the C

5

-C

6

area, and two yel- low contours were shown at the upper side of N

8

-C

1

-C

2

-C

3

region and in the vicinity of R

1

substitution.

For hα4β2 subtype model in Fig. 3, the positive charge favorable blue regions are close to pyridine ring and R

1

posi- tions, whereas the negative charge favorable red region is located near the N

8

position. In hα3β4 subtype of Fig. 5, the four blue contours are found around the pyridine ring, R

1

, C

5

and C

1

-C

2

regions. The two red contours near the C

6

and at N

8

positions are negative charge favorable regions.

In conclusion, therefore, small groups at C

1

, C

4

and R

1

, hydrogen at C

5

, and negative charge atom at C

6

positions in 3-N-substituted diazabicyclo[4.2.0]octanes are showen to enhance the activity for hα4β2 subtype while reducing the activity for hα3β4 subtype.

ACKNOWLEDGMENTS

This Research was supported by Chung-Ang University Research Scholarship Grants in 2007-2008.

REFERENCES

Cashin AL, Torrice MM, McMenimen KA, Lester HA, Dougherty DA. Chemical-scale studies on the role of a conserved aspartate in preorganizing the agonist binding site of the nicotinic acetylcholine receptor. Biochemistry 46: 630−639, 2007 Dehkordi O, Millis RM, Dennis GC, Jazini E, Williams C, Hussain

D, Jayam-Trouth A. Expression of α-7 and α-4 nicotinic acetylcholine receptors by GABAergic neurons of rostral ventral medulla and caudal pons. Brain Res 1185: 95−102, 2007 Dougherty JJ, Wu J, Nichols RA. β-Amyloid regulation of

presynaptic nicotinic receptors in rat hippocampus and neocortex. J Neurosci 23: 6740−6747, 2003

Frost MJ, Bunnelle HW, Tietje KR, Anderson DJ, Rueter LE, Curzon P, Surowy CS, Jerome JJ, Kohlhaas DK, Buckley MJ, Henry RF, Dyhring T, Ahring PK, Meyer MD. Synthesis and structure-activity relationships of 3,8-diazabicyclo[4.2.0]octane ligands, potent nicotinic acetylcholine receptor agonists. J Med Chem 49: 7843−7853, 2006

Girod R, Barazangi N, McGehee D, Role LW. Facilitation of glutamatergic neurotransmission by presynaptic nicotinic acetylcholine receptors. Neuropharmacology 39: 2715−2725, Gotti C, Zoli M, Clementi F. Brain nicotinic acetylcholine receptors: 2000 native subtypes and their relevance Trends. Pharmacol Sci 27:

482−491, 2006

Grady SR, Salminen O, Laverty DC, Whiteaker P, McIntosh JM, Collins AC, Marks MJ. The subtypes of nicotinic acetylcholine receptors on dopaminergic terminals of mouse striatum.

Biochem Pharmacol 74: 1235−1246, 2007

Hays JT, Ebbert J, Sood A. Efficacy and safety of varenicline for smoking cessation. Am J Med 121: S32−S42, 2008

Hogg RC, Bertrand D. Neuroscience: What genes tell us about nicotine addiction. Science 306: 983−985, 2004

Jensen AA, Frølund B, Liljefors T, Krogsgaard LP. Neuronal nicotinic acetylcholine receptors: structural revelations, target identifications, and therapeutic inspirations. J Med Chem 48:

4705−4745, 2005

Kenny PJ, File SE, Neal MJ. Evidence for a complex influence of nicotinic acetylcholine receptors on hippocampal serotonin release. J Neurochem 75: 2409−2414, 2000

Kuryatov A, Onksen J, Lindstrom J. Roles of accessory subunits in α4β2 nicotinic receptors. Molecular Pharmacology 74: 132−

143, 2008

Lape R, Colquhoun D, Sivilotti LG. On the nature of partial agonism in the nicotinic receptor superfamily. Nature 454: 722−

727, 2008

O'Leary KT, Parameswaran N, Johnston LC, McIntosh JM, Di Monte DA, Quik M. Paraquat exposure reduces nicotinic receptor-evoked dopamine release in monkey striatum. J Pharmacol Exp Ther 327: 124−129, 2008

Owen RT, Serradell N, Rosa E. Ispronicline: nicotinic acetylcholine α 4β2 agonist treatment of cognition disorders. Drugs of the Future 33: 197−202, 2008

Pons S, Fattore L, Cossu G, Tolu S, Porcu E, McIntosh JM, Changeux JP, Maskos U, Fratta W. Crucial role of α4 and α6 nicotinic acetylcholine receptor subunits from ventral tegmental area in systemic nicotine self-administration. J Neurosci 28:

12318−12327, 2008

Vincler M, McIntosh JM. Targeting the α9 α10 nicotinic acetylcholine receptor to treat severe pain. Expert Opinion on Therapeutic Targets 11: 891−897, 2007

SYBYL Molecular Modeling Software. Tripos Inc., St. Louis, USA,

2008

수치

Table 2. Structures and biological activity of 8-N-substituted  diazabicyclo[4.2.0]octanes NHNNHH R 1R 2168 No Stereoisomer R 1 R 2 hα4β2 (EC 50 , nM) hα3β4(EC50 , nM) 24 T5 25 26 27 T6 28 T7 29 30 31 32 33 34 35 36 37 1R,6S1S,6R1R,6S1S,6R1S,6R1R,6S1S,6R1R
Table 4. CoMSIA actual and predicted activity (pEC 50 ) of the training set
Fig. 2. CoMSIA contour map of steric field for the hα4β2 subtype.

참조

관련 문서