Vol. 47, No. 1, pp. 85 - 92, 2006
Low birth weight is associated with insulin resistance and type 2 diabetes in adults. The fetal programming hypothesis has shown that insulin resistance and its associated metabolic disturbances result from a poor gestational environment, for which low birth weight is a surrogate. An at-home question- naire survey was performed on 660 middle school students (12-15 years) in Seoul, Korea, and 152 cases were randomly selected based on their birth weight. Subjects were divided into three groups according to birth weight. We recorded their birth weight and measured their current anthropometric data, blood pressure, lipid profile, HOMA-IR, and HOMA- , and com β - pared these parameters among the groups. The relation of birth weight to physiological characteristics in adolescence was examined. Systolic blood pressure, lipid profiles, and fasting plasma glucose, HOMA- β were not significantly different among the groups, but diastolic blood pressure was lower in the third tertile. Insulin, C-peptide, and HOMA-IR were higher in the lower birth weight tertile. After adjustment for con- founding factors, birth weight was inversely related to diastolic blood pressure, insulin, C-peptide, and HOMA-IR. We con- clude that low birth weight may predict the risk of the insulin resistance and its progression over age, and that adequate gestational nutrition is therefore necessary to prevent low birth weight.
Key Words: Birth weight, insulin resistance, adolescence
INTRODUCTION
Epidemiological studies have demonstrated that adults with a low birth weight are at an increased risk of developing type 2 diabetes mellitus (T2DM), which led to the hypothesis that metabolic syndrome may be closely asso- ciated with fetal nutritional state.
1Hales et al.
proposed the thrifty phenotype hypothesis as a cause of T2DM, by arguing that malnutrition during the fetal and neonatal periods impairs the development of endocrine function in the pancreas, resulting in an impairment of insulin secretion by -cells. β
2,3In addition, Barker et al.
4reported a higher death rate due to ischemic cardiac disease in a study of 5,654 men with low weight at birth and at 1 year of age. Such results suggest that poor nutrition during the fetal period may cause permanent structural and functional changes in the pancreas that may cause diabetes, hypertension, dyslipidemia, in- sulin resistance, and other metabolic impair- ments.
1,4In most studies on birth weight and insulin resistance, low birth weight infants show in- creased insulin resistance as adolescences or adults.
5However, studies on the relationship between birth weight and insulin resistance are very rare in Korea.
6Accordingly, the purpose of our study is to examine whether birth weight is related to insulin resistance, and to determine whether fetal programming perma- nently affects insulin resistance in Korean ado- lescents.
The Relation between Birth Weight and Insulin Resistance in Korean Adolescents
Chul-Sik Kim,
1Jong-Suk Park,
1Jina Park,
1Ji-Sun Nam,
1Eun-Seok Kang,
1Chul-Woo Ahn,
1Bong-Soo Cha,
1Sung-Kil Lim,
1Kyung-Rae Kim,
1Hyun-Chul Lee,
1Kap-Bum Huh,
1and Dae-Jung Kim
21
Department of Internal Medicine, Yonsei University College of Medicine, Seoul, Korea;
2
Department of Endocrinology and Metabolism, Ajou University School of Medicine, Suwon, Korea.
Received August 1, 2005 Accepted September 22, 2005
This study was supported by a grant from the Korea Health 21 R D Project, Ministry of Health Welfare, Republic of Korea (03-PJ1-PG1-CH05-0005).
Reprint address: requests to Dr. Chul-Woo Ahn, Department of
Internal Medicine, Yongdong Severance Hospital, College of
Medicine, Yonsei University, 146-92 Dogok-dong, Kangnam-gu,
Seoul 135-720, Korea. Tel: 82-2-2019-3339, Fax: 82-2-3463-3882,
E-mail: [email protected]
MATERIALS AND METHODS Subjects
In April 2003, an at-home questionnaire survey was administered to 660 middle school students (12-15 years old) in Seoul, Korea, and 152 cases were selected randomly based on their birth weight. Birth weight data was based on birth records, except in 21 cases (maternal recall) where birth weight was not available from the birth records. Tanner staging was completed during a complete physical examination by a pediatrician.
Subjects were divided into three groups ac- cording to birth weight. The subjects born prema- turely, earlier than 37 weeks gestation, and those with family history of diabetes (diabetes in either parent) were excluded from the study. The study protocol was approved by the Yonsei University College of Medicine Ethical Committee, and in- formed consent was obtained from each partici- pant.
Methods
Physical measurements
Body weight and height were measured in the morning, with participants wearing light clothing.
Body mass index (BMI) was calculated as body weight divided by height (kg/m
2). Waist circum- ference was determined using a measuring tape placed midway between the lowest rib and the iliac crest, with the participant standing on a flat floor with his or her feet 30 cm apart. Body fat percentage was evaluated by dual-energy X-ray absorptiometry (Hologic QDR 1500; Delphi, Wal- tham, MA, USA).
Blood pressure (mmHg) was measured twice after the subject had been resting in the supine position for 5 min with the use of an appropriate cuff size in relation to arm size. Diastolic blood pressure was determined as Korotkoff phase V.
The mean of the two measurements was used in further analyses.
Blood collection and serological testing
Participants fasted from 10 PM to 9 AM, at which time blood samples were collected. Plasma glucose levels were measured immediately with
an autoanalyzer using the hexokinase method (Hitachi 747; Roche, Montclair, NJ, USA). Serum insulin and C-peptide levels were determined using an enzyme chemiluminescence immuno- assay (ECIA, DPC, Immulite DPC, Los Angeles, USA). Serum total cholesterol and HDL-cho- lesterol were measured using a direct enzymatic method (Hitachi 747; Daiichi, Tokyo, Japan).
Serum triglyceride levels were measured by an enzymatic colorimetric method (Hitachi 747;
Roche, Almere, Japan/Germany), and LDL-cho- lesterol was calculated using the Friedewald equation.
7Measurement of insulin resistance and insulin secre- tion
Insulin resistance was estimated after fasting using the homeostasis model assessment method for insulin resistance (HOMA-IR), and the ability to secrete insulin was measured using a homeo- stasis model assessment of -cell function β (HOMA- ). These models were originally developed by β
Matthews, subsequently modified,
8,9and have been validated in patients with T2DM and obe- sity.
10,11The formulas are as follows: HOMA-IR = fasting insulin ( U/mL) μ × fasting plasma glucose (mmol/L)/22.5; HOMA-β = 20 × fasting insulin (μ U/ml)/[fasting plasma glucose (mmol/L)-3.5].
Statistical analysis
Descriptive statistics are presented as mean
values ± SD. We used an independent sample t-
test or Chi-square test for the comparison of males
and females, as appropriate. An ANOVA was per-
formed to compare birth weight, current age,
weight, height, BMI, waist circumference, and
body fat percentage of each group according to
their birth weight. The physiological character-
istics (systolic blood pressure, diastolic blood
pressure, total cholesterol, triglyceride, HDL-chol-
esterol, LDL-cholesterol, fasting plasma glucose,
insulin, C-peptide, HOMA-IR, and HOMA- ) β
were adjusted using a general linear model; the
covariates used were age, sex, height, weight,
waist circumference, body fat percentage, and
Tanner stage. The inclusion of covariates in the
general linear model removes its contribution to
the outcome variables. The relation of birth
weight to physiological characteristics in adoles-
cents was examined by partial correlation and adjusted for age, sex, height, weight, waist cir- cumference, body fat percentage, and Tanner stage. Statistical analyses were conducted using SPSS for Windows, version 11.0 (SPSS Inc., Chicago, IL, USA), and p < 0.05 was set as the level of significance.
RESULTS
Physical measurements and the clinical charac- teristics of the study subjects
Eighty subjects were male and seventy-two
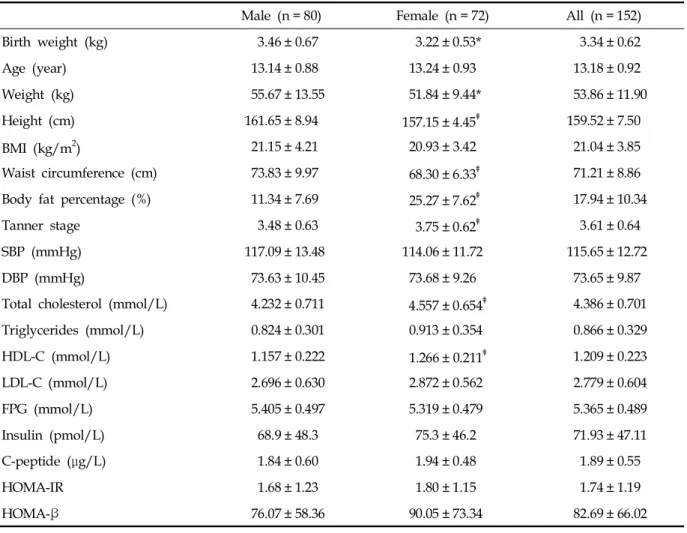
were female, with an average age of 13.18 ± 0.92 years. No statistically significant difference in age between genders was noted. Although height, weight, and waist circumference were greater in males compared to females, there was no dif- ference in BMI. Body fat percentage was higher in females. Blood pressure, fasting plasma glucose, insulin, C-peptide, HOMA-IR, and HOMA- were β not significantly different between males and females. On the other hand, total cholesterol and HDL-cholesterol levels were higher in females (both p < 0.01), but triglyceride and LDL-cho- lesterol levels were not significantly different (Table 1).
Subjects were grouped into thirds according to
Table 1. Clinical Characteristics of Subjects
Male (n = 80) Female (n = 72) All (n = 152)
Birth weight (kg) 3.46 ± 0.67 3.22 ± 0.53* 3.34 ± 0.62
Age (year) 13.14 ± 0.88 13.24 ± 0.93 13.18 ± 0.92
Weight (kg) 55.67 ± 13.55 51.84 ± 9.44* 53.86 ± 11.90
Height (cm) 161.65 ± 8.94 157.15 ± 4.45 159.52 ± 7.50
BMI (kg/m
2) 21.15 ± 4.21 20.93 ± 3.42 21.04 ± 3.85
Waist circumference (cm) 73.83 ± 9.97 68.30 ± 6.33 71.21 ± 8.86
Body fat percentage (%) 11.34 ± 7.69 25.27 ± 7.62 17.94 ± 10.34
Tanner stage 3.48 ± 0.63 3.75 ± 0.62 3.61 ± 0.64
SBP (mmHg) 117.09 ± 13.48 114.06 ± 11.72 115.65 ± 12.72
DBP (mmHg) 73.63 ± 10.45 73.68 ± 9.26 73.65 ± 9.87
Total cholesterol (mmol/L) 4.232 ± 0.711 4.557 ± 0.654 4.386 ± 0.701
Triglycerides (mmol/L) 0.824 ± 0.301 0.913 ± 0.354 0.866 ± 0.329
HDL-C (mmol/L) 1.157 ± 0.222 1.266 ± 0.211 1.209 ± 0.223
LDL-C (mmol/L) 2.696 ± 0.630 2.872 ± 0.562 2.779 ± 0.604
FPG (mmol/L) 5.405 ± 0.497 5.319 ± 0.479 5.365 ± 0.489
Insulin (pmol/L) 68.9 ± 48.3 75.3 ± 46.2 71.93 ± 47.11
C-peptide ( g/L) μ 1.84 ± 0.60 1.94 ± 0.48 1.89 ± 0.55
HOMA-IR 1.68 ± 1.23 1.80 ± 1.15 1.74 ± 1.19
HOMA-β 76.07 ± 58.36 90.05 ± 73.34 82.69 ± 66.02
Values are mean ± SD.
*p < 0.05 vs. male, p < 0.01 vs. male, p < 0.001 vs. male.
BMI, body mass index; WC, waist circumference; SBP, systolic blood pressure; DBP, diastolic blood pressure; HDL-C,
HDL-cholesterol, LDL-C, LDL-cholesterol; FPG, fasting plasma glucose; HOMA-IR, Homeostasis model assessment for insulin
resistance; HOMA- , Homeostasis model assessment for -cell function. β β
birth weight. Analysis of grouped data from males and females showed that birth weight cor- related with adolescent body size. Current weight, height, BMI, waist circumference, body fat per- centage, and Tanner stage all increased with birth weight tertile. Systolic blood pressure, lipid pro- files, fasting plasma glucose, and HOMA- were β not significantly different between groups, but diastolic blood pressure was lower in the third
tertile. Lower birth weight was related to insulin resistance in adolescence and insulin, C-peptide, and HOMA-IR were higher in the lower birth weight tertile (all p < 0.05) (Table 2).
Association of birth weight with physiological characteristics in adolescence
There was no significant relationship between Table 2. Anthropometric and Physiological Characteristics according to Thirds of Birth Weight
Birth weight (tertiles)
p value
1 2 3
Number 51 50 51
Sex (M:F) 27:24 26:24 27:25 0.994*
Birth weight (kg) 2.705 ± 0.316 3.314 ± 0.147 4.006 ± 0.402 0.000
Birth weight range (kg) 2.15-3.15 3.18-3.50 3.53-5.40
Age (year) 12.94 ± 0.93 13.34 ± 0.87 13.27 ± 0.87 0.057
Weight (kg) 48.84 ± 11.01 54.18 ± 9.86 58.56 ± 12.76 0.000
Height (cm) 156.55 ± 7.52 160.28 ± 6.31 161.75 ± 7.72 0.001
BMI (kg/m
2) 19.86 ± 3.88 21.01 ± 3.17 22.28 ± 4.09 0.006
WC (cm) 69.02 ± 8.65 71.03 ± 7.26 73.57 ± 10.00 0.033
Body fat percent (%) 15.32 ± 10.30 17.91 ± 9.04 20.60 ± 11.07 0.035
Tanner stage 3.39 ± 0.57 3.58 ± 0.57 3.84 ± 0.70 0.001
SBP (mmHg) 115.55 ± 13.86 116.34 ± 12.02 115.08 ± 12.42 0.175
DBP (mmHg) 74.51 ± 9.17 74.12 ± 9.98 72.33 ± 10.47 0.016
Total cholesterol (mmol/L) 4.443 ± 0.661 4.351 ± 0.649 4.363 ± 0.794 0.909
Triglyceride (mmol/L) 0.883 ± 0.345 0.863 ± 0.353 0.853 ± 0.292 0.321
HDL-C (mmol/L) 1.247 ± 0.149 1.218 ± 0.257 1.162 ± 0.243 0.646
LDL-C (mmol/L) 2.790 ± 0.626 2.739 ± 0.518 2.809 ± 0.666 0.704
FPG (mmol/L) 5.45 ± 0.46 5.28 ± 0.50 5.36 ± 0.50 0.510
Insulin (pmol/L) 57.26 ± 35.25 51.70 ± 36.09 45.86 ± 29.42 0.012
C-peptide ( g/L) μ 1.92 ± 0.54 1.88 ± 0.56 1.87 ± 0.56 0.008
HOMA-IR 1.96 ± 1.22 1.72 ± 1.32 1.52 ± 1.00 0.012
HOMA-β 87.36 ± 71.38 86.46 ± 69.78 74.48 ± 56.73 0.143
Values are mean ± SD.
*Analyzed by chi-square test.
Adjusted for age, sex, height, weight, waist circumference, body fat percent, and Tanner stage.
BMI, body mass index; WC, waist circumference; SBP, systolic blood pressure; DBP, diastolic blood pressure; HDL-C,
HDL-cholesterol, LDL-C, LDL-cholesterol; FPG, fasting plasma glucose; HOMA-IR, homeostasis model assessment for insulin
resistance; HOMA- , homeostasis model assessment for -cell function. β β
birth weight and physiological characteristics in adolescents, except for HDL-cholesterol (r = -0.167;
p = 0.040). However, each physiologic variable in adolescents correlated with current anthropome- tric parameters. Thus, we performed partial cor- relation analyses to examine the relationship between each physiological characteristic while controlling for the effects of current anthropo- metric parameters. After adjustment for gender, current age, height, weight, waist circumference, body fat percentage, and Tanner stage, birth weight was inversely related to diastolic blood pressure (r = -0.184; p = 0.029), insulin (r = -0.194; p
= 0.021), C-peptide (r = -0.237; p = 0.004), and HOMA-IR (r = -0.195; p = 0.020). But, the relation- ship between birth weight and HDL-cholesterol was attenuated (r = -0.071; p = 0.403) (Table 3).
DISCUSSION
After an epidemiological study showing the increased risk of developing T2DM in adults who were under-weight at birth, the hypothesis was proposed that insulin resistance syndrome and
metabolic syndrome are closely related to fetal nutritional state. In a study on residents of the Hertfordshire and Preston areas in England, Hales et al.
3reported that the weight at birth and 1 year correlate inversely to the development of diabetes in adults. The risk of diabetes is decreased as birth weight is increased. Thus, they argued that mal- nutrition during the fetal and neonatal period impairs the formation of the endocrinal pancreas, resulting in the impairment of insulin secretion by beta cells. Hales et al. proposed the thrifty phenotype hypothesis as a causality of T2DM.
2In addition, they reported that in 5,654 men who were underweight at birth and 2 years after birth, the death rate due to ischemic cardiac diseases was high,
4and in subsequent studies, they ob- served that blood pressure and plasma fibrinogen were increased in adults who had had low body weight compared to placenta weight.
12,13Such reports argue that maternal malnutrition during important periods for the fetus may cause per- manent structural and functional changes in specific organs such as the liver, blood vessels, pancreatic tissues, etc., and that the time of mal- nutrition and specific characteristics may deter- Table 3. Association of Birth Weight with Physiological Characteristics in Adolescents
Pearson’s correlation After adjustment*
r p value r p value
SBP (mmHg) -0.020 0.810 -0.118 0.161
DBP (mmHg) -0.095 0.243 -0.184 0.028
Total cholesterol (mmol/L) -0.104 0.203 -0.065 0.443
Triglyceride (mmol/L) -0.069 0.395 -0.089 0.292
HDL-C (mmol/L) -0.167 0.040 -0.054 0.527
LDL-C (mmol/L) -0.042 0.605 -0.034 0.684
FPG (mmol/L) -0.008 0.918 -0.039 0.643
Insulin (pmol/L) -0.142 0.083 -0.175 0.037
C-peptide ( g/L) μ -0.113 0.168 -0.224 0.005
HOMA-IR -0.150 0.066 -0.180 0.032
HOMA-β -0.088 0.283 -0.103 0.222
*Adjusted for age, sex, height, weight, waist circumference, body fat percent, and Tanner stage. BMI, body mass index; WC, waist circumference; SBP, systolic blood pressure; DBP, diastolic blood pressure; HDL-C, HDL-cholesterol, LDL-C, LDL-cholesterol; FPG, fasting plasma glucose; HOMA-IR, Homeostasis model assessment for insulin resistance; HOMA- , Homeostasis model assessment for β
-cell function.
β
mine the pattern of metabolic impairment such as diabetes, hypertension, dyslipidemia, etc. They proposed that impairment of the initial formation of beta cells in the pancreas may be an important factor for the development of T2DM. In other words, if the fetus is exposed to nutrition defici- ency or malnutrition during the active prolifera- tion of beta cells, the developing fetus undergoes metabolic adaptation.
14The developmental dys- genesis of endocrinal pancreas is induced during such processes and cannot completely recover by the intake of sufficient nutrition. Under such conditions, insulin secretion remains impaired, and in adults requiring increased amounts of insulin, diabetes may develop.
In most studies on birth weight and insulin resistance, low birth weight infants show in- creased insulin resistance as adolescences or adults.
5Similar results were obtained in a study of Koreans
6that investigated the relationships between birth weight and insulin secretion, resistance, and various anthropometric indices in- cluding visceral fat area in healthy young males.
They found a positive association between birth weight and insulin sensitivity in adult life.
However, there were some limitations in their study. First, the subjects were not randomly selected, and the study did not include both sexes.
In addition, although they found a positive rela- tionship between birth weight and insulin sensi- tivity in adulthood, they omitted the interaction between current insulin sensitivity and current body size.
The hypothesis that an adult disease has fetal origins is plausible, but much supporting evi- dence is flawed by incomplete and incorrect statis- tical interpretation.
15Some observational studies show a direct association between low birth weight and current adult health status.
12,16-19However, in other studies this relationship has emerged only after body size at some later period (notably current weight or body mass index) has been adjusted for.
20-25Adjusting for current size has been justified on the grounds that birth weight or size is positively related to later size, and also that current weight or fatness is posi- tively related to the outcome variable of interest (for example, LDL-cholesterol). If not adjusted for current weight or fatness, the relationship be-
tween birth weight and the outcome variable could be obscured.
26In our study, each physiologic variable (blood pressure, lipid profiles, HOMA index) in adoles- cence correlated with current anthropometric parameters (data not shown). Thus, we performed partial correlation analyses to examine the rela- tionship between each physiological characteristic in adolescence while controlling for the effects of current anthropometric parameters. Therefore, low birth weight was related to insulin resistance in adolescence; insulin, C-peptide, and HOMA-IR were higher in the lower birth weight tertile.
Meanwhile, birth weight correlated negatively to insulin, C-peptide, and HOMA-IR.
The finding of a non-significant difference in fasting plasma glucose levels among the birth weight tertiles for males and females was some- what unexpected. However, there were some dif- ferences in the patterns of the child-adult rela- tionship; in children, the relationships reported were inconsistent: absent, positive or U-shaped.
17,27,28